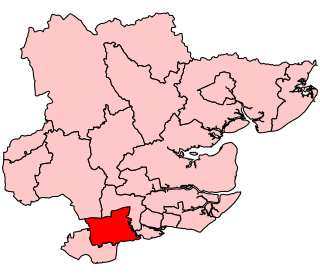
The 2002 Basildon District Council election took place on 2 May 2002 to elect members of Basildon District Council in Essex, England. The whole council was up for election with boundary changes since the last election in 2000. [1] The council stayed under no overall control. [2]
Essex is a county in the south-east of England, north-east of London. One of the home counties, it borders Suffolk and Cambridgeshire to the north, Hertfordshire to the west, Kent across the estuary of the River Thames to the south, and London to the south-west. The county town is Chelmsford, the only city in the county. For government statistical purposes Essex is placed in the East of England region.
England is a country that is part of the United Kingdom. It shares land borders with Wales to the west and Scotland to the north-northwest. The Irish Sea lies west of England and the Celtic Sea lies to the southwest. England is separated from continental Europe by the North Sea to the east and the English Channel to the south. The country covers five-eighths of the island of Great Britain, which lies in the North Atlantic, and includes over 100 smaller islands, such as the Isles of Scilly and the Isle of Wight.
In the context of local authorities in the United Kingdom, the term no overall control refers to a situation in which no single political group achieves a majority of seats; and is analogous to a hung parliament. Of the 310 councils who had members up for election in the 2007 local elections, 85 resulted in a NOC administration.
A review of the boundaries on Basildon council made changes for this election leading to the whole council being elected. [3] Several new wards were created for the election including Crouch, Pitsea South East and St Martin's. [3]
Pitsea is a small town in south Essex, England. It comprises five sub-districts: Eversley, Northlands Park Neighbourhood, Chalvedon, Pitsea Mount and Burnt Mills. It is part of the new town of Basildon.
Before the election both the Labour and Conservative parties had 19 seats, while the Liberal Democrats had 4 seats and Labour led a minority administration. [3] Several councillors stood down at the election including the Labour leader of the council John Potter. [3] Candidates standing in the election included the first member of the British National Party to do so, Matthew Single in Vange ward. [4]
The Labour Party is a centre-left political party in the United Kingdom which has been described as an alliance of social democrats, democratic socialists and trade unionists. The party's platform emphasises greater state intervention, social justice and strengthening workers' rights.
The Conservative Party, officially the Conservative and Unionist Party, is a centre-right political party in the United Kingdom. Presently led by Theresa May, it has been the governing party since 2010. It presently has 314 Members of Parliament in the House of Commons, 249 members of the House of Lords, and 18 members of the European Parliament. It also has 31 Members of the Scottish Parliament, 12 members of the Welsh Assembly, eight members of the London Assembly and 9,008 local councillors. One of the major parties of UK politics, it has formed the government on 45 occasions, more than any other party.
The Liberal Democrats are a liberal political party in the United Kingdom. They presently have 11 Members of Parliament in the House of Commons, 96 members of the House of Lords, and one member of the European Parliament. They also have five Members of the Scottish Parliament and a member each in the Welsh Assembly and London Assembly. The party reached the height of its influence in the early 2010s, forming a junior partner in a coalition government from 2010 to 2015. It is presently led by Vince Cable.
The results saw the Conservatives become the largest party on the council with 21 seats, but fail to win a majority. [5] They gained 1 seat each from Labour and the Liberal Democrats, who were left with 18 and 3 seats respectively. [5] However the expectation was that an alliance between Labour and the Liberal Democrats would continue to run the council as the outgoing Labour chairman could use his casting vote to keep Labour in power. [5] Meanwhile, the British National Party failed to win a seat after coming fifth in Vange ward. [5]
A casting vote is a vote that someone may exercise to resolve a deadlock. A casting vote is typically by the presiding officer of a council, legislative body, committee, etc., and may only be exercised to break a deadlock. Examples of officers who hold casting votes are the Speaker of the British House of Commons and the President of the United States Senate.
The British National Party (BNP) is a far-right, fascist political party in the United Kingdom. It is headquartered in Wigton, Cumbria, and its current leader is Adam Walker. A minor party, it has no elected representatives at any level of UK government. Founded in 1982, the party reached its greatest level of success in the 2000s, when it had over fifty seats in local government, one seat on the London Assembly, and two Members of the European Parliament.
Following the election the alliance between Labour and the Liberal Democrats was confirmed in control of the council, with Labour councillor Nigel Smith, husband of Member of Parliament for Basildon Angela Smith, becoming the new leader of the council. [6]
Basildon was a parliamentary constituency represented in the House of Commons of the Parliament of the United Kingdom. It elected one Member of Parliament (MP) by the first past the post system of election.
Angela Evans Smith, Baroness Smith of Basildon, is a British Labour Co-operative politician who was Member of Parliament (MP) for Basildon from 1997 until losing her seat to the Conservatives at the 2010 General Election.
Party | Seats | Gains | Losses | Net gain/loss | Seats % | Votes % | Votes | +/− | |
---|---|---|---|---|---|---|---|---|---|
Conservative | 21 | +2 | 50.0 | 48.0 | 41,157 | ||||
Labour | 18 | -1 | 42.9 | 34.4 | 29,475 | ||||
Liberal Democrat | 3 | -1 | 7.1 | 16.6 | 14,251 | ||||
Independent | 0 | 0 | 0 | 0.7 | 599 | ||||
BNP | 0 | 0 | 0 | 0.2 | 189 | ||||
Socialist Alliance | 0 | 0 | 0 | 0.1 | 93 | ||||
Party | Candidate | Votes | % | ± | |
---|---|---|---|---|---|
Conservative | Anthony Archer | 1,786 | 22.0 | ||
Conservative | Stuart Sullivan | 1,745 | 21.5 | ||
Conservative | David Dadds | 1,702 | 21.0 | ||
Liberal Democrat | Gilda Bellard | 623 | 7.7 | ||
Liberal Democrat | Dorothy Edwards | 597 | 7.4 | ||
Liberal Democrat | John James | 573 | 7.1 | ||
Labour | Anthony Bennett | 387 | 4.8 | ||
Labour | Conor O'Brien | 363 | 4.5 | ||
Labour | Kevin Wood | 341 | 4.2 | ||
Turnout | 8,117 | ||||
Party | Candidate | Votes | % | ± | |
---|---|---|---|---|---|
Conservative | Anthony Hedley | 1,965 | 25.1 | ||
Conservative | Philip Turner | 1,869 | 23.8 | ||
Conservative | Stephen Horgan | 1,844 | 23.5 | ||
Liberal Democrat | Francis Bellard | 556 | 7.1 | ||
Liberal Democrat | Craig Hands | 496 | 6.3 | ||
Liberal Democrat | Jonathan Myall | 373 | 4.8 | ||
Labour | Aidan McGurran | 253 | 3.2 | ||
Labour | Fiona Smith | 253 | 3.2 | ||
Labour | Mohamed Javed | 229 | 2.9 | ||
Turnout | 7,838 | ||||
Party | Candidate | Votes | % | ± | |
---|---|---|---|---|---|
Conservative | Geoffrey Buckenham | 1,627 | 20.9 | ||
Conservative | Desmond Lake | 1,521 | 19.6 | ||
Conservative | Kevin Blake | 1,469 | 18.9 | ||
Liberal Democrat | Belinda Jackson | 779 | 10.0 | ||
Liberal Democrat | James Edwards | 762 | 9.8 | ||
Liberal Democrat | Geoffrey Taylor | 757 | 9.7 | ||
Labour | Margaret Mary | 294 | 3.8 | ||
Labour | Viney Reid | 286 | 3.7 | ||
Labour | Patricia Reid | 272 | 3.5 | ||
Turnout | 7,767 | ||||
Party | Candidate | Votes | % | ± | |
---|---|---|---|---|---|
Conservative | Terri Sargent | 1,073 | 34.9 | ||
Conservative | Stuart Allen | 1,023 | 33.3 | ||
Labour | Wendy Aitken | 406 | 13.2 | ||
Labour | Eva Borlase | 322 | 10.5 | ||
Liberal Democrat | Arthur Ferriss | 248 | 8.1 | ||
Turnout | 3,072 | ||||
Party | Candidate | Votes | % | ± | |
---|---|---|---|---|---|
Labour | Janet Payn | 1,470 | 22.1 | ||
Labour | Paul Kirkman | 1,452 | 21.8 | ||
Labour | Julia Woods | 1,344 | 20.2 | ||
Conservative | Deborah Allen | 596 | 9.0 | ||
Conservative | Kenneth Evens | 560 | 8.4 | ||
Conservative | Harold Liebner | 501 | 7.5 | ||
Liberal Democrat | John Lutton | 279 | 4.2 | ||
Liberal Democrat | Stephen Nice | 224 | 3.4 | ||
Liberal Democrat | Tracey Williams | 222 | 3.3 | ||
Turnout | 6,648 | ||||
Party | Candidate | Votes | % | ± | |
---|---|---|---|---|---|
Labour | Barbara Croft | 1,148 | 20.6 | ||
Labour | William Archibald | 1,077 | 19.3 | ||
Labour | Anthony Borlase | 1,006 | 18.1 | ||
Conservative | John Schofield | 766 | 13.8 | ||
Conservative | Stephen Hills | 715 | 12.8 | ||
Conservative | Francis Tomlin | 691 | 12.2 | ||
Independent | Alfred Viccary | 165 | 3.0 | ||
Turnout | 5,568 | ||||
Party | Candidate | Votes | % | ± | |
---|---|---|---|---|---|
Conservative | Sandra Hillier | 923 | 27.2 | ||
Conservative | Stephen Hillier | 871 | 25.7 | ||
Independent | Derrick Fellowes | 434 | 12.8 | ||
Labour | Lynda Gordon | 392 | 11.6 | ||
Labour | Emily Evans | 363 | 10.7 | ||
Liberal Democrat | Linda Williams | 239 | 7.0 | ||
Liberal Democrat | Susan Dickinson | 171 | 5.0 | ||
Turnout | 3,393 | ||||
Party | Candidate | Votes | % | ± | |
---|---|---|---|---|---|
Labour | Nigel Smith | 1,165 | 20.3 | ||
Labour | Maureen Larkin | 1,159 | 20.2 | ||
Labour | Richard Rackham | 1,086 | 18.9 | ||
Conservative | Sharon Cleasby | 530 | 9.2 | ||
Conservative | Richard Hyland | 518 | 9.0 | ||
Conservative | Sharon Reid | 515 | 9.0 | ||
Liberal Democrat | Linda Martin | 241 | 4.2 | ||
Liberal Democrat | Michael James | 229 | 4.0 | ||
Liberal Democrat | Martin Neale | 214 | 3.7 | ||
Socialist Alliance | Richard Duane | 93 | 1.6 | ||
Turnout | 5,750 | ||||
Party | Candidate | Votes | % | ± | |
---|---|---|---|---|---|
Liberal Democrat | Geoffrey Williams | 1,268 | 15.1 | ||
Liberal Democrat | Joseph White | 1,245 | 14.9 | ||
Liberal Democrat | Benjamin Williams | 1,199 | 14.2 | ||
Labour | Michael Plant | 945 | 11.3 | ||
Labour | Andrew Manning | 930 | 11.1 | ||
Labour | Peter Wedlock | 841 | 10.0 | ||
Conservative | Henry Tucker | 676 | 8.1 | ||
Conservative | David Walsh | 642 | 7.7 | ||
Conservative | Christine Walsh | 636 | 7.6 | ||
Turnout | 8,382 | ||||
Party | Candidate | Votes | % | ± | |
---|---|---|---|---|---|
Labour | Keith Bobbin | 997 | 21.2 | ||
Labour | Allan Davies | 893 | 19.0 | ||
Labour | Philip Rackley | 856 | 18.2 | ||
Conservative | Roy Clarke | 543 | 11.5 | ||
Conservative | Mark Levey | 491 | 10.4 | ||
Conservative | Roy Watkinson | 456 | 9.7 | ||
Liberal Democrat | Martin Howard | 238 | 5.1 | ||
Liberal Democrat | Vivien Howard | 229 | 4.9 | ||
Turnout | 4,703 | ||||
Party | Candidate | Votes | % | ± | |
---|---|---|---|---|---|
Labour | Patrick Evans | 1,142 | 18.2 | ||
Conservative | Jacqueline Blake | 1,120 | 17.8 | ||
Labour | Dean Golding | 1,077 | 17.2 | ||
Conservative | Malcolm Geddes | 1,001 | 15.9 | ||
Conservative | Edward Phelan | 995 | 15.8 | ||
Labour | Andrew Powderly | 944 | 15.0 | ||
Turnout | 6,279 | ||||
Party | Candidate | Votes | % | ± | |
---|---|---|---|---|---|
Labour | Richard Llewellyn | 771 | 30.4 | ||
Labour | Colin Payn | 758 | 29.8 | ||
Conservative | Gwen Ball | 329 | 13.0 | ||
Conservative | Carol Mowe | 278 | 10.9 | ||
Liberal Democrat | Michael Dickinson | 213 | 8.4 | ||
Liberal Democrat | Annie Humphries | 191 | 7.5 | ||
Turnout | 2,540 | ||||
Party | Candidate | Votes | % | ± | |
---|---|---|---|---|---|
Labour | David Abrahall | 772 | 28.0 | ||
Labour | Swatantra Nandanwar | 665 | 24.1 | ||
Conservative | Garry Johnson | 403 | 14.6 | ||
Conservative | Philip Johnson | 380 | 13.8 | ||
BNP | Matthew Single | 189 | 6.9 | ||
Liberal Democrat | Peter Hulse | 178 | 6.5 | ||
Liberal Democrat | Seth Williams | 167 | 6.1 | ||
Turnout | 2,754 | ||||
Party | Candidate | Votes | % | ± | |
---|---|---|---|---|---|
Conservative | Malcolm Buckley | 1,165 | 33.4 | ||
Conservative | Sylvia Buckley | 1,099 | 31.5 | ||
Labour | Derek Burn | 356 | 10.2 | ||
Labour | Albert Ede | 316 | 9.0 | ||
Liberal Democrat | Kenneth Ward | 309 | 8.8 | ||
Liberal Democrat | Arnald Thorpe | 248 | 7.1 | ||
Turnout | 3,493 | ||||
Party | Candidate | Votes | % | ± | |
---|---|---|---|---|---|
Conservative | Anthony Ball | 1,658 | 22.9 | ||
Conservative | Carole Morris | 1,562 | 21.6 | ||
Conservative | Michael Mowe | 1,522 | 21.0 | ||
Labour | Jacqueline Brown | 639 | 8.8 | ||
Labour | Christopher Wilson | 543 | 7.5 | ||
Labour | Linda Howard | 489 | 6.8 | ||
Liberal Democrat | Michael Maguire | 454 | 6.3 | ||
Liberal Democrat | Ian Robertson | 368 | 5.1 | ||
Turnout | 7,235 | ||||
Party | Candidate | Votes | % | ± | |
---|---|---|---|---|---|
Conservative | Donald Morris | 731 | 32.9 | ||
Conservative | Christopher Jackman | 660 | 29.7 | ||
Labour | Leroy Stephenson | 237 | 10.7 | ||
Labour | Clive Thomas | 236 | 10.6 | ||
Liberal Democrat | Michael Woods | 208 | 9.3 | ||
Liberal Democrat | Fane Cummings | 153 | 6.9 | ||
Turnout | 2,225 | ||||
The 2004 Halton Borough Council election took place on 10 June 2004 to elect members of Halton Unitary Council in Cheshire, England. The whole council was up for election with boundary changes since the last election in 2002. The Labour party stayed in overall control of the council.
The 2000 Southend-on-Sea Council election took place on 4 May 2000 to elect members of Southend-on-Sea Unitary Council in Essex, England. One third of the council was up for election and the Conservative party gained overall control of the council from no overall control.
The 2006 Southend-on-Sea Council election took place on 4 May 2006 to elect members of Southend-on-Sea Unitary Council in Essex, England. One third of the council was up for election and the Conservative party stayed in overall control of the council.
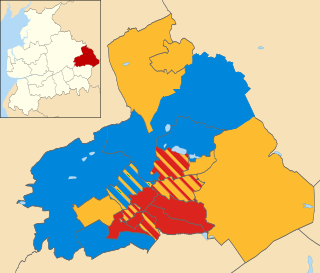
The 2007 Southend-on-Sea Council election took place on 3 May 2007 to elect members of Southend-on-Sea Unitary Council in Essex, England. One third of the council was up for election and the Conservative party stayed in overall control of the council.
The 2002 Pendle Borough Council election took place on 2 May 2002 to elect members of Pendle Borough Council in Lancashire, England. The whole council was up for election with boundary changes since the last election in 2000 reducing the number of seats by 2. The council stayed under no overall control.
The 2007 Sandwell Metropolitan Borough Council election took place on 3 May 2007 to elect members of Sandwell Metropolitan Borough Council in the West Midlands, England. One third of the council was up for election and the Labour party stayed in overall control of the council.
The 1999 Basildon District Council election took place on 6 May 1999 to elect members of Basildon District Council in Essex, England. One third of the council was up for election and the Labour party stayed in overall control of the council.
The 2000 Basildon District Council election took place on 4 May 2000 to elect members of Basildon District Council in Essex, England. One third of the council was up for election and the Labour party lost overall control of the council to no overall control.
The 2003 Basildon District Council election took place on 1 May 2003 to elect members of Basildon District Council in Essex, England. One third of the council was up for election and the Conservative party gained overall control of the council from no overall control.
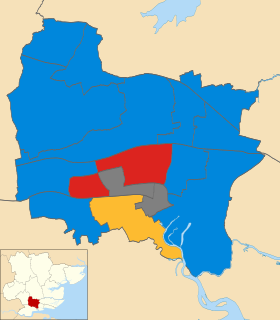
The 2006 Basildon District Council election took place on 4 May 2006 to elect members of Basildon District Council in Essex, England. One third of the council was up for election and the Conservative party stayed in overall control of the council.
The 2007 Basildon District Council election took place on 3 May 2007 to elect members of Basildon District Council in Essex, England. One third of the council was up for election and the Conservative party stayed in overall control of the council.
The 2008 Basildon District Council election took place on 1 May 2008 to elect members of Basildon District Council in Essex, England. One third of the council was up for election and the Conservative party stayed in overall control of the council.
The 2011 Basildon Council election took place on 5 May 2011 to elect members of Basildon Borough Council in Essex, England. One third of the council was up for election and the Conservative party stayed in overall control of the council.
The 2002 Basingstoke and Deane Council election took place on 2 May 2002 to elect members of Basingstoke and Deane Borough Council in Hampshire, England. The whole council was up for election with boundary changes since the last election in 2000 increasing the number of seats by 3. The council stayed under no overall control.
The 2006 Basingstoke and Deane Council election took place on 4 May 2006 to elect members of Basingstoke and Deane Borough Council in Hampshire, England. One third of the council was up for election and the council stayed under no overall control.
The 2002 Islington Council election took place on 2 May 2002 to elect members of Islington London Borough Council in London, England. The whole council was up for election with boundary changes since the last election in 1998 reducing the number of seats by 4. The Liberal Democrats stayed in overall control of the council.
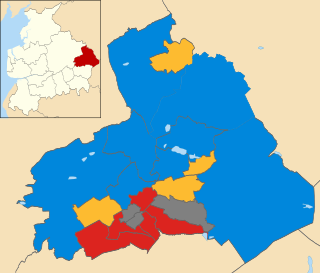
The 2011 Pendle Borough Council election took place on 5 May 2011 to elect members of Pendle Borough Council in Lancashire, England. One third of the council was up for election and the council stayed under no overall control.
The 2006 Brent London Borough Council election took place on 4 May 2006 to elect members of Brent London Borough Council in London, England. The whole council was up for election and the Labour party lost overall control of the council to no overall control.
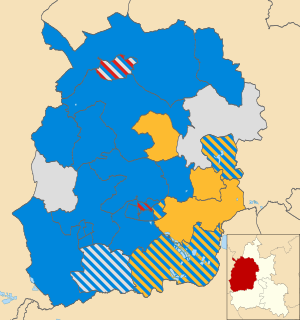
The 2002 West Oxfordshire District Council election took place on 2 May 2002 to elect members of West Oxfordshire District Council in Oxfordshire, England. The whole council was up for election with boundary changes since the last election in 2000. The Conservative party stayed in overall control of the council.