| |||||||||||||||||||||||||||||||||||||||||||||||||||||||||||||
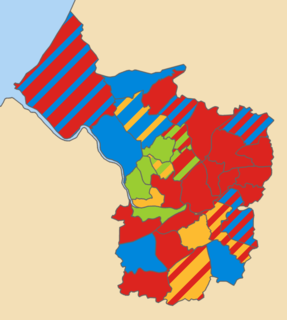
24 OF 70 seats (One Third) to Bristol City Council 36 seats needed for a majority | |||||||||||||||||||||||||||||||||||||||||||||||||||||||||||||
---|---|---|---|---|---|---|---|---|---|---|---|---|---|---|---|---|---|---|---|---|---|---|---|---|---|---|---|---|---|---|---|---|---|---|---|---|---|---|---|---|---|---|---|---|---|---|---|---|---|---|---|---|---|---|---|---|---|---|---|---|---|
| |||||||||||||||||||||||||||||||||||||||||||||||||||||||||||||
|
The 2015 Bristol City Council election took place on 7 May 2015 to elect members of Bristol City Council in England. [1] This was on the same day as other local elections.
Bristol City Council is the local authority of Bristol, England. The council is a unitary authority, and is unusual in the United Kingdom in that its executive function is controlled by a directly elected mayor of Bristol. Bristol has 35 wards, electing a total of 70 councillors.
In March 2015, the only Independent Councillor on Bristol City Council joined the Conservatives. This meant that the Conservatives increased their number of seats from the previous Council despite making no gains in the May election. [2]
Party | Candidate | Votes | % | ± | |
---|---|---|---|---|---|
Green | Gus Hoyt | 4,470 | 51.48 | +16.94 | |
Labour | Mary Southcott | 2,480 | 28.56 | -1.26 | |
Liberal Democrat | Nura Aabe | 1,085 | 12.50 | -15.97 | |
Conservative | Owen James Evans | 514 | 5.92 | +3.07 | |
TUSC | Ian Chard | 134 | 1.54 | +0.16 | |
Majority | 1990 | 22.92 | +18.2 | ||
Green hold | Swing | +9.1 | |||
Party | Candidate | Votes | % | ± | |
---|---|---|---|---|---|
Labour | Celia Christine Phipps | 2425 | 33.96 | -12.81 | |
Green | Alan Wilson Baker | 2161 | 30.27 | +7.81 | |
Conservative | Darien Luke Jay | 1715 | 24.02 | +5.79 | |
Liberal Democrat | Peter Henry Main | 606 | 8.49 | +1.41 | |
TUSC | Robin Clapp | 233 | 3.26 | -2.21 | |
Majority | 264 | 3.69 | -20.62 | ||
Labour hold | Swing | -10.31 | |||
Party | Candidate | Votes | % | ± | |
---|---|---|---|---|---|
Conservative | Richard Stephen Eddy | 2412 | 47.57 | +8.12 | |
Labour | Paul Goggin | 1777 | 35.05 | +5.86 | |
Green | Pip Sheard | 497 | 9.8 | +1.22 | |
Liberal Democrat | Gareth John David Owen | 238 | 4.69 | +1.26 | |
TUSC | David Rawlings | 146 | 2.88 | -0.4 | |
Majority | 635 | 12.52 | +2.26 | ||
Conservative hold | Swing | +1.13 | |||
Party | Candidate | Votes | % | ± | |
---|---|---|---|---|---|
Labour Co-op | Mike Langley | 1806 | 31.29 | -0.56 | |
Conservative | Perry Hicks | 1788 | 30.98 | +10.48 | |
UKIP | Simon Rodgers | 1071 | 18.56 | -9.6 | |
Green | Rachel Susannah Reed | 737 | 12.77 | +5.11 | |
Liberal Democrat | Pauline Mary Allen | 316 | 5.47 | -0.86 | |
TUSC | Andy Pryor | 54 | 0.94 | -0.17 | |
Majority | 18 | 0.31 | -3.38 | ||
Labour hold | Swing | -5.52 | |||
Party | Candidate | Votes | % | ± | |
---|---|---|---|---|---|
Labour | Eileen Means | 1582 | 26.39 | -4.48 | |
Liberal Democrat | Jos Clark | 1366 | 22.79 | -2.61 | |
Conservative | James Charles Hinchcliffe | 1241 | 20.70 | +4.79 | |
UKIP | Christopher James Robinson | 920 | 15.35 | -10.47 | |
Green | Natasha Kiran Clarke | 836 | 13.94 | N/A | |
TUSC | Louise Duncan | 50 | 0.83 | -1.17 | |
Majority | 261 | 3.6 | -1.45 | ||
Labour gain from Liberal Democrat | Swing | -0.94 | |||
Party | Candidate | Votes | % | ± | |
---|---|---|---|---|---|
Green | Ani Stafford-Townsend | 2916 | 38.47 | +18.21 | |
Labour | Kye Dudd | 1692 | 22.32 | -3.47 | |
Liberal Democrat | Alexander William Woodman | 1527 | 20.15 | -20.46 | |
Conservative | Will Luangrath | 1352 | 17.84 | +4.49 | |
TUSC | Chris Farrell | 93 | 1.23 | N/A | |
Majority | 1224 | 16.15 | +1.33 | ||
Green gain from Liberal Democrat | Swing | +10.84 | |||
Party | Candidate | Votes | % | ± | |
---|---|---|---|---|---|
Green | Jerome Ungoed Thomas | 2170 | 32.75 | +22.31 | |
Conservative | Martin Joseph Wright | 1856 | 28.01 | +1.25 | |
Liberal Democrat | Tom Stubbs | 1281 | 19.33 | +0.08 | |
Labour | John Halpin | 963 | 14.53 | +1.11 | |
Independents for Bristol | Stephen Perry | 314 | 4.74 | -18.2 | |
TUSC | Alfie Lethbridge | 42 | 0.63 | N/A | |
Majority | 314 | 4.74 | +0.92 | ||
Green gain from Liberal Democrat | Swing | +10.53 | |||
Party | Candidate | Votes | % | ± | |
---|---|---|---|---|---|
Green | Carla Suzanne Denyer | 1945 | 32.16 | +16.63 | |
Conservative | Sarah Helen Cleave | 1684 | 27.84 | -5.81 | |
Liberal Democrat | Christian Adam Martin | 1243 | 20.55 | -14.13 | |
Labour | Kerry Barker | 1019 | 16.85 | +0.72 | |
Independents for Bristol | Christine Townsend | 122 | 2.02 | N/A | |
TUSC | Ian Quick | 35 | 0.58 | N/A | |
Majority | 261 | 4.32 | +3.29 | ||
Green gain from Liberal Democrat | Swing | +11.22 | |||
Party | Candidate | Votes | % | ± | |
---|---|---|---|---|---|
Green | Dani Glazzard | 3174 | 42.90 | +24.54 | |
Liberal Democrat | Ian James Townsend | 1722 | 23.27 | -18.1 | |
Labour Co-op | Eileen Lepine | 1245 | 16.83 | -7.9 | |
Conservative | Thomas Seymour | 1203 | 16.26 | +2.21 | |
TUSC | Laura Collins | 55 | 0.74 | -0.75 | |
Majority | 1452 | 19.63 | +2.99 | ||
Green gain from Liberal Democrat | Swing | +21.32 | |||
Party | Candidate | Votes | % | ± | |
---|---|---|---|---|---|
Green | Anna McMullen | 3117 | 47.21 | +17.93 | |
Labour | Carole Johnson | 2140 | 32.41 | -1.54 | |
Liberal Democrat | Thom Oliver | 590 | 8.94 | -15.39 | |
Conservative | Bador Uddin | 471 | 7.13 | +3.99 | |
Independents for Bristol | Jane Westhead | 172 | 2.60 | -6.71 | |
Left Unity | Philip Edward Pope | 113 | 1.71 | N/A | |
Majority | 977 | 14.8 | +10.13 | ||
Green gain from Labour | Swing | +9.74 | |||
Party | Candidate | Votes | % | ± | |
---|---|---|---|---|---|
Labour | Mahmadur Khan | 2499 | 41.82 | +2.32 | |
Green | Simon Stafford-Townsend | 1260 | 21.08 | +12.45 | |
Conservative | Mike Williams | 1156 | 19.34 | +10.17 | |
Liberal Democrat | Chris Harris | 875 | 14.64 | -24.82 | |
TUSC | Mark Baker | 186 | 3.11 | -0.14 | |
Majority | 1239 | 20.74 | +20.7 | ||
Labour hold | Swing | -5.07 | |||
Party | Candidate | Votes | % | ± | |
---|---|---|---|---|---|
Labour | Jeff Lovell | 1980 | 47.30 | -12.09 | |
UKIP | Terence Richard Daniel Thomas | 1031 | 24.63 | N/A | |
Conservative | Sylvia Christine Windows | 588 | 14.05 | +0.65 | |
Green | Stephen Petter | 353 | 8.43 | -6.49 | |
Liberal Democrat | Crispin Toby John Allard | 200 | 4.78 | +0.24 | |
TUSC | Tony Rowe | 34 | 0.81 | -6.94 | |
Majority | 949 | 22.67 | -21.8 | ||
Labour hold | Swing | -18.36 | |||
Party | Candidate | Votes | % | ± | |
---|---|---|---|---|---|
Conservative | Lesley Ann Alexander | 1991 | 35.47 | +2.44 | |
Labour | Erica Wildgoose | 1803 | 32.12 | -2.24 | |
Green | Cath Thomas | 759 | 13.52 | +8.07 | |
UKIP | Pamela Edwina Hyde | 722 | 12.86 | -8.84 | |
Liberal Democrat | Graham Christopher Donald | 276 | 4.92 | +0.83 | |
TUSC | Roger Thomas | 62 | 1.10 | ||
Majority | 188 | 3.35 | +2.02 | ||
Conservative hold | Swing | +2.34 | |||
Party | Candidate | Votes | % | ± | |
---|---|---|---|---|---|
Labour | Mark Royston Brain | 1817 | 38.42 | -6.27 | |
Conservative | Jonathan Robert Hucker | 1227 | 25.95 | -2.14 | |
UKIP | Anthony Michael Burrell Orr | 1122 | 23.73 | N/A | |
Green | Ken Watt | 283 | 5.98 | -6.29 | |
Liberal Democrat | Paul Elvin | 241 | 5.10 | -0.19 | |
TUSC | Robert Nash | 39 | 0.82 | -8.85 | |
Majority | 590 | 12.47 | -4.13 | ||
Labour hold | Swing | -2.07 | |||
Party | Candidate | Votes | % | ± | |
---|---|---|---|---|---|
Labour | Barry David Clark | 1905 | 34.34 | +7.81 | |
Conservative | Antony Skelding | 1490 | 26.86 | +9.75 | |
UKIP | Gerard Joseph Robinson | 1273 | 22.95 | -8.07 | |
Liberal Democrat | Sylvia Kathleen Doubell | 603 | 10.87 | -5.46 | |
Green | Will Quick | 244 | 4.40 | +0.22 | |
TUSC | Patrick Hulme | 33 | 0.59 | -0.36 | |
Majority | 415 | 7.48 | +2.99 | ||
Labour hold | Swing | -0.97 | |||
Party | Candidate | Votes | % | ± | |
---|---|---|---|---|---|
Labour | Craig Cheney | 2491 | 41.14 | -11.83 | |
Conservative | Roy Towler | 1336 | 22.06 | +3.63 | |
UKIP | Mervyn Roger Laxon | 1088 | 17.97 | N/A | |
Green | Elsie Dragonfly Danann | 672 | 11.10 | -0.86 | |
Liberal Democrat | Andy Morgan | 382 | 6.31 | -1.18 | |
TUSC | Matt Gordon | 86 | 1.42 | -7.72 | |
Majority | 1155 | 19.08 | -15.46 | ||
Labour hold | Swing | -7.73 | |||
Party | Candidate | Votes | % | ± | |
---|---|---|---|---|---|
Liberal Democrat | Chris Davies | 2435 | 41.22 | -4.7 | |
Labour | Christopher Louis Orlik | 1499 | 25.37 | +0.9 | |
Green | Glenn Royston Vowles | 722 | 12.22 | +3.61 | |
UKIP | Claire Lisa Louise Hayes | 625 | 10.58 | -2.62 | |
Conservative | Anthony Paul Lee | 590 | 9.99 | +3.37 | |
TUSC | Domenico Hill | 37 | 0.63 | -0.56 | |
Majority | 936 | 15.85 | -5.6 | ||
Liberal Democrat hold | Swing | -2.8 | |||
Party | Candidate | Votes | % | ± | |
---|---|---|---|---|---|
Labour | Margaret Hickman | 3123 | 46.15 | -5.46 | |
Green | Jude English | 1872 | 27.66 | +19.44 | |
Conservative | Ahmed Mohamed Duale | 1024 | 15.13 | +10.33 | |
Liberal Democrat | Christian Barrow | 622 | 9.19 | -1.69 | |
TUSC | Giovanni Russo | 126 | 1.86 | -0.76 | |
Majority | 1251 | 18.49 | -20.26 | ||
Labour hold | Swing | -12.45 | |||
Party | Candidate | Votes | % | ± | |
---|---|---|---|---|---|
Green | Stephen Clarke | 3242 | 44.44 | +1.91 | |
Labour | Dwayne Leo Sinclair | 2093 | 28.69 | -4.38 | |
Conservative | James Andrew Hale Stevenson | 1215 | 16.66 | +9.43 | |
Liberal Democrat | Lena Clare Wright | 576 | 7.90 | +2.7 | |
TUSC | Matthew Carey | 169 | 2.32 | +0.42 | |
Majority | 1149 | 15.75 | +6.29 | ||
Green gain from Labour | Swing | +3.15 | |||
Party | Candidate | Votes | % | ± | |
---|---|---|---|---|---|
Labour | Fabian Guy Breckels | 2052 | 33.05 | -16.97 | |
Conservative | Kevin Robert Rainey | 1614 | 25.99 | -1.49 | |
UKIP | Jonathan Ralph Douglas Lewis | 1566 | 25.22 | N/A | |
Green | Rick Lovering | 581 | 9.36 | -1.68 | |
Liberal Democrat | Nicholas John Coombes | 333 | 5.36 | -0.89 | |
TUSC | Mike Luff | 63 | 1.01 | -4.2 | |
Majority | 438 | 7.06 | -15.48 | ||
Labour hold | Swing | -7.74 | |||
Party | Candidate | Votes | % | ± | |
---|---|---|---|---|---|
Labour | Sue Milestone | 2101 | 36.69 | -2.74 | |
Green | Matthew Whitney | 1148 | 20.05 | +2.98 | |
Conservative | David Thomas Harrison Lewis | 934 | 16.31 | +1.62 | |
UKIP | Claire Francesca Frost | 901 | 15.73 | N/A | |
Liberal Democrat | Tony Potter | 557 | 9.73 | -3.64 | |
TUSC | Wayne Coombes | 86 | 1.50 | -1.71 | |
Majority | 953 | 16.64 | -5.72 | ||
Labour hold | Swing | -2.86 | |||
Party | Candidate | Votes | % | ± | |
---|---|---|---|---|---|
Conservative | Graham David Morris | 2145 | 39.19 | -8.46 | |
Labour | David John McLeod | 1535 | 28.04 | -2.45 | |
UKIP | John Langley | 1144 | 20.90 | N/A | |
Green | Eleanor Rosie Vowles | 365 | 6.67 | -5.35 | |
Liberal Democrat | Ian Humfrey Campion-Smith | 253 | 4.62 | -0.73 | |
TUSC | Phil Bishop | 32 | 0.58 | -3.91 | |
Majority | 610 | 11.15 | -6.01 | ||
Conservative hold | Swing | -3.01 | |||
Party | Candidate | Votes | % | ± | |
---|---|---|---|---|---|
Labour | Helen Holland | 1687 | 37.36 | +14.05 | |
UKIP | Daniel Matthew Fear | 1122 | 24.85 | -3.42 | |
Conservative | Jenny Rogers | 985 | 21.82 | +13.82 | |
Liberal Democrat | Harriet Eva Clough | 536 | 11.87 | -24.74 | |
Green | Peter Antony Goodwin | 170 | 3.37 | +0.25 | |
TUSC | Frankie Langeland | 15 | 0.33 | -0.36 | |
Majority | 565 | 12.51 | +4.17 | ||
Labour hold | Swing | +8.74 | |||
Party | Candidate | Votes | % | ± | |
---|---|---|---|---|---|
Green | Deborah Mila Joffe | 2810 | 39.87 | +15.77 | |
Labour | Teresa Ann Stratford | 1821 | 25.84 | -3.15 | |
Liberal Democrat | Andrew Charles Brown | 1465 | 20.79 | -8.02 | |
Conservative | Barbara Madeleine Lewis | 845 | 11.99 | +5.52 | |
TUSC | Tom Baldwin | 107 | 1.52 | -0.94 | |
Majority | 989 | 14.03 | +13.85 | ||
Green gain from Liberal Democrat | Swing | +9.46 | |||
After the 2015 local election, the political make up of the council was as follows: [27]
Party | Number of councillors |
---|---|
Labour | 30 |
Conservative | 16 |
Green | 14 |
Liberal Democrats | 9 |
UKIP | 1 |
Bristol West is a borough constituency represented in the House of Commons of the Parliament of the United Kingdom. It covers the central and western parts of Bristol.
Bristol East is a constituency recreated in 1983 covering the eastern part of the City of Bristol, represented in the House of Commons of the UK Parliament since 2005 by Kerry McCarthy of the Labour Party. An earlier guise of the seat existed between 1885 and 1950.
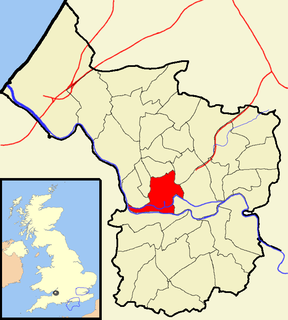
Cabot is a council ward that covers the centre of Bristol, England. It takes its name from the Cabot Tower – a memorial tower on Brandon Hill that was built to commemorate John Cabot's voyage and "discovery" of North America.
The city of Bristol is divided into many areas, which often overlap or have non-fixed borders. These include Parliamentary constituencies, council wards and unofficial neighbourhoods. There are no civil parishes in Bristol.
The city of Bristol, England, is a unitary authority, represented by four MPs representing seats wholly within the city boundaries. As well as these, Filton and Bradley Stoke covers the northern urban fringe in South Gloucestershire and the north eastern urban fringe is in the Kingswood constituency. The overall trend of both local and national representation became left of centre, favouring the Labour Party and Liberal Democrats during the latter 20th century, but there was a shift to the right in the 2010 general election. The city has a tradition of local activism, with environmental issues and sustainable transport being prominent issues in the city.
Bristol South East was a constituency in the city of Bristol that returned one Member of Parliament (MP) to the House of Commons of the Parliament of the United Kingdom.
Brislington West is a council ward of the city of Bristol, England. It covers the western part of Brislington, Arnos Vale, Kensington Park and St Anne's.
St George West is a district (Ward) of Bristol. Its councillors are Ron Stone and Peter Hammond . It can be found in the outer east of the city of Bristol. According to a report released by Bristol City Council, St George West has an average crime rate.
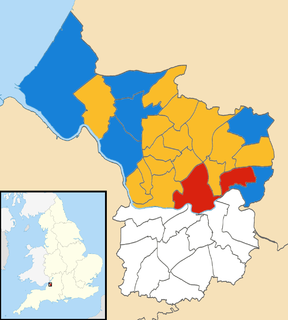
The 2009 Bristol City Council elections were held on Thursday 4 June 2009, for 23 seats, that being one-third of the total number of councilors. The Liberal Democrats who had been leading a minority administration, won an overall majority of the council, the first time the party had achieved this on Bristol City Council. The Liberal Democrats were defending 11 seats, the Labour Party 10 and the Conservatives 2.
The 2010 Bristol City Council elections were held on Thursday 6 May 2010, for 23 seats, that being one third of the total number of councillors. The Liberal Democrats, who had won overall control of the council in 2009, increased their majority to six seats.
Elections to City of York Council were held on Thursday 5 May 2011. The whole council was up for election. The vote took place alongside the United Kingdom Alternative Vote referendum, 2011.
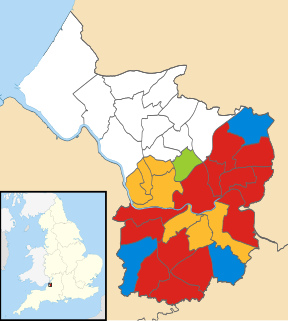
The 2011 Bristol City Council elections were held on Thursday 5 May 2011, for 24 seats, that being one third of the total number of councillors. The Liberal Democrats, who had won overall control of the council in 2009 and increased their majority in 2010, experienced a drop in support and lost 5 seats; 4 to the Labour Party and 1 to the Green Party, which gained its second ever council seat in Bristol. This meant that the Lib Dems no longer had a majority on the council. However, they continued to run the council, relying on opposition groups to vote through any proposal.
The 2012 City of Bradford Metropolitan District Council election took place on 3 May 2012. The elections took place shortly after the Bradford West by-election, in which the Respect Party's George Galloway pulled off a shock victory against the incumbent Labour Party. Held alongside was a referendum on directly elected mayors. The Labour Party were one seat short of an overall majority following the election, leaving the council in no overall control.
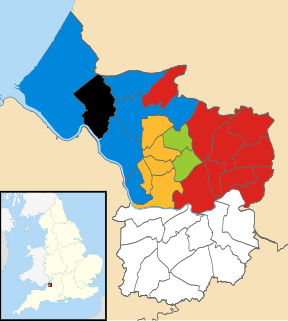
Elections for one third of Bristol City Council were held on 2 May 2013 as part of the United Kingdom local elections, 2013. No party gained overall control.
The 2014 Bristol City Council election took place on 22 May 2014 to elect members of Bristol City Council in England, as part of the United Kingdom 2014 Local Elections.
A by-thirds Hyndburn Borough Council local election took place on 7 May 2015. Approximately one third of the second tier council's 35 seats fell up for election, and the General Election was held on the same day.
The by-thirds 2015 Elmbridge Borough Council election took place on 7 May 2015 to elect members of Elmbridge Borough Council in England. This was on the same day as other local elections.
The 2015 East Dorset District Council election took place on 7 May 2015 in order to elect members of the East Dorset District Council in Dorset, England. The whole council was up for election after boundary changes reduced the number of seats by seven. The Conservative party stayed in overall control of the council.
The 2016 Bristol City Council election took place on Thursday 5 May 2016, alongside nationwide local elections. Following a boundary review, the number of wards in the City was reduced to 34, with each electing one, two or three Councillors. The overall number of Councillors remained 70, with all seats are up for election at the same time. Elections would then be held every 4 years.