A minimum wage is the lowest remuneration that employers can legally pay their employees—the price floor below which employees may not sell their labor. Most countries had introduced minimum wage legislation by the end of the 20th century. Because minimum wages increase the cost of labor, companies often try to avoid minimum wage laws by using gig workers, by moving labor to locations with lower or nonexistent minimum wages, or by automating job functions. Minimum wage policies can vary significantly between countries or even within a country, with different regions, sectors, or age groups having their own minimum wage rates. These variations are often influenced by factors such as the cost of living, regional economic conditions, and industry-specific factors.

Unemployment, according to the OECD, is people above a specified age not being in paid employment or self-employment but currently available for work during the reference period.

The United States is a highly developed/advanced mixed economy. It is the world's largest economy by nominal GDP; it is also the second largest by purchasing power parity (PPP), behind China. It has the world's sixth highest per capita GDP (nominal) and the eighth highest per capita GDP (PPP) as of 2024. The U.S. accounted for 26% of the global economy in 2023 in nominal terms, and about 15.5% in PPP terms. The U.S. dollar is the currency of record most used in international transactions and is the world's reserve currency, backed by a large U.S. treasuries market, its role as the reference standard for the petrodollar system, and its linked eurodollar. Several countries use it as their official currency and in others it is the de facto currency. Since the end of World War II, the economy has achieved relatively steady growth, low unemployment and inflation, and rapid advances in technology.

The United States had an official estimated resident population of 334,914,895 on July 1, 2023, according to the U.S. Census Bureau. This figure includes the 50 states and the Washington, D.C. but excludes the population of five unincorporated U.S. territories as well as several minor island possessions. The United States is the third most populous country in the world, and the most populous in the Americas and the Western Hemisphere. The Census Bureau showed a population increase of 0.4% for the twelve-month period ending in July 2022, below the world average annual rate of 0.9%. The total fertility rate in the United States estimated for 2022 is 1.665 children per woman, which is below the replacement fertility rate of approximately 2.1. By several metrics, including racial and ethnic background, religious affiliation, and percentage of rural and urban divide, Illinois is the most representative of the larger demography of the United States.

The Bureau of Labor Statistics (BLS) is a unit of the United States Department of Labor. It is the principal fact-finding agency for the U.S. government in the broad field of labor economics and statistics and serves as a principal agency of the U.S. Federal Statistical System. The BLS collects, processes, analyzes, and disseminates essential statistical data to the American public, the U.S. Congress, other Federal agencies, State and local governments, business, and labor representatives. The BLS also serves as a statistical resource to the United States Department of Labor, and conducts research measuring the income levels families need to maintain a satisfactory quality of life.

Kings County is a county located in the U.S. state of California. The population was 152,486 at the 2020 census. The county seat is Hanford.

Madera County, officially the County of Madera, is a county located at the geographic center of the U.S. state of California. It features a varied landscape, encompassing the eastern San Joaquin Valley and the central Sierra Nevada, with Madera serving as the county seat. Established in 1893 from part of Fresno County, Madera County reported a population of 156,255 in the 2020 census.

Santa Cruz County, officially the County of Santa Cruz, is a county on the Pacific coast of the U.S. state of California. As of the 2020 census, the population was 270,861. The county seat is Santa Cruz. Santa Cruz County comprises the Santa Cruz–Watsonville, CA Metropolitan Statistical Area, which is also included in the San Jose–San Francisco–Oakland, CA Combined Statistical Area. The county is on the California Central Coast, south of the San Francisco Bay Area region. The county forms the northern coast of the Monterey Bay, with Monterey County forming the southern coast.

In economics, a discouraged worker is a person of legal employment age who is not actively seeking employment or who has not found employment after long-term unemployment, but who would prefer to be working. This is usually because an individual has given up looking, hence the term "discouraged".
The economies of Canada and the United States are similar because both are developed countries. While both countries feature in the top ten economies in the world in 2022, the U.S. is the largest economy in the world, with US$24.8 trillion, with Canada ranking ninth at US$2.2 trillion.
A jobless recovery or jobless growth is an economic phenomenon in which a macroeconomy experiences growth while maintaining or decreasing its level of employment. The term was coined by the economist Nick Perna in the early 1990s.

Household income is an economic standard that can be applied to one household, or aggregated across a large group such as a county, city, or the whole country. It is commonly used by the United States government and private institutions to describe a household's economic status or to track economic trends in the US.

Income in the United States is measured by the various federal agencies including the Internal Revenue Service, Bureau of Labor Statistics, US Department of Commerce, and the US Census Bureau. Additionally, various agencies, including the Congressional Budget Office compile reports on income statistics. The primary classifications are by household or individual. The top quintile in personal income in 2019 was $103,012. The differences between household and personal income are considerable, since 61% of households now have two or more income earners.

Personal income is an individual's total earnings from wages, investment interest, and other sources. The Bureau of Labor Statistics reported a median weekly personal income of $1,139 for full-time workers in the United States in Q1 2024. For the year 2022, the U.S. Census Bureau estimates that the median annual earnings for all workers was $47,960; and more specifically estimates that median annual earnings for those who worked full-time, year round, was $60,070.
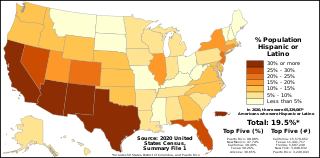
The demographics of Hispanic and Latino Americans depict a population that is the second-largest ethnic group in the United States, 62 million people or 18.7% of the national population.

In the United States, poverty has both social and political implications. In 2020, there were 37.2 million people in poverty. Some of the many causes include income, inequality, inflation, unemployment, debt traps and poor education. The majority of adults living in poverty are employed and have at least a high school education. Although the US is a relatively wealthy country by international standards, it has a persistently high poverty rate compared to other developed countries due in part to a less generous welfare system.
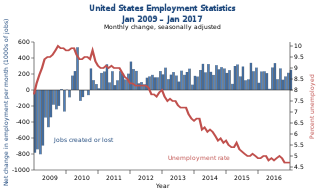
Unemployment in the United States discusses the causes and measures of U.S. unemployment and strategies for reducing it. Job creation and unemployment are affected by factors such as economic conditions, global competition, education, automation, and demographics. These factors can affect the number of workers, the duration of unemployment, and wage levels.