List of countries by electricity exports

Last updated

This is a list of countries by electricity exports mostly based on The World Factbook. [1]

RankCountryElectricity exports
(GWh)
Date of Information
1Flag of Canada (Pantone).svg  Canada 73,3502016 est.
1Flag of France.svg  France 73,3502019 est.
3Flag of Germany.svg  Germany 73,0402019 est.
4Flag of Paraguay.svg  Paraguay 42,2102018 est.
5Flag of Switzerland (Pantone).svg   Switzerland 30,1702016 est.
6Flag of Sweden.svg  Sweden 26,0202016 est.
7Flag of the Czech Republic.svg  Czechia 24,7902016 est.
8Flag of the Netherlands.svg  Netherlands 19,3402016 est.
9Flag of Austria.svg  Austria 19,2102016 est.
10Flag of the People's Republic of China.svg  China 18,9102016 est.
11Flag of South Africa.svg  South Africa 16,5502016 est.
12Flag of Norway.svg  Norway 15,5302016 est.
13Flag of Spain.svg  Spain 14,1802016 est.
14Flag of Russia.svg  Russia 13,1302016 est.
15Flag of Uzbekistan.svg  Uzbekistan 13,0002014 est.
16Flag of Mozambique.svg  Mozambique 12,8802015 est.
17Flag of Poland.svg  Poland 12,0202016
18Flag of Romania.svg  Romania 11,2202015 est.
19Flag of Slovakia.svg  Slovakia 10,6002016 est.
20Flag of Denmark.svg  Denmark 9,9192016 est.
21Flag of Portugal.svg  Portugal 9,7012016 est.
22Flag of the United States.svg  United States 9,6952016 est.
23Flag of Bulgaria.svg  Bulgaria 9,1872017 est.
24Flag of Laos.svg  Laos 8,4692015 est.
25Flag of Belgium (civil).svg  Belgium 8,4652016 est.
26Flag of Slovenia.svg  Slovenia 7,9722017 est.
27Flag of Mexico.svg  Mexico 7,3082016 est.
28Flag of Iran.svg  Iran 6,8222015 est.
29Flag of Serbia.svg  Serbia 5,6002020 data
30Flag of Italy.svg  Italy 6,1552016 est.
31Flag of Bosnia and Herzegovina.svg  Bosnia and Herzegovina 7,3172020 data
32Flag of Bhutan.svg  Bhutan 5,7632016 est.
33Flag of Estonia.svg  Estonia 5,6132016 est.
34Flag of Hungary.svg  Hungary 5,2402016 est.
35Flag of Israel.svg  Israel 5,2002016 est.
36Flag of India.svg  India 5,1502015 est.
37Flag of Kazakhstan.svg  Kazakhstan 5,1002017 est.
38Flag of Latvia.svg  Latvia 3,7952016 est.
39Flag of Ukraine.svg  Ukraine 3,5912015 est.
40Flag of Belarus.svg  Belarus 3,4822015 est.
41Flag of Turkmenistan.svg  Turkmenistan 3,2012015 est.
42Flag of Croatia.svg  Croatia 2, 4002020 data
43Flag of Finland.svg  Finland 3,1592016 est.
44Flag of Thailand.svg  Thailand 2,2672015 est.
45Flag of the United Kingdom.svg  United Kingdom 2,1532016 est.
46Flag of Albania.svg  Albania 1,8692016 est.
47Flag of Guatemala.svg  Guatemala 1,8582017 est.
48Flag of Ireland.svg  Ireland 1,5832016 est.
49Flag of Turkey.svg  Turkey 1,4422016 est.
50Flag of Armenia.svg  Armenia 1,4242015 est.
51Flag of Luxembourg.svg  Luxembourg 1,4202016 est.
52Flag of Tajikistan.svg  Tajikistan 1,4002015 est.
53Flag of Uruguay.svg  Uruguay 1,3212015 est.
54Flag of Zimbabwe.svg  Zimbabwe 1,2392015 est.
55Flag of Hong Kong.svg  Hong Kong 1,2052016 est.
56Flag of Zambia.svg  Zambia 1,1762015 est.
57Flag of Egypt.svg  Egypt 1,1582015 est.
58Flag of Greece.svg  Greece 1,0372016 est.
59Flag of Montenegro.svg  Montenegro 9142016 est.
60Flag of Kosovo.svg  Kosovo 885.72017 est.
61Flag of Cote d'Ivoire.svg  Cote d'Ivoire 8722015 est.
62Flag of Lithuania.svg  Lithuania 7302015 est.
63Flag of Vietnam.svg  Vietnam 7132017 est.
64Flag of Costa Rica.svg  Costa Rica 6432015 est.
65Flag of Algeria.svg  Algeria 6412015 est.
66Flag of Georgia.svg  Georgia 5602016 est.
67Flag of Honduras.svg  Honduras 5362015 est.
68Flag of Tunisia.svg  Tunisia 5002015 est.
69Flag of Nepal.svg    Nepal 493.61FY 2021 est.
70Flag of Colombia.svg  Colombia 4602015 est.
71Flag of the Democratic Republic of the Congo.svg  Democratic Republic of the Congo 4222015 est.
72Flag of Azerbaijan.svg  Azerbaijan 2652015 est.
73Flag of Syria.svg  Syria 2622015 est.
74Flag of Brazil.svg  Brazil 2192015 est.
75Flag of Bahrain.svg  Bahrain 2132015 est.
76Flag of Ecuador.svg  Ecuador 2112015 est.
77Flag of Ghana.svg  Ghana 1872016 est.
78Flag of Kyrgyzstan (2023).svg  Kyrgyzstan 1842015 est.
79Flag of Ethiopia.svg  Ethiopia 1662015 est.
80Flag of Morocco.svg  Morocco 1652015 est.
81Flag of Panama.svg  Panama 1392015 est.
82Flag of Uganda.svg  Uganda 1212015 est.
83Flag of El Salvador.svg  El Salvador 89.62017 est.
84Flag of Namibia.svg  Namibia 882015 est.
85Flag of Argentina.svg  Argentina 552015 est.
86Flag of Peru.svg  Peru 552015 est.
87Flag of Mongolia.svg  Mongolia 512015 est.
88Flag of Jordan.svg  Jordan 502015 est.
89Flag of Kenya.svg  Kenya 39.12016 est.
90Flag of the Republic of the Congo.svg  Republic of the Congo 222015 est.
91Flag of Nicaragua.svg  Nicaragua 17.872016 est.
92Flag of Rwanda.svg  Rwanda 42015 est.
93Flag of Malaysia.svg  Malaysia 32015 est.
94Flag of Andorra.svg  Andorra 0.0062015 est.
95Flag of the Taliban.svg  Afghanistan 02016 est.
96Flag of American Samoa.svg  American Samoa 02016 est.
97Flag of Angola.svg  Angola 02016 est.
98Flag of Antigua and Barbuda.svg  Antigua and Barbuda 02016 est.
99Flag of Aruba.svg  Aruba 02016 est.
100Flag of Australia (converted).svg  Australia 02016 est.
101Flag of the Bahamas.svg  The Bahamas 02016 est.
102Flag of Bangladesh.svg  Bangladesh 02016 est.
103Flag of Barbados.svg  Barbados 02017 est.
104Flag of Belize.svg  Belize 02016 est.
105Flag of Benin.svg  Benin 02016 est.
106Flag of Bermuda.svg  Bermuda 02016 est.
107Bandera de Bolivia (Estado).svg  Bolivia 02017 est.
108Flag of Botswana.svg  Botswana 02016 est.
Flag of the British Virgin Islands.svg  British Virgin Islands 02016 est.
109Flag of Brunei.svg  Brunei 02016 est.
110Flag of Burkina Faso.svg  Burkina Faso 02016 est.
111Flag of Myanmar.svg  Burma 02016 est.
112Flag of Burundi.svg  Burundi 02016 est.
113Flag of Cape Verde.svg  Cabo Verde 02016 est.
114Flag of Cambodia.svg  Cambodia 02016 est.
115Flag of Cameroon.svg  Cameroon 02016 est.
Flag of the Cayman Islands.svg  Cayman Islands 02016 est.
116Flag of the Central African Republic.svg  Central African Republic 02016 est.
117Flag of Chad.svg  Chad 02016 est.
118Flag of Chile.svg  Chile 02016 est.
119Flag of the Comoros.svg  Comoros 02016 est.
Flag of the Cook Islands.svg  Cook Islands 02016 est.
120Flag of Cuba.svg  Cuba 02016 est.
121Flag of Curacao.svg  Curacao 02009 est.
122Flag of Cyprus.svg  Cyprus 02016 est.
123Flag of Djibouti.svg  Djibouti 02016 est.
124Flag of Dominica.svg  Dominica 02016 est.
125Flag of the Dominican Republic.svg  Dominican Republic 02016 est.
126Flag of Equatorial Guinea.svg  Equatorial Guinea 02016 est.
127Flag of Eritrea.svg  Eritrea 02016 est.
128Flag of Eswatini.svg  Eswatini 02016
Flag of the Falkland Islands.svg  Falkland Islands (Islas Malvinas) 02016 est.
Flag of the Faroe Islands.svg  Faroe Islands 02016 est.
129Flag of Fiji.svg  Fiji 02016 est.
Flag of French Polynesia.svg  French Polynesia 02016 est.
130Flag of Gabon.svg  Gabon 02016 est.
131Flag of The Gambia.svg  The Gambia 02016 est.
Flag of Palestine.svg  Gaza Strip 02011 est.
132Flag of Gibraltar.svg  Gibraltar 02016 est.
133Flag of Greenland.svg  Greenland 02016 est.
134Flag of Grenada.svg  Grenada 02016 est.
135Flag of Guam.svg  Guam 02016 est.
136Flag of Guinea.svg  Guinea 02016 est.
137Flag of Guinea-Bissau.svg  Guinea-Bissau 02016 est.
138Flag of Guyana.svg  Guyana 02016 est.
139Flag of Haiti.svg  Haiti 02016 est.
140Flag of Iceland.svg  Iceland 02016 est.
141Flag of Indonesia.svg  Indonesia 02017 est.
142Flag of Iraq.svg  Iraq 02016 est.
143Flag of Jamaica.svg  Jamaica 02016 est.
144Flag of Japan.svg  Japan 02016 est.
145Flag of Kiribati.svg  Kiribati 02016 est.
146Flag of North Korea.svg  North Korea 02016 est.
147Flag of South Korea.svg  South Korea 02016 est.
148Flag of Kuwait.svg  Kuwait 02016 est.
149Flag of Lebanon.svg  Lebanon 02016 est.
150Flag of Lesotho.svg  Lesotho 02016 est.
151Flag of Liberia.svg  Liberia 02016 est.
152Flag of Libya.svg  Libya 02015 est.
153Flag of Liechtenstein.svg  Liechtenstein 02015 est.
Flag of Macau.svg  Macau 02016 est.
154Flag of Madagascar.svg  Madagascar 02016 est.
155Flag of Malawi.svg  Malawi 02016 est.
156Flag of Maldives.svg  Maldives 02016 est.
157Flag of Mali.svg  Mali 02016 est.
158Flag of Malta.svg  Malta 02016 est.
159Flag of the Marshall Islands.svg  Marshall Islands 02016 est.
160Flag of Mauritania.svg  Mauritania 02016 est.
161Flag of Mauritius.svg  Mauritius 02016 est.
162Flag of the Federated States of Micronesia.svg  Federated States of Micronesia 02013 est.
163Flag of Moldova.svg  Moldova 02016 est.
Flag of Montserrat.svg  Montserrat 02016 est.
164Flag of Nauru.svg  Nauru 02016 est.
Flags of New Caledonia.svg  New Caledonia 02016 est.
165Flag of New Zealand.svg  New Zealand 02016 est.
166Flag of Niger.svg  Niger 02016 est.
167Flag of Nigeria.svg  Nigeria 02016 est.
Flag of Niue.svg  Niue 02016 est.
Flag of the Northern Mariana Islands.svg  Northern Mariana Islands 02009 est.
168Flag of Oman.svg  Oman 02016 est.
169Flag of Pakistan.svg  Pakistan 02016 est.
170Flag of Papua New Guinea.svg  Papua New Guinea 02017 est.
171Flag of the Philippines.svg  Philippines 02017 est.
172Flag of Puerto Rico.svg  Puerto Rico 02016 est.
173Flag of Qatar.svg  Qatar 02016 est.
Flag of the United Kingdom.svg  Saint Helena, Ascension, and Tristan da Cunha 02016 est.
174Flag of Saint Kitts and Nevis.svg  Saint Kitts and Nevis 02016 est.
175Flag of Saint Lucia.svg  Saint Lucia 02016 est.
Flag of France.svg  Saint Pierre and Miquelon 02016 est.
176Flag of Saint Vincent and the Grenadines.svg  Saint Vincent and the Grenadines 02016 est.
177Flag of Samoa.svg  Samoa 02016 est.
178Flag of Sao Tome and Principe.svg  Sao Tome and Principe 02016
179Flag of Saudi Arabia.svg  Saudi Arabia 02016 est.
180Flag of Senegal.svg  Senegal 02016 est.
181Flag of Seychelles.svg  Seychelles 02016 est.
182Flag of Sierra Leone.svg  Sierra Leone 02016 est.
183Flag of Singapore.svg  Singapore 02016 est.
184Flag of the Solomon Islands.svg  Solomon Islands 02016 est.
185Flag of Somalia.svg  Somalia 02016 est.
186Flag of South Sudan.svg  South Sudan 02016 est.
187Flag of Sri Lanka.svg  Sri Lanka 02016 est.
188Flag of Sudan.svg  Sudan 02016 est.
189Flag of Suriname.svg  Suriname 02016 est.
190Flag of the Republic of China.svg  Taiwan 02016 est.
191Flag of Tanzania.svg  Tanzania 02016 est.
192Flag of East Timor.svg  Timor-Leste 02017 est.
193Flag of Togo.svg  Togo 02016 est.
194Flag of Tonga.svg  Tonga 02016
195Flag of Trinidad and Tobago.svg  Trinidad and Tobago 02016 est.
Flag of the Turks and Caicos Islands.svg  Turks and Caicos Islands 02016 est.
196Flag of Tuvalu.svg  Tuvalu 02014 est.
197Flag of the United Arab Emirates.svg  United Arab Emirates 02016 est.
198Flag of Vanuatu.svg  Vanuatu 02016 est.
199Flag of Venezuela.svg  Venezuela 02015 est.
Flag of the United States Virgin Islands.svg  U.S. Virgin Islands 02016 est.
200Flag of Palestine.svg  West Bank 02016
201Flag of Yemen.svg  Yemen 02016 est.

Related Research Articles

<span class="mw-page-title-main">Economy of Chad</span>

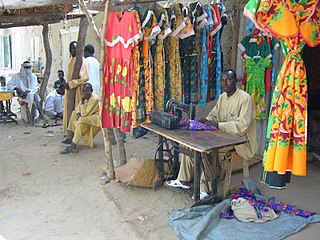
The economy of Chad suffers from the landlocked country's geographic remoteness, drought, lack of infrastructure, and political turmoil. About 85% of the population depends on agriculture, including the herding of livestock. Of Africa's Francophone countries, Chad benefited least from the 50% devaluation of their currencies in January 1994. Financial aid from the World Bank, the African Development Bank, and other sources is directed largely at the improvement of agriculture, especially livestock production. Because of lack of financing, the development of oil fields near Doba, originally due to finish in 2000, was delayed until 2003. It was finally developed and is now operated by ExxonMobil. In terms of gross domestic product, Chad ranks 147th globally with $11.051 billion as of 2018.

<span class="mw-page-title-main">Economy of the Federated States of Micronesia</span>

The economic activity of the Federated States of Micronesia consists primarily of subsistence agriculture and fishing. The islands have few mineral deposits worth exploiting, except for high-grade phosphate. The potential for a tourist industry exists, but the remoteness of the location and a lack of adequate facilities hinder development. Financial assistance from the US is the primary source of revenue, with the US pledged to spend $1.3 billion in the islands in 1986–2001. Geographical isolation and a poorly developed infrastructure are major impediments to long-term growth.

<span class="mw-page-title-main">Economy of Gabon</span>

The economy of Gabon is characterized by strong links with France, large foreign investments, dependence on skilled foreign labor, and decline of agriculture. Gabon on paper enjoys a per capita income four times that of most nations of Africa, but its reliance on resource extraction industry fail to release much of the population from extreme poverty, as much of 30% of the population lives under the poverty threshold.

<span class="mw-page-title-main">Economy of Grenada</span>

The economy of Grenada is a largely tourism-based, small and open economy. Over the past two decades, the main thrust of Grenada's economy has shifted from agriculture to services, with tourism serving as the leading foreign currency earning sector. The country's principal export crops are the spices nutmeg and mace. Other crops for export include cocoa, citrus fruits, bananas, cloves, and cinnamon. Manufacturing industries in Grenada operate mostly on a small scale, including production of beverages and other foodstuffs, textiles, and the assembly of electronic components for export.

<span class="mw-page-title-main">Economy of Malawi</span>

The economy of Malawi is $7.522 billion by gross domestic product as of 2019, and is predominantly agricultural, with about 80% of the population living in rural areas. The landlocked country in south central Africa ranks among the world's least developed countries. In 2017, agriculture accounted for about one-third of GDP and about 80% of export revenue. The economy depends on substantial inflows of economic assistance from the IMF, the World Bank, and individual donor nations. The government faces strong challenges: to spur exports, to improve educational and health facilities, to face up to environmental problems of deforestation and erosion, and to deal with the problem of HIV/AIDS in Africa. Malawi is a least developed country according to United Nations.

<span class="mw-page-title-main">Economy of Nepal</span>

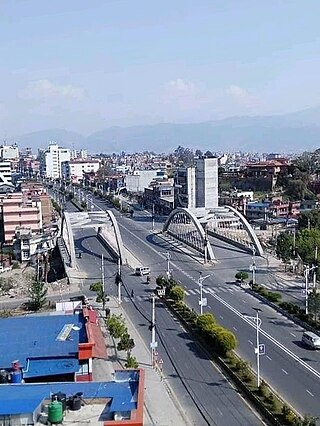
The economy of Nepal is developing category and largely dependent on agriculture and remittances. Until the mid-20th century Nepal was an isolated pre-industrial society, which entered the modern era in 1951 without schools, hospitals, roads, telecommunications, electric power, industry, or civil service. The country has, however, made progress toward sustainable economic growth since the 1950s. The country was opened to economic liberalization, leading to economic growth and improvement in living standards when compared to the past. The biggest challenges faced by the country in achieving higher economic development are the frequent changes in political leadership, as well as corruption.

<span class="mw-page-title-main">Economy of Nicaragua</span>

The economy of Nicaragua is focused primarily on the agricultural sector. Nicaragua itself is the least developed country in Central America, and the second poorest in the Americas by nominal GDP. In recent years, under the administrations of Daniel Ortega, the Nicaraguan economy has expanded somewhat, following the Great Recession, when the country's economy actually contracted by 1.5%, due to decreased export demand in the American and Central American markets, lower commodity prices for key agricultural exports, and low remittance growth. The economy saw 4.5% growth in 2010 thanks to a recovery in export demand and growth in its tourism industry. Nicaragua's economy continues to post growth, with preliminary indicators showing the Nicaraguan economy growing an additional 5% in 2011. Consumer Price inflation have also curtailed since 2008, when Nicaragua's inflation rate hovered at 19.82%. In 2009 and 2010, the country posted lower inflation rates, 3.68% and 5.45%, respectively. Remittances are a major source of income, equivalent to 15% of the country's GDP, which originate primarily from Costa Rica, the United States, and European Union member states. Approximately one million Nicaraguans contribute to the remittance sector of the economy.

<span class="mw-page-title-main">Economy of Saint Vincent and the Grenadines</span>

The economy of Saint Vincent and the Grenadines is heavily dependent on agriculture, being the world's leading producer of arrowroot and grows other exotic fruit, vegetables and root crops. Bananas alone account for upwards of 60% of the work force and 50% of merchandise exports in Saint Vincent and the Grenadines. Such reliance on a single crop makes the economy vulnerable to external factors. St. Vincent's banana growers benefited from preferential access to the European market. In view of the European Union's announced phase-out of this preferred access, economic diversification is a priority.

The economy of Samoa is dependent on agricultural exports, development aid and private financing from overseas. The country is vulnerable to devastating storms. Agriculture employs two-thirds of the labor force, and furnishes 9% of exports, featuring coconut cream, coconut oil and copra. Outside a large automotive wire harness factory, the manufacturing sector mainly processes agricultural products. Tourism is an expanding sector; more than 70,000 tourists visited the islands in 1996 and 120,000 in 2014. The Samoan Government has called for deregulation of the financial sector, encouragement of investment, and continued fiscal discipline. Observers point to the flexibility of the labor market as a basic strength factor for future economic advances.

<span class="mw-page-title-main">Economy of Sierra Leone</span>

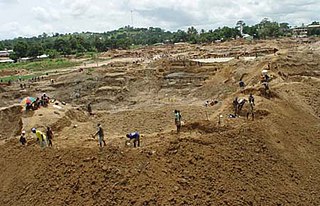
The economy of Sierra Leone is $4.082 billion by gross domestic product as of 2018. Since the end of the Sierra Leone Civil War in 2002, the economy is gradually recovering with a gross domestic product growth rate between 4 and 7%. In 2008 it in PPP ranked between 147th by World Bank, and 153rd by CIA, largest in the world.

The economy of Eswatini is fairly diversified. Agriculture, forestry and mining account for about 13 percent of Eswatini's GDP whereas manufacturing represent 37 percent of GDP. Services – with government services in the lead – constitute the other 50 percent of GDP.

<span class="mw-page-title-main">Economy of Vanuatu</span>

Vanuatu's economy is primarily agricultural; 80% of the population is engaged in agricultural activities that range from subsistence farming to smallholder farming of coconuts and other cash crops.

<span class="mw-page-title-main">Economy of Saint Kitts and Nevis</span>

The economy of Saint Kitts and Nevis has traditionally depended on the growing and processing of sugar cane; decreasing world prices have hurt the industry in recent years. Tourism, export-oriented manufacturing, and offshore banking activity have assumed larger roles in Saint Kitts and Nevis. Most food is imported. The government has undertaken a program designed to revitalize the faltering sugar sector. It is also working to improve revenue collection in order to better fund social programs. In 1997, some leaders in Nevis were urging separation from Saint Kitts on the basis that Nevis was paying far more in taxes than it was receiving in government services, but the vote on cessation failed in August 1998. In late September 1998, Hurricane Georges caused approximately $445 million in damages and limited GDP growth for the year.

<span class="mw-page-title-main">Economy of Andorra</span>

The economy of Andorra is a developed and free market economy driven by finance, retail, and tourism. The country's gross domestic product (GDP) was US$5.70 billion in 2023. Attractive for shoppers from France and Spain as a free port, Andorra also has developed active summer and winter tourist resorts. With some 270 hotels and 400 restaurants, as well as many shops, the tourist trade employs a growing portion of the domestic labour force. An estimated 13 million tourists visit annually.

<span class="mw-page-title-main">Energy in Russia</span> Overview of the production, consumption, import and export of energy and electricity in Russia

Energy consumption across Russia in 2020 was 7,863 TWh. Russia is a leading global exporter of oil and natural gas and is the fourth highest greenhouse emitter in the world. As of September 2019, Russia adopted the Paris Agreement In 2020, CO2 emissions per capita were 11.2 tCO2.

<span class="mw-page-title-main">Economy of Ivory Coast</span>

The economy of Ivory Coast is stable and currently growing, in the aftermath of political instability in recent decades. The Ivory Coast's economy is largely market-based and depends heavily on the agricultural sector. Almost 70% of the Ivorian people are engaged in some form of agricultural activity. GDP per capita grew 82% in the 1960s, reaching a peak growth of 360% in the 1970s, but this proved unsustainable and it shrank by 28% in the 1980s and a further 22% in the 1990s. This decline, coupled with high population growth, resulted in a steady fall in living standards. The Gross national product per capita, now rising again, was about US$727 in 1996. It was substantially higher two decades before.

<span class="mw-page-title-main">Energy in Equatorial Guinea</span>

Energy in Equatorial Guinea is an industry with plenty of potential, especially in the fields of oil and natural gas. However, production has been declining in recent years due to under-investment and lack of new discoveries. In 2022, the country produced less than 100,000 barrels of oil per day (bopd) according to OPEC data.

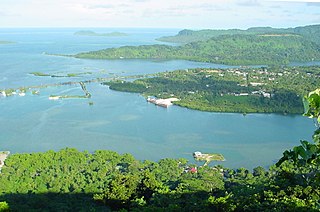
The economy of Guam depends mainly on US military spending and on tourist revenue. Over the past 20 years, the tourist industry grew rapidly, creating a construction boom for new hotels, golf courses and other tourist amenities. More than 1.1 million tourists visit Guam each year including about 1,000,000 from Japan and 150,000 from Korea. Setbacks in the 1990s include numerous super-typhoons, a M7.8 earthquake, and a Korean airline crash.

<span class="mw-page-title-main">Economy of Tonga</span>

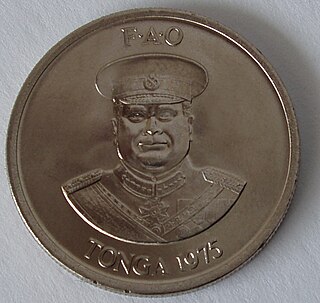
Tonga's economy is characterized by a large nonmonetary sector and a heavy dependence on remittances from the half of the country's population that lives abroad, chiefly in Australia, New Zealand, and the United States. Much of the monetary sector of the economy is dominated, if not owned, by the royal family and nobles. This is particularly true of the telecommunications and satellite services. Much of small business, particularly retailing on Tongatapu, is now dominated by recent Chinese immigrants who arrived under a cash-for-passports scheme that ended in 1998.

<span class="mw-page-title-main">Energy in Liechtenstein</span>

Energy in Liechtenstein describes energy production, consumption and import in Liechtenstein.

References