
The economy of Rwanda has undergone rapid industrialisation due to a successful governmental policy. It has a mixed economy. Since the early-2000s, Rwanda has witnessed an economic boom, which improved the living standards of many Rwandans. The President of Rwanda, Paul Kagame, has noted his ambition to make Rwanda the "Singapore of Africa". The industrial sector is growing, contributing 16% of GDP in 2012.

The pineapple is a tropical plant with an edible fruit; it is the most economically significant plant in the family Bromeliaceae.

Guava is a common tropical fruit cultivated in many tropical and subtropical regions. The common guava Psidium guajava is a small tree in the myrtle family (Myrtaceae), native to Mexico, Central America, the Caribbean and northern South America. The name guava is also given to some other species in the genus Psidium such as strawberry guava and to the pineapple guava, Feijoa sellowiana. In 2019, 55 million tonnes of guavas were produced worldwide, led by India with 45% of the total. Botanically, guavas are berries.

Fiber crops are field crops grown for their fibers, which are traditionally used to make paper, cloth, or rope.

Golden Circle is a subsidiary of US-based Kraft Heinz, based in Brisbane, Queensland. Its main operations are food processing. Golden Circle was inducted into the Queensland Business Leaders Hall of Fame in 2010, for its significant contribution to the economy of Queensland through the processing of food products, notably fruit and vegetables.

Pekan Nanas is a town located in Pontian District, Johor, Malaysia famous for its Pineapple plantation industry. It was Malaysia's largest production base for pineapple planting area.
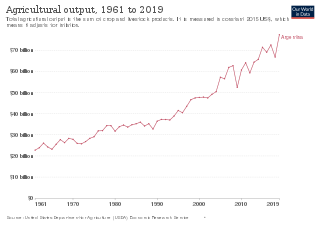
Agriculture is one of the bases of Argentina's economy.

Agriculture in the Philippines is a major sector of the economy, ranking third among the sectors in 2022 behind only Services and Industry. Its outputs include staples like rice and corn, but also export crops such as coffee, cavendish banana, pineapple and pineapple products, coconut, sugar, and mango. The sector continues to face challenges, however, due to the pressures of a growing population. As of 2022, the sector employs 24% of the Filipino workforce and it accounted for 8.9% of the total GDP.

Agriculture is one of the main industries in Taiwan. It contributes to the food security, rural development and conservation of Taiwan. Around 24% of Taiwan's land is used for farming.
Agriculture in Cameroon is an industry that has plenty of potential.

Pineapple juice is a juice made from pressing the natural liquid out from the pulp of the pineapple. Numerous pineapple varieties may be used to manufacture commercial pineapple juice, the most common of which are Smooth Cayenne, Red Spanish, Queen, and Abacaxi. In manufacturing, pineapple juice is typically canned.

The economy of Ivory Coast is stable and currently growing, in the aftermath of political instability in recent decades. The Ivory Coast's economy is largely market-based and depends heavily on the agricultural sector. Almost 70% of the Ivorian people are engaged in some form of agricultural activity. The economy grew 82% in the 1960s, reaching a peak growth of 360% in the 1970s, but this proved unsustainable and it shrank by 28% in the 1980s and a further 22% in the 1990s. This decline, coupled with high population growth, resulted in a steady fall in living standards. The gross national product per capita, now rising again, was about US$727 in 1996. It was substantially higher two decades before. Real GDP growth is expected to average 6.5% in 2024–25.

Agriculture in South Africa contributes around 5% of formal employment, relatively low compared to other parts of Africa and the number is still decreasing, as well as providing work for casual laborers and contributing around 2.6 percent of GDP for the nation. Due to the aridity of the land, only 13.5 percent can be used for crop production, and only 3 percent is considered high potential land.

Agriculture in Malaysia makes up twelve percent of the nation's GDP. Sixteen percent of the population of Malaysia is employed through some sort of agriculture. Large-scale plantations were established by the British. These plantations opened opportunity for new crops such as rubber (1876), palm oil (1917), and cocoa (1950). A number of crops are grown for domestic purpose such as bananas, coconuts, durian, pineapples, rice and rambutan.

Pineapple cake is a Taiwanese sweet traditional pastry and dessert containing butter, flour, egg, sugar, and pineapple jam or slices.
Nata de piña, also marketed as pineapple gel or pineapple gelatin, is a chewy, translucent, jelly-like food produced by the fermentation of pineapple juice. It is a traditional dessert in the Philippines, produced since the 18th century using waste pineapple juices from the piña fiber industry in Pagsanjan, Laguna. It has a sweet-sour taste and is popularly used in fruit salads, jams, ice creams, candies, and various other dishes.
Freedom pineapples was a political and social response in 2021 to a Chinese ban on the import of pineapples from Taiwan. It encouraged domestic and international consumption to replace the loss of the mainland Chinese market, which had formerly imported 97% of all Taiwanese pineapple exports. It did not fully shield Taiwan from the economic consequences. In 2021, Taiwanese pineapple exports dropped to 55% of their 2019 levels.
