This is a list of countries by coffee production, based on data from the Food and Agriculture Organization (FAO) for 2023. This data covers the production of green coffee beans, the primary ingredient in the production of processed coffee. Roasting and packaging of ground coffee often takes place after it has been exported from the producing nation; see the separate list of countries by coffee exports.
Contents
Coffee is a cash crop in many areas, with the amount produced for export significantly in excess of local demand. Several of these countries maintain substantial supply-chain relations with the world's largest coffeehouse chains and enterprises. [1] Often these coffeehouse chains pay a premium above market price in order to alleviate fair trade and sustainable farming concerns. Developing countries that participate in the coffee market wield considerable influence on global coffee economics. [2] [3]
 A world map of countries by coffee production, 2019
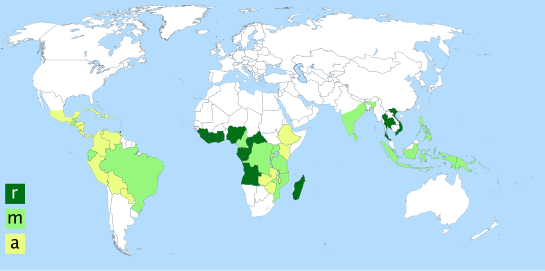 Coffee cultivation by type of coffee:a Coffea arabica

