Related Research Articles

Body mass index (BMI) is a value derived from the mass (weight) and height of a person. The BMI is defined as the body mass divided by the square of the body height, and is expressed in units of kg/m2, resulting from mass in kilograms (kg) and height in metres (m).

Human life expectancy is a statistical measure of the estimate of the average remaining years of life at a given age. The most commonly used measure is life expectancy at birth. This can be defined in two ways. Cohort LEB is the mean length of life of a birth cohort and can be computed only for cohorts born so long ago that all their members have died. Period LEB is the mean length of life of a hypothetical cohort assumed to be exposed, from birth through death, to the mortality rates observed at a given year. National LEB figures reported by national agencies and international organizations for human populations are estimates of period LEB.

The demographics of North Korea are determined through national censuses and international estimates. The Central Bureau of Statistics of North Korea conducted the most recent census in 2008, where the population reached 24 million inhabitants. The population density is 199.54 inhabitants per square kilometre, and the 2014 estimated life expectancy is 69.81 years. In 1980, the population rose at a near consistent, but low, rate. Since 2000, North Korea's birth rate has exceeded its death rate; the natural growth is positive. In terms of age structure, the population is dominated by the 15–64-year-old segment (68.09%). The median age of the population is 32.9 years, and the gender ratio is 0.95 males to 1.00 female. Since the early 1990s, the birth rate has been fairly stable, with an average of 2 children per woman, down from an average of 3 in the early 1980s.
Demography is the statistical study of human populations: their size, composition, and how they change through the interplay of fertility (births), mortality (deaths), and migration.

Epidemiology is the study and analysis of the distribution, patterns and determinants of health and disease conditions in a defined population.

Mortality rate, or death rate, is a measure of the number of deaths in a particular population, scaled to the size of that population, per unit of time. Mortality rate is typically expressed in units of deaths per 1,000 individuals per year; thus, a mortality rate of 9.5 in a population of 1,000 would mean 9.5 deaths per year in that entire population, or 0.95% out of the total. It is distinct from "morbidity", which is either the prevalence or incidence of a disease, and also from the incidence rate.

The total fertility rate (TFR) of a population is the average number of children that are born to a woman over her lifetime, if they were to experience the exact current age-specific fertility rates (ASFRs) through their lifetime, and they were to live from birth until the end of their reproductive life.

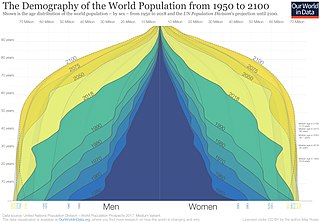
A population pyramid or "age-sex pyramid" is a graphical illustration of the distribution of a population by age groups and sex; it typically takes the shape of a pyramid when the population is growing. Males are usually shown on the left and females on the right, and they may be measured in absolute numbers or as a percentage of the total population. The pyramid can be used to visualize the age of a particular population. It is also used in ecology to determine the overall age distribution of a population; an indication of the reproductive capabilities and likelihood of the continuation of a species. Number of people per unit area of land is called population density.

In statistics, epidemiology, marketing and demography, a cohort is a group of subjects who share a defining characteristic.
In medical research, epidemiology, social science, and biology, a cross-sectional study is a type of observational study that analyzes data from a population, or a representative subset, at a specific point in time—that is, cross-sectional data.

In actuarial science and demography, a life table is a table which shows, for each age, the probability that a person of that age will die before their next birthday. In other words, it represents the survivorship of people from a certain population. They can also be explained as a long-term mathematical way to measure a population's longevity. Tables have been created by demographers including John Graunt, Reed and Merrell, Keyfitz, and Greville.
In epidemiology, case fatality rate (CFR) – or sometimes more accurately case-fatality risk – is the proportion of people who have been diagnosed with a certain disease and end up dying of it. Unlike a disease's mortality rate, the CFR does not take into account the time period between disease onset and death. A CFR is generally expressed as a percentage. It is a measure of disease lethality, and thus may change with different treatments. CFRs are most often used for with discrete, limited-time courses, such as acute infections.
Gross enrolment ratio (GER) or gross enrolment index (GEI) is a statistical measure used in the education sector, and formerly by the UN in its Education Index, to determine the number of students enrolled in school at several different grade levels, and use it to show the ratio of the number of students who live in that country to those who qualify for the particular grade level. The United Nations Educational, Scientific and Cultural Organization (UNESCO), describes "Gross Enrolment Ratio" as the total enrolment within a country "in a specific level of education, regardless of age, expressed as a percentage of the population in the official age group corresponding to this level of education".
Relative survival of a disease, in survival analysis, is calculated by dividing the overall survival after diagnosis by the survival as observed in a similar population not diagnosed with that disease. A similar population is composed of individuals with at least age and gender similar to those diagnosed with the disease.
Medical statistics deals with applications of statistics to medicine and the health sciences, including epidemiology, public health, forensic medicine, and clinical research. Medical statistics has been a recognized branch of statistics in the United Kingdom for more than 40 years, but the term has not come into general use in North America, where the wider term 'biostatistics' is more commonly used. However, "biostatistics" more commonly connotes all applications of statistics to biology. Medical statistics is a subdiscipline of statistics.
It is the science of summarizing, collecting, presenting and interpreting data in medical practice, and using them to estimate the magnitude of associations and test hypotheses. It has a central role in medical investigations. It not only provides a way of organizing information on a wider and more formal basis than relying on the exchange of anecdotes and personal experience, but also takes into account the intrinsic variation inherent in most biological processes.

Smoking, alcohol consumption and obesity in the Republic of Ireland occur at rates higher than the OECD average.
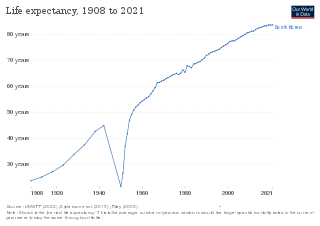
Life expectancy has been rising rapidly and South Korea ranked 3rd in the world for life expectancy. South Korea has among the lowest HIV/AIDS adult prevalence rate in the world, with just 0.1% of the population being infected, significantly lower than the U.S. at 0.6%, France's 0.4%, and the UK's 0.3% prevalence rate. South Korea has a good influenza vaccination rate, with a total of 43.5% of the population being vaccinated in 2019. A new measure of expected human capital calculated for 195 countries from 1920 to 2016 and defined for each birth cohort as the expected years lived from age 20 to 64 years and adjusted for educational attainment, learning or education quality, and functional health status was published by the Lancet in September 2018. South Korea had the sixth highest level of expected human capital with 26 health, education, and learning-adjusted expected years lived between age 20 and 64 years.
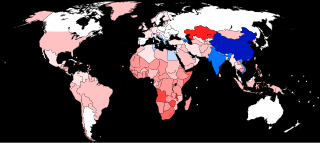
The human sex ratio is the ratio of males to females in a population in the context of anthropology and demography. In humans, the natural sex ratio at birth is slightly biased towards the male sex. It is estimated to be about 1.05 or 1.06 or within a narrow range from 1.03 to 1.06 males per female. The sex ratio for the entire world population is approximately 101 males to 100 females.

The major causes of deaths in Finland are cardiovascular diseases, malignant tumors, dementia and Alzheimer's disease, respiratory diseases, alcohol related diseases and accidental poisoning by alcohol. In 2010, the leading causes of death among men aged 15 to 64 were alcohol related deaths, ischaemic heart disease, accident, suicides, lung cancer and cerebrovascular diseases. Among women the leading causes were breast cancer, alcohol related deaths, accidents, suicides, ischaemic heart disease and lung cancer.

Stock assessments provide fisheries managers with the information that is used in the regulation of a fish stock. Biological and fisheries data are collected in a stock assessment.
References
- ↑ Everitt, Brian; Skrondal, Anders (2010). "Standardized mortality rate (SMR)". The Cambridge dictionary of statistics. New York: Cambridge University Press. p. 409. ISBN 9780521766999.
- ↑ Broeck, J.; Brestoff, J. R.; Kaulfuss, C. (2013). "Statistical Estimation". Epidemiology: Principles and Practical Guidelines. p. 417. doi:10.1007/978-94-007-5989-3_22. ISBN 978-94-007-5988-6.