The 2007 Tunbridge Wells Borough Council election took place on 3 May 2007 to elect members of Tunbridge Wells Borough Council in Kent, England. One third of the council was up for election and the Conservative party stayed in overall control of the council. [1]
Borough status in the United Kingdom is granted by royal charter to local government districts in England, Wales and Northern Ireland. The status is purely honorary, and does not give any additional powers to the council or inhabitants of the district. In Scotland, similarly chartered communities were known as royal burghs, although the status is no longer granted.
Kent is a county in South East England and one of the home counties. It borders Greater London to the north west, Surrey to the west and East Sussex to the south west. The county also shares borders with Essex along the estuary of the River Thames, and with the French department of Pas-de-Calais through the Channel Tunnel. The county town is Maidstone.
England is a country that is part of the United Kingdom. It shares land borders with Wales to the west and Scotland to the north-northwest. The Irish Sea lies west of England and the Celtic Sea lies to the southwest. England is separated from continental Europe by the North Sea to the east and the English Channel to the south. The country covers five-eighths of the island of Great Britain, which lies in the North Atlantic, and includes over 100 smaller islands, such as the Isles of Scilly and the Isle of Wight.
After the election, the composition of the council was
The results saw the Labour party lose its last councillor, Ronnie Ooi, on the council. [2] Ooi lost his seat in Southborough and High Brooms ward after campaigning by distancing himself from the national Labour government and calling on voters to preserve an opposition to the Conservatives on the council. [3]
The Labour Party is a centre-left political party in the United Kingdom which has been described as an alliance of social democrats, democratic socialists and trade unionists. The party's platform emphasises greater state intervention, social justice and strengthening workers' rights.
A Councillor is a member of a local government council.
Southborough is a town and civil parish in the District of Tunbridge Wells, in Kent, England. It lies immediately to the north of Tunbridge Wells itself and includes the district of High Brooms, with the A26 London road passing through it. According to the 2001 census it had a population of 11,124. The town is within the High Weald Area of Outstanding Natural Beauty.
Party | Seats | Gains | Losses | Net gain/loss | Seats % | Votes % | Votes | +/− | |
---|---|---|---|---|---|---|---|---|---|
Conservative | 15 | 4 | 1 | +3 | 93.8 | 57.2 | 13,455 | -1.7% | |
Liberal Democrat | 1 | 1 | 3 | -2 | 6.3 | 27.9 | 6,571 | -3.7% | |
UKIP | 0 | 0 | 0 | 0 | 0 | 6.3 | 1,482 | +4.6% | |
Labour | 0 | 0 | 1 | -1 | 0 | 5.9 | 1,391 | +0.3% | |
Green | 0 | 0 | 0 | 0 | 0 | 2.0 | 469 | -0.2% | |
Independent | 0 | 0 | 0 | 0 | 0 | 0.7 | 164 | +0.7% |
Party | Candidate | Votes | % | ± | |
---|---|---|---|---|---|
Conservative | Linda Hall | 1,170 | 58.5 | -2.2 | |
Liberal Democrat | Francis Rook | 696 | 34.8 | +3.9 | |
UKIP | Oliver Clement | 133 | 6.7 | -1.7 | |
Majority | 474 | 23.7 | -6.1 | ||
Turnout | 1,999 | 38.9 | +0.3 | ||
Conservative hold | Swing |
Party | Candidate | Votes | % | ± | |
---|---|---|---|---|---|
Conservative | John Miller | 921 | 58.1 | -0.5 | |
Green | Brian Leslie | 469 | 29.6 | +15.0 | |
UKIP | Patricia Theophanides | 196 | 12.4 | +12.4 | |
Majority | 452 | 28.5 | -3.2 | ||
Turnout | 1,586 | 32.6 | -2.3 | ||
Conservative hold | Swing |
Party | Candidate | Votes | % | ± | |
---|---|---|---|---|---|
Conservative | John Smith | 505 | 63.7 | -10.4 | |
Liberal Democrat | Graham Lee | 288 | 36.3 | +10.4 | |
Majority | 217 | 27.4 | -20.8 | ||
Turnout | 793 | 47.3 | +6.9 | ||
Conservative hold | Swing |
Party | Candidate | Votes | % | ± | |
---|---|---|---|---|---|
Conservative | John Bullock | 806 | 64.6 | -5.1 | |
Liberal Democrat | John Billingham | 297 | 23.8 | -6.5 | |
UKIP | Julie La Coste | 144 | 11.5 | +11.5 | |
Majority | 509 | 40.8 | +1.4 | ||
Turnout | 1,247 | 38.9 | -3.9 | ||
Conservative hold | Swing |
Party | Candidate | Votes | % | ± | |
---|---|---|---|---|---|
Conservative | Ron Weeden | 1,095 | 71.6 | +1.7 | |
Liberal Democrat | Keith Brown | 435 | 28.4 | -1.7 | |
Majority | 660 | 43.2 | +3.4 | ||
Turnout | 1,530 | 34.5 | -0.4 | ||
Conservative hold | Swing |
Party | Candidate | Votes | % | ± | |
---|---|---|---|---|---|
Conservative | Peter Waldock | 513 | 51.6 | -13.2 | |
Labour | Raymond Moon | 193 | 19.4 | +6.4 | |
Independent | Ronald Goodman | 164 | 16.5 | +16.5 | |
Liberal Democrat | Jamie Johnson | 125 | 12.6 | -9.6 | |
Majority | 349 | 32.2 | -10.4 | ||
Turnout | 995 | 32.7 | +1.8 | ||
Conservative hold | Swing |
Party | Candidate | Votes | % | ± | |
---|---|---|---|---|---|
Conservative | Stanley Ward | 646 | 79.0 | +18.4 | |
Labour | Raymond Steward | 172 | 21.0 | -0.1 | |
Majority | 474 | 58.0 | +18.5 | ||
Turnout | 818 | 28.2 | -1.9 | ||
Conservative hold | Swing |
Party | Candidate | Votes | % | ± | |
---|---|---|---|---|---|
Conservative | Gillian Barber-Hughes | 1,110 | 64.1 | -4.5 | |
Liberal Democrat | Jean-Luc Bressard | 470 | 27.1 | -4.3 | |
UKIP | Beryl Woodall | 152 | 8.8 | +8.8 | |
Majority | 640 | 37.0 | -0.2 | ||
Turnout | 1,732 | 36.0 | +1.0 | ||
Conservative hold | Swing |
Party | Candidate | Votes | % | ± | |
---|---|---|---|---|---|
Conservative | Sean Lockhart | 1,115 | 58.6 | -5.3 | |
Liberal Democrat | Peter Hillier | 616 | 32.4 | -3.7 | |
UKIP | Ian Peters | 171 | 9.0 | +9.0 | |
Majority | 499 | 26.2 | -1.6 | ||
Turnout | 1,902 | 35.8 | -2.4 | ||
Conservative hold | Swing |
Party | Candidate | Votes | % | ± | |
---|---|---|---|---|---|
Conservative | June Crowhurst | 955 | 54.3 | -1.9 | |
Liberal Democrat | Lorraine Braam | 687 | 39.0 | -4.8 | |
UKIP | Christopher Luke | 118 | 6.7 | +6.7 | |
Majority | 268 | 15.3 | +2.9 | ||
Turnout | 1,760 | 39.7 | -5.0 | ||
Conservative gain from Liberal Democrat | Swing | ||||
Party | Candidate | Votes | % | ± | |
---|---|---|---|---|---|
Conservative | Barry Edwards | 528 | 45.1 | +16.9 | |
Liberal Democrat | Christopher Gillmore | 321 | 27.4 | -24.2 | |
UKIP | June Moore | 175 | 15.0 | +4.2 | |
Labour | Lorna Blackmore | 146 | 12.5 | +3.1 | |
Majority | 207 | 17.7 | -5.7 | ||
Turnout | 1,170 | 34.1 | -4.4 | ||
Conservative gain from Liberal Democrat | Swing | ||||
Party | Candidate | Votes | % | ± | |
---|---|---|---|---|---|
Liberal Democrat | Lesley Herriot | 836 | 50.4 | +13.0 | |
Conservative | Brian Ransley | 708 | 42.7 | -2.0 | |
UKIP | Philip Crofton | 116 | 7.0 | +7.0 | |
Majority | 128 | 7.7 | |||
Turnout | 1,660 | 34.5 | -1.0 | ||
Liberal Democrat gain from Conservative | Swing | ||||
Party | Candidate | Votes | % | ± | |
---|---|---|---|---|---|
Conservative | Robert Mayall | 675 | 46.6 | -7.1 | |
Liberal Democrat | Alan Bullion | 405 | 28.0 | -0.4 | |
Labour | Katherine Wilson | 218 | 15.0 | -2.9 | |
UKIP | Victor Webb | 151 | 10.4 | +10.4 | |
Majority | 270 | 18.6 | -6.7 | ||
Turnout | 1,449 | 30.6 | -0.3 | ||
Conservative hold | Swing |
Party | Candidate | Votes | % | ± | |
---|---|---|---|---|---|
Conservative | John Chater | 658 | 37.4 | -12.0 | |
Labour | Ronnie Ooi | 582 | 33.1 | +0.4 | |
Liberal Democrat | Marguerita Morton | 394 | 22.4 | +4.5 | |
UKIP | Christopher Hoare | 126 | 7.2 | +7,2 | |
Majority | 76 | 4.3 | -12.4 | ||
Turnout | 1,760 | 34.3 | +0.6 | ||
Conservative gain from Labour | Swing | ||||
Party | Candidate | Votes | % | ± | |
---|---|---|---|---|---|
Conservative | David Elliott | 748 | 54.5 | -3.3 | |
Liberal Democrat | Trevor Poile | 544 | 39.7 | +5.3 | |
Labour | Antony Wood | 80 | 5.8 | -2.0 | |
Majority | 204 | 14.8 | -8.6 | ||
Turnout | 1,372 | 43.9 | -1.2 | ||
Conservative gain from Liberal Democrat | Swing | ||||
Party | Candidate | Votes | % | ± | |
---|---|---|---|---|---|
Conservative | David Jukes | 1,302 | 74.0 | -1.6 | |
Liberal Democrat | Ian Williams | 457 | 26.0 | +1.6 | |
Majority | 845 | 48.0 | -3.2 | ||
Turnout | 1,759 | 39.5 | -2.8 | ||
Conservative hold | Swing |
One third of Tunbridge Wells Borough Council in Kent, England is elected each year, followed by one year without election. Since the last boundary changes in 2002, 48 councillors have been elected from 20 wards.
The 1998 Tunbridge Wells Borough Council election took place on 7 May 1998 to elect members of Tunbridge Wells Borough Council in Kent, England. One third of the council was up for election and the Conservative party gained overall control of the council from no overall control.
The 1999 Tunbridge Wells Borough Council election took place on 6 May 1999 to elect members of Tunbridge Wells Borough Council in Kent, England. One third of the council was up for election and the Conservative party stayed in overall control of the council.
The 2000 Tunbridge Wells Borough Council election took place on 4 May 2000 to elect members of Tunbridge Wells Borough Council in Kent, England. One third of the council was up for election and the Conservative party stayed in overall control of the council.
The 2002 Tunbridge Wells Council election took place on 2 May 2002 to elect members of Tunbridge Wells Borough Council in Kent, England. The whole council was up for election with boundary changes since the last election in 2000. The Conservative party stayed in overall control of the council.
The 2003 Tunbridge Wells Borough Council election took place on 1 May 2003 to elect members of Tunbridge Wells Borough Council in Kent, England. One third of the council was up for election and the Conservative party stayed in overall control of the council.
The 2004 Tunbridge Wells Borough Council election took place on 10 June 2004 to elect members of Tunbridge Wells Borough Council in Kent, England. One third of the council was up for election and the Conservative party stayed in overall control of the council.
The 2006 Tunbridge Wells Borough Council election took place on 4 May 2006 to elect members of Tunbridge Wells Borough Council in Kent, England. One third of the council was up for election and the Conservative party stayed in overall control of the council.
Elections to Rossendale Borough Council were held on 1 May 2008. One third of the council was up for election and the Conservative party gained overall control of the council from no overall control. Overall turnout was up by one per cent from the last election in 2007 at 36.3%.
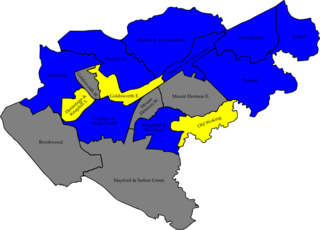
The 2007 Woking Council election took place on 3 May 2007 to elect members of Woking Borough Council in Surrey, England. One third of the council was up for election and the Conservative party gained overall control of the council from no overall control.
The 2007 Welwyn Hatfield Borough Council election took place on 3 May 2007 to elect members of Welwyn Hatfield Borough Council in Hertfordshire, England. One third of the council was up for election and the Conservative party stayed in overall control of the council.
The 2008 Welwyn Hatfield Borough Council election took place on 1 May 2008 to elect members of Welwyn Hatfield Borough Council in Hertfordshire, England. The whole council was up for election with boundary changes since the last election in 2007. The Conservative party stayed in overall control of the council.
The 2010 West Lancashire Borough Council election took place on 6 May 2010 to elect members of West Lancashire Borough Council in Lancashire, England. One third of the council was up for election and the Conservative party stayed in overall control of the council.
The 2007 Swindon Borough Council election took place on 4 May 2007 to elect members of Swindon Unitary Council in Wiltshire, England. One third of the council was up for election and the Conservative party stayed in overall control of the council.
The 2008 Tunbridge Wells Borough Council election took place on 1 May 2008 to elect members of Tunbridge Wells Borough Council in Kent, England. One third of the council was up for election and the Conservative party stayed in overall control of the council.
The 2010 Tunbridge Wells Borough Council election took place on 6 May 2010 to elect members of Tunbridge Wells Borough Council in Kent, England. One third of the council was up for election and the Conservative party stayed in overall control of the council.
The 2006 Solihull Metropolitan Borough Council election took place on 4 May 2006 to elect members of Solihull Metropolitan Borough Council in the West Midlands, England. One third of the council was up for election and the Conservative party stayed in overall control of the council.
The 2007 Solihull Metropolitan Borough Council election took place on 4 May 2007 to elect members of Solihull Metropolitan Borough Council in the West Midlands, England. One third of the council was up for election and the Conservative party lost overall control of the council to no overall control.
The 2006 Maidstone Borough Council election took place on 4 May 2006 to elect members of Maidstone Borough Council in Kent, England. One third of the council was up for election and the council stayed under no overall control.
The 2007 Walsall Metropolitan Borough Council election took place on 3 May 2007 to elect members of Walsall Metropolitan Borough Council in the West Midlands, England. One third of the council was up for election and the Conservative party stayed in overall control of the council.