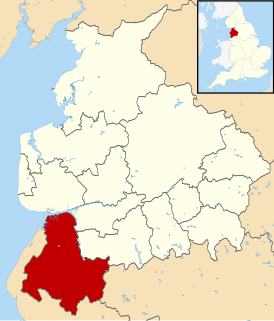
The 2008 West Lancashire District Council election took place on 1 May 2008 to elect members of West Lancashire District Council in Lancashire, England. One third of the council was up for election and the Conservative party stayed in overall control of the council. [1]
West Lancashire is a non-metropolitan district with the status of a borough in Lancashire, England. Its council is based in Ormskirk. The other town in the borough is Skelmersdale. The population of the District taken at the 2011 census was 110,685. The district was formed in 1974 under the Local Government Act 1972, as a merger of Ormskirk and Skelmersdale and Holland urban districts along with part of West Lancashire Rural District and part of the former Wigan Rural District.
Lancashire is a ceremonial county in North West England. The administrative centre is Preston. The county has a population of 1,449,300 and an area of 1,189 square miles (3,080 km2). People from Lancashire are known as Lancastrians.
England is a country that is part of the United Kingdom. It shares land borders with Wales to the west and Scotland to the north-northwest. The Irish Sea lies west of England and the Celtic Sea lies to the southwest. England is separated from continental Europe by the North Sea to the east and the English Channel to the south. The country covers five-eighths of the island of Great Britain, which lies in the North Atlantic, and includes over 100 smaller islands, such as the Isles of Scilly and the Isle of Wight.
After the election, the composition of the council was:
Party | Seats | ± | |
---|---|---|---|
Conservative | 35 | +2 | |
Labour | 18 | -2 | |
Independent | 1 | 0 |
Before the election, in which 19 seats were being contested, the Conservatives ran the council with 33 of the 52 seats. [3] The seat in Tanhouse was being contested after the death of Labour councillor Sally Keegan in December 2007, [2] while Conservative Martin Forshaw was unopposed in Hesketh with Becconsall. [4] The Conservatives were strongly favoured to remain in control and were particularly targeting the last Labour held seat in Burscough. [3]
A Councillor is a member of a local government council.
The Labour Party is a centre-left political party in the United Kingdom that has been described as an alliance of social democrats, democratic socialists and trade unionists. The party's platform emphasises greater state intervention, social justice and strengthening workers' rights.
Burscough is a small town and civil parish within West Lancashire in North West England, to the north of Ormskirk and Skelmersdale.The parish also includes the hamlet of Tarlscough and the Martin Mere Wetland Centre. The population taken at the 2011 Census was 9,182.
The Conservatives campaigned on plans to regenerate Skelmersdale, build new council offices on a site in Ormskirk and a pledge to keep council tax rises as low as possible. [3]
Skelmersdale is a town in West Lancashire, England, on the River Tawd, 6 miles (10 km) west of Wigan, 13 miles (21 km) northeast of Liverpool and 15 miles (24 km)southwest of Preston. In 2006, it had a population of 38,813. The town is known locally as Skem.
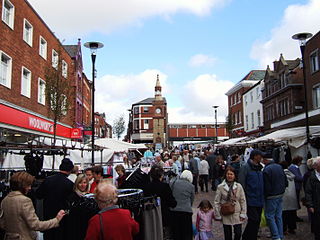
Ormskirk is a market town in West Lancashire, England, 13 miles (21 km) north of Liverpool, 11 miles (18 km) northwest of St Helens, 9 miles (14 km) southeast of Southport and 18 miles (29 km) southwest of Preston. Ormskirk is known for its gingerbread.
The results saw the Conservatives increase their control of the council after making 2 gains from Labour. [2] They gained the seats of Burscough West and Up Holland, with the margin of victory in Up Holland being only 3 votes after 2 recounts were required. [2] Labour also only held the Tanhouse seat by 34 votes after a recount. [2] The results meant the Conservatives had 35 seats compared to 18 for Labour and 1 independent. [2] Overall turnout in the election was 30.51%. [5]
Voter turnout is the percentage of eligible voters who cast a ballot in an election. Eligibility varies by country, and the voting-eligible population should not be confused with the total adult population. Age and citizenship status are often among the criteria used to determine eligibility, but some countries further restrict eligibility based on sex, race, or religion.
The Conservative council leader, Geoff Roberts, saw the results as a sign they could take the parliamentary seat in the next general election, while Labour blamed their defeats on national issues. [4]
West Lancashire is a constituency represented in the House of Commons of the UK Parliament since 2005 by Rosie Cooper, a member of the Labour Party.
Party | Seats | Gains | Losses | Net gain/loss | Seats % | Votes % | Votes | +/− | |
---|---|---|---|---|---|---|---|---|---|
Conservative | 12 | 2 | 0 | +2 | 63.2 | 54.2 | 11,101 | +1.4% | |
Labour | 7 | 0 | 2 | -2 | 36.8 | 36.8 | 7,543 | -1.1% | |
UKIP | 0 | 0 | 0 | 0 | 0 | 4.2 | 857 | +3.3% | |
Green | 0 | 0 | 0 | 0 | 0 | 3.1 | 638 | -0.5% | |
Independent | 0 | 0 | 0 | 0 | 0 | 1.6 | 336 | +0.3% |
Party | Candidate | Votes | % | ± | |
---|---|---|---|---|---|
Labour | Geoff Roberts | 533 | 51.2 | -17.0 | |
Conservative | James Coomber | 302 | 29.0 | -2.8 | |
UKIP | Roy Green | 207 | 19.9 | +19.9 | |
Majority | 231 | 22.2 | -14.3 | ||
Turnout | 1,042 | 21.5 | +0.4 | ||
Labour hold | Swing |
Party | Candidate | Votes | % | ± | |
---|---|---|---|---|---|
Conservative | Una Atherley | 1,073 | 65.0 | -7.1 | |
Labour | Julie Gibson | 302 | 18.3 | -9.6 | |
UKIP | Jim Bevan | 276 | 16.7 | +16.7 | |
Majority | 771 | 46.7 | +2.6 | ||
Turnout | 1,651 | 36.7 | +0.8 | ||
Conservative hold | Swing |
Party | Candidate | Votes | % | ± | |
---|---|---|---|---|---|
Labour | Mary Pendleton | 394 | 75.9 | -5.5 | |
Conservative | Malcolm Barron | 125 | 24.1 | +5.5 | |
Majority | 269 | 51.8 | -11.0 | ||
Turnout | 519 | 17.1 | +0.2 | ||
Labour hold | Swing |
Party | Candidate | Votes | % | ± | |
---|---|---|---|---|---|
Conservative | George Pratt | 737 | 65.6 | -0.6 | |
Labour | Kate Anderson | 386 | 34.4 | +0.6 | |
Majority | 351 | 31.3 | -1.1 | ||
Turnout | 1,123 | 34.6 | -3.4 | ||
Conservative hold | Swing |
Party | Candidate | Votes | % | ± | |
---|---|---|---|---|---|
Conservative | Jason Grice | 853 | 58.6 | +2.7 | |
Labour | Cynthia Dereli | 602 | 41.4 | -2.7 | |
Majority | 251 | 17.3 | +2.5 | ||
Turnout | 1,455 | 37.0 | +0.0 | ||
Conservative gain from Labour | Swing | ||||
Party | Candidate | Votes | % | ± | |
---|---|---|---|---|---|
Conservative | Adrian Owens | 904 | 61.8 | +4.6 | |
Labour | Alexander Gilmore | 336 | 23.0 | -3.5 | |
Green | Anne Doyle | 223 | 15.2 | -1.1 | |
Majority | 568 | 38.8 | +8.1 | ||
Turnout | 1,463 | 29.1 | -2.0 | ||
Conservative hold | Swing |
Party | Candidate | Votes | % | ± | |
---|---|---|---|---|---|
Labour | Terence Aldridge | 515 | 76.5 | -3.3 | |
Conservative | Graham Jones | 158 | 23.5 | +3.3 | |
Majority | 357 | 53.0 | -6.7 | ||
Turnout | 673 | 21.6 | +0.5 | ||
Labour hold | Swing |
Party | Candidate | Votes | % | ± | |
---|---|---|---|---|---|
Conservative | Doreen Stephenson | 395 | 64.4 | +9.0 | |
Independent | David Corfield | 152 | 24.8 | -19.8 | |
Labour | Susan Jones | 66 | 10.8 | +10.8 | |
Majority | 243 | 39.6 | +28.8 | ||
Turnout | 613 | 34.6 | -12.4 | ||
Conservative hold | Swing |
Party | Candidate | Votes | % | ± | |
---|---|---|---|---|---|
Conservative | Martin Forshaw | unopposed | |||
Conservative hold | Swing |
Party | Candidate | Votes | % | ± | |
---|---|---|---|---|---|
Conservative | Peter Lea | 1,003 | 63.8 | +8.0 | |
Labour | Ann Rice | 357 | 22.7 | -9.2 | |
Green | John Watt | 211 | 13.4 | +1.0 | |
Majority | 646 | 41.1 | +17.2 | ||
Turnout | 1,571 | 35.4 | +0.3 | ||
Conservative hold | Swing |
Party | Candidate | Votes | % | ± | |
---|---|---|---|---|---|
Labour | Christopher Mawdsley | 478 | 74.5 | -5.2 | |
Conservative | Richard Shepherd | 164 | 25.5 | +5.2 | |
Majority | 314 | 48.9 | -10.5 | ||
Turnout | 642 | 22.7 | +0.9 | ||
Labour hold | Swing |
Party | Candidate | Votes | % | ± | |
---|---|---|---|---|---|
Conservative | Joan Colling | 524 | 84.8 | +7.1 | |
Labour | Jacqueline Citarella | 94 | 15.2 | -7.1 | |
Majority | 430 | 69.6 | +14.2 | ||
Turnout | 618 | 37.6 | -9.7 | ||
Conservative hold | Swing |
Party | Candidate | Votes | % | ± | |
---|---|---|---|---|---|
Conservative | Cyril Ainscough | 861 | 55.7 | +8.4 | |
Labour | Noel Delaney | 482 | 31.2 | -3.1 | |
Green | Maurice George | 204 | 13.2 | +2.0 | |
Majority | 379 | 24.5 | +11.5 | ||
Turnout | 1,547 | 34.8 | -1.8 | ||
Conservative hold | Swing |
Party | Candidate | Votes | % | ± | |
---|---|---|---|---|---|
Labour | Neil Furey | '563 | 62.9 | -14.4 | |
Independent | Joan Morrison | 184 | 20.6 | +20.6 | |
Conservative | Dave Rydings | 148 | 16.5 | -6.2 | |
Majority | 379 | 42.3 | -12.2 | ||
Turnout | 895 | 29.0 | +1.3 | ||
Labour hold | Swing |
Party | Candidate | Votes | % | ± | |
---|---|---|---|---|---|
Labour | Sydney Jones | 778 | 66.7 | -6.5 | |
Conservative | Joanne Rushton | 389 | 33.3 | +6.5 | |
Majority | 389 | 33.3 | -13.0 | ||
Turnout | 1,167 | 23.3 | -0.7 | ||
Labour hold | Swing |
Party | Candidate | Votes | % | ± | |
---|---|---|---|---|---|
Labour | Nikki Hennessy | 402 | 52.2 | -8.3 | |
Conservative | Cindy Miller | 368 | 47.8 | +21.4 | |
Majority | 34 | 4.4 | -29.7 | ||
Turnout | 770 | 22.7 | +3.1 | ||
Labour hold | Swing |
Party | Candidate | Votes | % | ± | |
---|---|---|---|---|---|
Conservative | John Mee | 1,526 | 87.7 | +18.2 | |
Labour | Stephen Hanlon | 215 | 12.3 | +3.0 | |
Majority | 1,311 | 75.3 | +27.1 | ||
Turnout | 1,741 | 38.9 | +2.2 | ||
Conservative hold | Swing |
Party | Candidate | Votes | % | ± | |
---|---|---|---|---|---|
Conservative | Ruth Pollock | 728 | 43.1 | -0.4 | |
Labour | Maggie Skilling | 725 | 42.9 | -2.2 | |
UKIP | Marie Settle | 238 | 14.1 | +2.8 | |
Majority | 3 | 0.2 | |||
Turnout | 1,691 | 34.4 | -0.3 | ||
Conservative gain from Labour | Swing | ||||
Party | Candidate | Votes | % | ± | |
---|---|---|---|---|---|
Conservative | Peter Gartside | 843 | 65.1 | +2.2 | |
Labour | Pauline Bailey | 315 | 24.3 | -12.8 | |
UKIP | Iain Routh | 136 | 10.5 | +10.5 | |
Majority | 528 | 40.8 | +14.9 | ||
Turnout | 1,294 | 38.8 | -1.4 | ||
Conservative hold | Swing |
The 2002 West Lancashire District Council election took place on 2 May 2002 to elect members of West Lancashire District Council in Lancashire, England. The whole council was up for election with boundary changes since the last election in 2000 reducing the number of seats by 1. The Conservative party gained overall control of the council from Labour.
The 2003 West Lancashire District Council election took place on 1 May 2003 to elect members of West Lancashire District Council in Lancashire, England. One third of the council was up for election and the Conservative party stayed in overall control of the council.
The 2004 West Lancashire District Council election took place on 10 June 2004 to elect members of West Lancashire District Council in Lancashire, England. One third of the council was up for election and the Conservative party stayed in overall control of the council.
The 2006 West Lancashire District Council election took place on 4 May 2006 to elect members of West Lancashire District Council in Lancashire, England. One third of the council was up for election and the Conservative party stayed in overall control of the council.
The 2008 St Helens Metropolitan Borough Council election took place on 1 May 2008 to elect members of St Helens Metropolitan Borough Council in Merseyside, England. One third of the council was up for election and the council stayed under no overall control.
The 2003 Worthing Borough Council election took place on 1 May 2003 to elect members of Worthing Borough Council in West Sussex, England. One third of the council was up for election and the Liberal Democrats lost overall control of the council to no overall control. Overall turnout was 28.61%.
The 2007 Cherwell District Council election took place on 3 May 2007 to elect members of Cherwell District Council in Oxfordshire, England. One third of the council was up for election and the Conservative party stayed in overall control of the council.
The 2003 Worcester City Council election took place on 1 May 2003 to elect members of Worcester District Council in Worcestershire, England. One third of the council was up for election and the Conservative party gained overall control of the council from no overall control.
The 2002 Welwyn Hatfield District Council election took place on 2 May 2002 to elect members of Welwyn Hatfield District Council in Hertfordshire, England. One third of the council was up for election and the Conservative party gained overall control of the council from the Labour party.
The 2003 Welwyn Hatfield District Council election took place on 1 May 2003 to elect members of Welwyn Hatfield District Council in Hertfordshire, England. One third of the council was up for election and the Conservative party stayed in overall control of the council.
The 2006 Welwyn Hatfield District Council election took place on 4 May 2006 to elect members of Welwyn Hatfield District Council in Hertfordshire, England. One third of the council was up for election and the Conservative party stayed in overall control of the council.
The 2007 West Lancashire District Council election took place on 3 May 2007 to elect members of West Lancashire District Council in Lancashire, England. One third of the council was up for election and the Conservative party stayed in overall control of the council.
The 2010 West Lancashire Borough Council election took place on 6 May 2010 to elect members of West Lancashire Borough Council in Lancashire, England. One third of the council was up for election and the Conservative party stayed in overall control of the council.
The 2007 Swindon Borough Council election took place on 4 May 2007 to elect members of Swindon Unitary Council in Wiltshire, England. One third of the council was up for election and the Conservative party stayed in overall control of the council.
The 1999 Solihull Metropolitan Borough Council election took place on 6 May 1999 to elect members of Solihull Metropolitan Borough Council in the West Midlands, England. One third of the council was up for election and the council stayed under no overall control.
The 2008 Stroud Council election took place on 1 May 2008 to elect members of Stroud District Council in Gloucestershire, England. One third of the council was up for election and the Conservative party stayed in overall control of the council.
The 2008 Harrogate Council election took place on 1 May 2008 to elect members of Harrogate Borough Council in North Yorkshire, England. One third of the council was up for election and the council stayed under no overall control.
The 2007 Pendle Borough Council election took place on 3 May 2007 to elect members of Pendle Borough Council in Lancashire, England. One third of the council was up for election and the Liberal Democrats stayed in overall control of the council.
The 2008 Basildon District Council election took place on 1 May 2008 to elect members of Basildon District Council in Essex, England. One third of the council was up for election and the Conservative party stayed in overall control of the council.