Arbia's law of geography

Last updated
An example of the modifiable areal unit problem and the distortion of rate calculations Maup rate numbers.png
An example of the modifiable areal unit problem and the distortion of rate calculations

Arbia's law of geography states, "Everything is related to everything else, but things observed at a coarse spatial resolution are more related than things observed at a finer resolution." [1] [2] [3] [4] [5] Originally proposed as the 2nd law of geography, this is one of several laws competing for that title. [1] [2] [3] Because of this, Arbia's law is sometimes referred to as the second law of geography, or Arbia's second law of geography. [1] [2] [6] [7]

Contents

Background

Since Tobler first invoked the first law of geography in his 1970s paper, there have been many attempts at a second law, including Tobler's second law of geography, and Arbia's law is one such contender. [2] [5] [8] Arbia's law builds on Tobler's first law of geography which states, "Everything is related to everything else, but near things tend to be more related than distant." While Tobler's first law relates to spatial autocorrelation and distance decay, Arbia's law relates to the modifiable areal unit problem, or MAUP and scale dependence of correlation. [9] [10] Arbia's law was first invoked in a paper published by Giuseppe Arbia, R. Benedetti, and G. Espa titled "Effects of the MAUP on image classification," where it was presented as the second law of geography. [1] It was later referenced by Waldo Tobler in his paper "On the first law of geography: A Reply" as a possible contender for the second law of geography (this is the same paper where Tobler first proposed his second law of geography). [2] The laws of geography need not be numbered, however. [8]

Foundation

In spatial analysis with geographic information systems, both raster and vector data are used. Importantly, when working with spatially aggregate data (either in vector or raster) at a coarse resolution, it is impossible to make assumptions about what that data looks like at a finer resolution. Doing so would commit the ecological fallacy. Aggregating data spatially has a statistical smoothing effect due to the scale effect. [11]

Raster

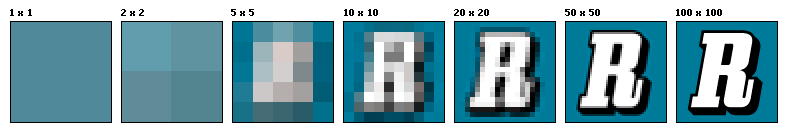
Arbia's law was first invoked when working with raster datasets. [1] Arbia's law is important to remember when working with raster data, particularly remote sensing, where the electromagnetic spectrum is sampled at a pixel level. [12] Spatial resolution in remote sensing is related to the smallest pixel size within an image, and one value is returned for the area within a pixel. The coarser the image resolution (the larger the pixel) in a remotely sensed image, the larger the area that will be represented with the same value. Thus, a coarse resolution has a soothing effect on the image, making land cover appear more homogenous than an image with a fine spatial resolution. [1] [2] [13]

Resolution illustration.png

Vector

When working with vector datasets, the same effect is present as in Raster. With Vector datasets in GIS, it is often necessary to aggregate data into discreet spatial enumeration units (often referred to as aerial units), such as county boundaries or national borders. [14] [15] The Modifiable Areal Unit Problem, or MAUP, arises from the countless possible ways to divide up the same area of land. [14] [15] Dividing the land differently may produce different statistical results from the same underlying dataset, an example of which can be found in Simpson's paradox. How land is aggregated can affect the results or analysis, an effect that has been exploited by politicians through the process of gerrymandering. Arbia's law applies not just to how data are aggregated spatially but to the size of the aerial units. The larger these aerial units, the more homogenous the underlying data will appear. [16] The same area may not appear very homogenous when the aerial units are smaller. [16]

Controversy

In general, some dispute the entire concept of scientific laws in geography and the social sciences. [2] [8] These criticisms have been addressed by Tobler and others. [2] [8] However, this is an ongoing source of debate in geography and is unlikely to be resolved anytime soon.

Other Proposed Second Laws of Geography

Some have argued that geographic laws do not need to be numbered. However, the existence of a first invites the creation of a second. [5] In addition to Arbia, several scholars have proposed candidates for a second.

See also

Related Research Articles

<span class="mw-page-title-main">Geographic information system</span> System to capture, manage and present geographic data

A geographic information system (GIS) consists of integrated computer hardware and software that store, manage, analyze, edit, output, and visualize geographic data. Much of this often happens within a spatial database, however, this is not essential to meet the definition of a GIS. In a broader sense, one may consider such a system also to include human users and support staff, procedures and workflows, the body of knowledge of relevant concepts and methods, and institutional organizations.

<span class="mw-page-title-main">Raster graphics</span> Matrix-based data structure

In computer graphics and digital photography, a raster graphic represents a two-dimensional picture as a rectangular matrix or grid of pixels, viewable via a computer display, paper, or other display medium. A raster is technically characterized by the width and height of the image in pixels and by the number of bits per pixel. Raster images are stored in image files with varying dissemination, production, generation, and acquisition formats.

<span class="mw-page-title-main">Vector graphics</span> Computer graphics images defined by points, lines and curves

Vector graphics are a form of computer graphics in which visual images are created directly from geometric shapes defined on a Cartesian plane, such as points, lines, curves and polygons. The associated mechanisms may include vector display and printing hardware, vector data models and file formats, as well as the software based on these data models. Vector graphics is an alternative to raster or bitmap graphics, with each having advantages and disadvantages in specific situations.

A GIS file format is a standard for encoding geographical information into a computer file, as a specialized type of file format for use in geographic information systems (GIS) and other geospatial applications. Since the 1970s, dozens of formats have been created based on various data models for various purposes. They have been created by government mapping agencies, GIS software vendors, standards bodies such as the Open Geospatial Consortium, informal user communities, and even individual developers.

<span class="mw-page-title-main">Tobler's first law of geography</span> The first of several proposed laws of geography

The First Law of Geography, according to Waldo Tobler, is "everything is related to everything else, but near things are more related than distant things." This first law is the foundation of the fundamental concepts of spatial dependence and spatial autocorrelation and is utilized specifically for the inverse distance weighting method for spatial interpolation and to support the regionalized variable theory for kriging. The first law of geography is the fundamental assumption used in all spatial analysis.

<span class="mw-page-title-main">Spatial analysis</span> Formal techniques which study entities using their topological, geometric, or geographic properties

Spatial analysis is any of the formal techniques which studies entities using their topological, geometric, or geographic properties. Spatial analysis includes a variety of techniques using different analytic approaches, especially spatial statistics. It may be applied in fields as diverse as astronomy, with its studies of the placement of galaxies in the cosmos, or to chip fabrication engineering, with its use of "place and route" algorithms to build complex wiring structures. In a more restricted sense, spatial analysis is geospatial analysis, the technique applied to structures at the human scale, most notably in the analysis of geographic data. It may also be applied to genomics, as in transcriptomics data.

<span class="mw-page-title-main">Modifiable areal unit problem</span> Source of statistical bias

The modifiable areal unit problem (MAUP) is a source of statistical bias that can significantly impact the results of statistical hypothesis tests. MAUP affects results when point-based measures of spatial phenomena are aggregated into spatial partitions or areal units as in, for example, population density or illness rates. The resulting summary values are influenced by both the shape and scale of the aggregation unit.

Georeferencing or georegistration is a type of coordinate transformation that binds a digital raster image or vector database that represents a geographic space to a spatial reference system, thus locating the digital data in the real world. It is thus the geographic form of image registration. The term can refer to the mathematical formulas used to perform the transformation, the metadata stored alongside or within the image file to specify the transformation, or the process of manually or automatically aligning the image to the real world to create such metadata. The most common result is that the image can be visually and analytically integrated with other geographic data in geographic information systems and remote sensing software.

<span class="mw-page-title-main">Field (geography)</span> Property that varies over space

In the context of spatial analysis, geographic information systems, and geographic information science, a field is a property that fills space, and varies over space, such as temperature or density. This use of the term has been adopted from physics and mathematics, due to their similarity to physical fields (vector or scalar) such as the electromagnetic field or gravitational field. Synonymous terms include spatially dependent variable (geostatistics), statistical surface ( thematic mapping), and intensive property (physics and chemistry) and crossbreeding between these disciplines is common. The simplest formal model for a field is the function, which yields a single value given a point in space (i.e., t = f(x, y, z) )

A geographic data model, geospatial data model, or simply data model in the context of geographic information systems, is a mathematical and digital structure for representing phenomena over the Earth. Generally, such data models represent various aspects of these phenomena by means of geographic data, including spatial locations, attributes, change over time, and identity. For example, the vector data model represents geography as collections of points, lines, and polygons, and the raster data model represent geography as cell matrices that store numeric values. Data models are implemented throughout the GIS ecosystem, including the software tools for data management and spatial analysis, data stored in a variety of GIS file formats, specifications and standards, and specific designs for GIS installations.

Geographic information systems (GISs) and geographic information science (GIScience) combine computer-mapping capabilities with additional database management and data analysis tools. Commercial GIS systems are very powerful and have touched many applications and industries, including environmental science, urban planning, agricultural applications, and others.

A boundary problem in analysis is a phenomenon in which geographical patterns are differentiated by the shape and arrangement of boundaries that are drawn for administrative or measurement purposes. The boundary problem occurs because of the loss of neighbors in analyses that depend on the values of the neighbors. While geographic phenomena are measured and analyzed within a specific unit, identical spatial data can appear either dispersed or clustered depending on the boundary placed around the data. In analysis with point data, dispersion is evaluated as dependent of the boundary. In analysis with areal data, statistics should be interpreted based upon the boundary.

Spatial econometrics is the field where spatial analysis and econometrics intersect. The term “spatial econometrics” was introduced for the first time by the Belgian economist Jean Paelinck in the general address he delivered to the annual meeting of the Dutch Statistical Association in May 1974 . In general, econometrics differs from other branches of statistics in focusing on theoretical models, whose parameters are estimated using regression analysis. Spatial econometrics is a refinement of this, where either the theoretical model involves interactions between different entities, or the data observations are not truly independent. Thus, models incorporating spatial auto-correlation or neighborhood effects can be estimated using spatial econometric methods. Such models are common in regional science, real estate economics, education economics, housing market and many others. Adopting a more general view, in the by-law of the Spatial Econometrics Association, the discipline is defined as the set of “models and theoretical instruments of spatial statistics and spatial data analysis to analyse various economic effects such as externalities, interactions, spatial concentration and many others”. Recent developments tend to include also methods and models from social network econometrics.

Quantitative geography is a subfield and methodological approach to geography that develops, tests, and uses scientific, mathematical, and statistical methods to analyze and model geographic phenomena and patterns. It aims to explain and predict the distribution and dynamics of human and physical geography through the collection and analysis of quantifiable data. The approach quantitative geographers take is generally in line with the scientific method, where a falsifiable hypothesis is generated, and then tested through observational studies. This has received criticism, and in recent years, quantitative geography has moved to include systematic model creation and understanding the limits of their models. This approach is used to study a wide range of topics, including population demographics, urbanization, environmental patterns, and the spatial distribution of economic activity. The methods of quantitative geography are often contrasted by those employed by qualitative geography, which is more focused on observing and recording characteristics of geographic place. However, there is increasing interest in using combinations of both qualitative and quantitative methods through mixed-methods research to better understand and contextualize geographic phenomena.

In geography, scale is the level at which a geographical phenomenon occurs or is described. This concept is derived from the map scale in cartography. Geographers describe geographical phenomena and differences using different scales. From an epistemological perspective, scale is used to describe how detailed an observation is, while ontologically, scale is inherent in the complex interaction between society and nature.

Giuseppe Arbia is an Italian statistician. He is known for his contributions to the field of spatial statistics and spatial econometrics. In 2006 together with Jean Paelinck he founded the Spatial Econometrics Association, which he has been chairing ever since.

<span class="mw-page-title-main">Tobler's second law of geography</span> One of several proposed laws of geography

The second law of geography, according to Waldo Tobler, is "the phenomenon external to a geographic area of interest affects what goes on inside." This is an extension of his first. He first published it in 1999 in reply to a paper titled "Linear pycnophylactic reallocation comment on a paper by D. Martin" and then again in response to criticism of his first law of geography titled "On the First Law of Geography: A Reply." Much of this criticism was centered on the question of if laws were meaningful in geography or any of the social sciences. In this document, Tobler proposed his second law while recognizing others have proposed other concepts to fill the role of 2nd law. Tobler asserted that this phenomenon is common enough to warrant the title of 2nd law of geography. Unlike Tobler's first law of geography, which is relatively well accepted among geographers, there are a few contenders for the title of the second law of geography. Tobler's second law of geography is less well known but still has profound implications for geography and spatial analysis.

<span class="mw-page-title-main">Uncertain geographic context problem</span> Source of statistical bias

The uncertain geographic context problem or UGCoP is a source of statistical bias that can significantly impact the results of spatial analysis when dealing with aggregate data. The UGCoP is very closely related to the Modifiable areal unit problem (MAUP), and like the MAUP, arises from how we divide the land into areal units. It is caused by the difficulty, or impossibility, of understanding how phenomena under investigation in different enumeration units interact between enumeration units, and outside of a study area over time. It is particularly important to consider the UGCoP within the discipline of time geography, where phenomena under investigation can move between spatial enumeration units during the study period. Examples of research that needs to consider the UGCoP include food access and human mobility.

<span class="mw-page-title-main">Modifiable temporal unit problem</span> Source of statistical bias

The Modified Temporal Unit Problem (MTUP) is a source of statistical bias that occurs in time series and spatial analysis when using temporal data that has been aggregated into temporal units. In such cases, choosing a temporal unit can affect the analysis results and lead to inconsistencies or errors in statistical hypothesis testing.

The neighborhood effect averaging problem or NEAP delves into the challenges associated with understanding the influence of aggregating neighborhood-level phenomena on individuals when mobility-dependent exposures influence the phenomena. The problem confounds the neighbourhood effect, which suggests that a person's neighborhood impacts their individual characteristics, such as health. It relates to the boundary problem, in that delineated neighborhoods used for analysis may not fully account for an individuals activity space if the borders are permeable, and individual mobility crosses the boundaries. The term was first coined by Mei-Po Kwan in the peer-reviewed journal "International Journal of Environmental Research and Public Health" in 2018.

References

  1. 1 2 3 4 5 6 Arbia, Giuseppe; Benedetti, R.; Espa, G. (1996). ""Effects of MAUP on image classification"". Journal of Geographical Systems. 3: 123–141.
  2. 1 2 3 4 5 6 7 8 9 Tobler, Waldo (2004). "On the First Law of Geography: A Reply". Annals of the Association of American Geographers. 94 (2): 304–310. doi:10.1111/j.1467-8306.2004.09402009.x. S2CID   33201684 . Retrieved 10 March 2022.
  3. 1 2 Smith, Peter (2005). "The laws of geography". Teaching Geography. 30 (3): 150.
  4. Otto, Philipp; Doğan, Osman; Taşpınar, Süleyman (8 November 2023). "A Dynamic Spatiotemporal Stochastic Volatility Model with an Application to Environmental Risks". Econometrics and Statistics. arXiv: 2211.03178 . doi: 10.1016/j.ecosta.2023.11.002 .
  5. 1 2 3 Hecht, Brent; Moxley, Emily (2009). "Terabytes of Tobler: Evaluating the First Law in a Massive, Domain-Neutral Representation of World Knowledge". Spatial Information Theory 9th International Conference, COSIT 2009, Aber Wrac'h, France, September 21–25, 2009, Proceedings. Lecture Notes in Computer Science. 5756. Springer: 88. Bibcode:2009LNCS.5756...88H. doi:10.1007/978-3-642-03832-7_6. ISBN   978-3-642-03831-0.
  6. Amdaoud, Mounir; Arcur, Giuseppe; Levratto, Nadine; Succurro, Marianna; Costanzo, Damiana (2020). "Geography of COVID-19 outbreak and first policy answers in European regions and cities".{{cite journal}}: Cite journal requires |journal= (help)
  7. Zhang, Boen; Xu, Gang; Jiao, Limin; Liu, Jiafeng (January 2019). "The scale effects of the spatial autocorrelation measurement: aggregation level and spatial resolution January 2019 International J". International Journal of Geographical Information Science. 33 (5): 1–22. doi:10.1080/13658816.2018.1564316. S2CID   68155432 . Retrieved 6 January 2023.
  8. 1 2 3 4 5 6 Goodchild, Michael (2004). "The Validity and Usefulness of Laws in Geographic Information Science and Geography". Annals of the Association of American Geographers. 94 (2): 300–303. doi:10.1111/j.1467-8306.2004.09402008.x. S2CID   17912938.
  9. Wu, Jianguo (2004). "Effects of changing scale on landscape pattern analysis: scaling relations" (PDF). Landscape Ecology. 19 (2): 125–138. doi:10.1023/B:LAND.0000021711.40074.ae. S2CID   16977988.
  10. Taylor, Peter (1983). Distance Decay in Spatial Interactions (PDF). ISBN   0-86094-090-X.
  11. Doignon, Yoann; Oliveau, Sébastien (2015). "Territorial grids in the Mediterranean: space versus population". Bollettino dell'Associazione Italiana di Cartografia. 154: 46–63. doi:10.13137/2282-472X/11827.
  12. Jensen, John (2016). Introductory digital image processing: a remote sensing perspective. Glenview, IL: Pearson Education, Inc. p. 623. ISBN   978-0-13-405816-0.
  13. Tobler, Waldo (1969). "Geographical filters and their inverses". Geographical Analysis. 1 (3): 234–53. doi: 10.1111/j.1538-4632.1969.tb00621.x .
  14. 1 2 Openshaw, Stan (1983). The Modifiable Areal Unit Problem (PDF). ISBN   0-86094-134-5.
  15. 1 2 Chen, Xiang; Ye, Xinyue; Widener, Michael J.; Delmelle, Eric; Kwan, Mei-Po; Shannon, Jerry; Racine, Racine F.; Adams, Aaron; Liang, Lu; Peng, Jia (27 December 2022). "A systematic review of the modifiable areal unit problem (MAUP) in community food environmental research". Urban Informatics. 1. doi: 10.1007/s44212-022-00021-1 . S2CID   255206315 . Retrieved 27 December 2022.
  16. 1 2 Cartone, Alfredo; Postiglione, Paolo (26 June 2020). "Principal component analysis for geographical data: the role of spatial effects in the definition of composite indicators". Spatial Economic Analysis. 16 (2): 126–147. doi:10.1080/17421772.2020.1775876.