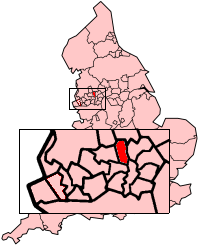
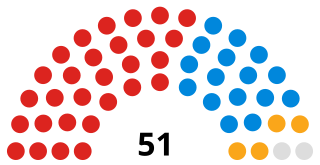
Elections to Bury Metropolitan Borough Council were held on 4 May 2006. One third of the council was up for election, and the Labour Party lost control of the council.
Bury Metropolitan Borough Council is the local authority of the Metropolitan Borough of Bury in Greater Manchester, England. It is a metropolitan district council, one of ten in Greater Manchester and one of 36 in the metropolitan counties of England. It provides the majority of local government services in Bury.
The Labour Party is a centre-left political party in the United Kingdom which has been described as an alliance of social democrats, democratic socialists and trade unionists. The party's platform emphasises greater state intervention, social justice and strengthening workers' rights.
After the election, the composition of the council was
Party | Seats | Gains | Losses | Net gain/loss | Seats % | Votes % | Votes | +/− | |
---|---|---|---|---|---|---|---|---|---|
Labour | 5 | 1 | 5 | -4 | 33.8 | 17,337 | -1.2 | ||
Conservative | 9 | 4 | 1 | +3 | 42.2 | 21,619 | +5.2 | ||
Liberal Democrat | 3 | 1 | 0 | +1 | 21.6 | 11,072 | -0.1 | ||
Independent | 0 | 0 | 0 | 0 | 0 | 2.5 | 1,259 | -0.6 | |
Party | Candidate | Votes | % | ± | |
---|---|---|---|---|---|
Labour | Ken Audin | 1,085 | 47.5 | -5.8 | |
Conservative | Jonathan Grosskopf | 597 | 26.1 | +0.4 | |
Liberal Democrat | Mary D'Albert | 396 | 17.3 | -3.8 | |
Independent | Lucy Cohn | 208 | 9.1 | +9.1 | |
Majority | 488 | 21.3 | |||
Turnout | 2,286 | ||||
Labour hold | Swing | ||||
Party | Candidate | Votes | % | ± | |
---|---|---|---|---|---|
Conservative | Robert Bibby | 2,048 | 57.8 | +10.9 | |
Labour | Benjamin Shatliff | 847 | 23.9 | -0.2 | |
Liberal Democrat | Paul Jenkins | 649 | 18.3 | +3.8 | |
Majority | 1,201 | 38.9 | |||
Turnout | 3,544 | ||||
Conservative hold | Swing | ||||
Party | Candidate | Votes | % | ± | |
---|---|---|---|---|---|
Labour | Trevor Holt | 1,259 | 52.9 | +15.6 | |
Conservative | Azmat Husain | 702 | 29.5 | +3.5 | |
Liberal Democrat | Ewan Arthur | 597 | 18.6 | -6.7 | |
Majority | 557 | 23.4 | |||
Turnout | 2,382 | ||||
Labour hold | Swing | ||||
Party | Candidate | Votes | % | ± | |
---|---|---|---|---|---|
Conservative | Michael Hankey | 1,533 | 47.7 | +9.1 | |
Labour | Stella Smith | 1,083 | 33.7 | -0.9 | |
Liberal Democrat | Ewan Arthur | 597 | 18.6 | +1.9 | |
Majority | 450 | 14.0 | |||
Turnout | 3,213 | ||||
Conservative gain from Labour | Swing | ||||
Party | Candidate | Votes | % | ± | |
---|---|---|---|---|---|
Liberal Democrat | Tim Pickstone | 1,576 | 52.0 | -4.7 | |
Conservative | Marilyn Vincent | 757 | 25.0 | +5.6 | |
Labour | Suzanne Johnston | 699 | 23.1 | -0.8 | |
Majority | 819 | 27.0 | |||
Turnout | 3,032 | ||||
Liberal Democrat hold | Swing | ||||
Party | Candidate | Votes | % | ± | |
---|---|---|---|---|---|
Conservative | Peter Ashworth | 1,129 | 40.2 | +7.0 | |
Labour | Warren Flood | 995 | 35.4 | -9.3 | |
Liberal Democrat | Victor Hagan | 686 | 24.4 | +2.3 | |
Majority | 134 | 4.8 | |||
Turnout | 2,810 | ||||
Conservative gain from Labour | Swing | ||||
Party | Candidate | Votes | % | ± | |
---|---|---|---|---|---|
Conservative | James Taylor | 2,350 | 61.9 | +1.7 | |
Liberal Democrat | Robert Sloss | 741 | 19.5 | +1.3 | |
Labour | Francis Shatliff | 706 | 18.6 | -2.9 | |
Majority | 1,609 | 42.4 | |||
Turnout | 3,797 | ||||
Conservative hold | Swing | ||||
Party | Candidate | Votes | % | ± | |
---|---|---|---|---|---|
Conservative | Bernard Vincent | 1,760 | 61.7 | +10.1 | |
Labour | Alan Quinn | 840 | 29.5 | -1.8 | |
Liberal Democrat | Mohammed Mustafa | 251 | 8.8 | -8.4 | |
Majority | 920 | 32.3 | |||
Turnout | 2,851 | ||||
Conservative hold | Swing | ||||
Party | Candidate | Votes | % | ± | |
---|---|---|---|---|---|
Conservative | Catherine Berry | 1,029 | 38.8 | +12.7 | |
Labour | Steve Perkins | 963 | 36.3 | -1.8 | |
Liberal Democrat | Michael Halsall | 460 | 17.4 | -0.6 | |
Independent | Paul Clarke | 199 | 7.5 | +7.5 | |
Majority | 66 | 2.5 | |||
Turnout | 2,651 | ||||
Conservative gain from Labour | Swing | ||||
Party | Candidate | Votes | % | ± | |
---|---|---|---|---|---|
Labour | Sharron Briggs | 1,431 | 42.2 | +2.0 | |
Conservative | Stuart Penketh | 1,416 | 41.7 | +7.1 | |
Liberal Democrat | Maureen Davison | 367 | 10.8 | -6.1 | |
Independent | Matthew Randall | 180 | 5.3 | -3.1 | |
Majority | 15 | 0.4 | |||
Turnout | 3,394 | ||||
Labour hold | Swing | ||||
Party | Candidate | Votes | % | ± | |
---|---|---|---|---|---|
Labour | Wayne Campbell | 1,231 | 54.9 | +1.0 | |
Conservative | Alan Bigg | 709 | 31.6 | +3.8 | |
Independent | Deborah Fallon | 301 | 13.4 | +13.4 | |
Majority | 522 | 23.3 | |||
Turnout | 2,241 | ||||
Labour hold | Swing | ||||
Party | Candidate | Votes | % | ± | |
---|---|---|---|---|---|
Conservative | Diane Ashworth | 1,759 | 56.3 | +5.1 | |
Labour | Valerie Robinson | 939 | 30.0 | -0.9 | |
Liberal Democrat | Fiona Davison | 427 | 13.7 | -4.2 | |
Majority | 820 | 26.2 | |||
Turnout | 3,125 | ||||
Conservative hold | Swing | ||||
Party | Candidate | Votes | % | ± | |
---|---|---|---|---|---|
Labour | Farook Chaudhry | 1,178 | 37.5 | +2.7 | |
Conservative | Khalid Hussain | 1,127 | 35.8 | +8.5 | |
Liberal Democrat | Bill Brison | 840 | 26.7 | +3.9 | |
Majority | 51 | 1.6 | |||
Turnout | 3,145 | ||||
Labour gain from Conservative | Swing | ||||
Party | Candidate | Votes | % | ± | |
---|---|---|---|---|---|
Liberal Democrat | Donal O'Hanlon | 1,333 | 42.0 | +17.6 | |
Labour | Steve Treadgold | 896 | 28.2 | -14.6 | |
Conservative | Denise Ormrod | 727 | 22.9 | -9.9 | |
Independent | Andrew Duff | 217 | 6.8 | +6.8 | |
Majority | 437 | 13.8 | |||
Turnout | 3,173 | ||||
Liberal Democrat gain from Labour | Swing | ||||
Party | Candidate | Votes | % | ± | |
---|---|---|---|---|---|
Liberal Democrat | Andrew Garner | 1,478 | 39.1 | +1.5 | |
Labour | Peter Timperley | 1,224 | 32.4 | -1.9 | |
Conservative | Shneur Odze | 1,075 | 28.5 | +0.5 | |
Majority | 254 | 6.7 | |||
Turnout | 3,777 | ||||
Liberal Democrat hold | Swing | ||||
Party | Candidate | Votes | % | ± | |
---|---|---|---|---|---|
Conservative | Iain Garside | 1,590 | 57.2 | +13.9 | |
Labour | Jane Lewis | 711 | 25.6 | -1.2 | |
Liberal Democrat | David Foss | 478 | 17.2 | +3.2 | |
Majority | 879 | 31.6 | |||
Turnout | 2,779 | ||||
Conservative hold | Swing | ||||
Party | Candidate | Votes | % | ± | |
---|---|---|---|---|---|
Conservative | Beverley Sullivan | 1,311 | 42.5 | +2.5 | |
Labour | Joan Grimshaw | 1,250 | 40.5 | +1.1 | |
Liberal Democrat | Geoffrey Young | 372 | 12.1 | -0.9 | |
Independent | Paul Gerrard | 154 | 5.0 | -2.6 | |
Majority | 61 | 2.0 | |||
Turnout | 3,087 | ||||
Conservative gain from Labour | Swing | ||||
Elections for the Council in the London Borough of Croydon are held every four years to elect 70 councillors. At the last elections, which were held in May 2014, 30 Conservative councillors and 40 Labour councillors, providing a Labour majority of ten seats.
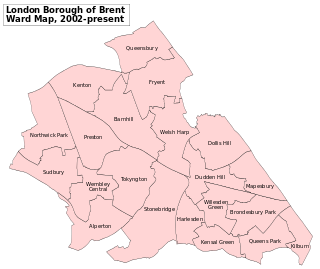
Brent London Borough Council in London, England is elected every four years. Since the last boundary changes in 2002, 63 councillors have been elected from 21 wards.
The 1998 Bolton Metropolitan Borough Council election took place on 7 May 1998 to elect members of Bolton Metropolitan Borough Council in Greater Manchester, England. One third of the council was up for election and the Labour party kept overall control of the council.
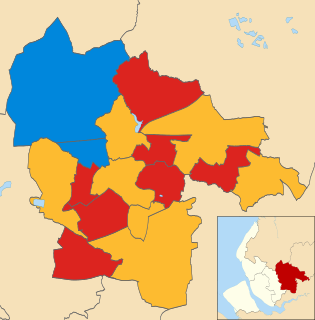
The 2006 St Helens Metropolitan Borough Council election took place on 4 May 2006 to elect members of St Helens Metropolitan Borough Council in Merseyside, England. One third of the council was up for election and the council stayed under no overall control.
Elections to Lambeth London Borough Council were held on 4 May 2006. The whole council was up for election with no boundary changes since the last election in 2002. The Labour party gained control of the council, replacing the Liberal Democrat and Conservative coalition that had run the council since the previous election.
The 1998 Oldham Council election took place on 7 May 1998 to elect members of Oldham Metropolitan Borough Council in Greater Manchester, England. One third of the council was up for election and the Labour party stayed in overall control of the council.
The London Borough of Lewisham is a London borough, in the United Kingdom, established in 1964. Elections are held every four years using a plurality bloc vote electoral system for the councillors and the supplementary vote electoral system for the elected mayor.
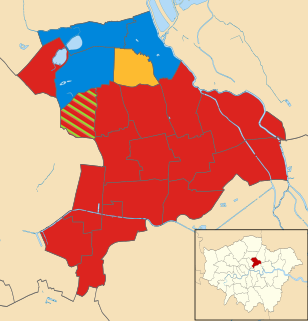
Elections for London Borough of Hackney Council were held on Thursday 4 May 2006. The whole council was up for election. Hackney is split up into 19 wards, each electing three councillors, so a total of 57 seats were up for election.
The 2006 Camden Council election took place on 4 May 2006 to elect members of Camden London Borough Council in London, England. The whole council was up for election and the Labour Party lost overall control of the council to no overall control.
Middlesex County Council was the principal local government body in the administrative county of Middlesex, England from 1889 to 1965.
The 2010 Enfield Council election took place on 6 May 2010 to elect members of Enfield London Borough Council in London, England. The whole council was up for election and the Labour party gained overall control of the council from the Conservative party.
Elections to Newham London Borough Council were held on 9 May 1968. The whole council was up for election. Turnout was 22.8%.
The 2011 United Kingdom local elections were held on Thursday 5 May 2011. In England, direct elections were held in all 36 Metropolitan boroughs, 194 Second-tier district authorities, 49 unitary authorities and various mayoral posts, meaning local elections took place in all parts of England with the exception of seven unitary authorities, and seven districts and boroughs. For the majority of English districts and the 25 unitary authorities that are elected "all out" these were the first elections since 2007. In Northern Ireland, there were elections to all 26 local councils. Elections also took place to most English parish councils.
The 2012 Colchester Borough Council election took place on 3 May 2012 to elect members of Colchester Borough Council in Essex, England. One third of the council was up for election and the council stayed under no overall control.
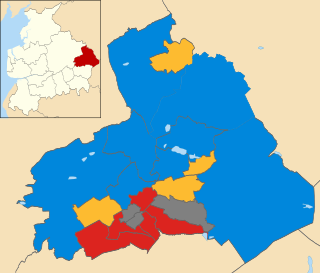
The 2011 Pendle Borough Council election took place on 5 May 2011 to elect members of Pendle Borough Council in Lancashire, England. One third of the council was up for election and the council stayed under no overall control.
The 2012 Harlow District Council election took place on 3 May 2012 to elect members of Harlow District Council in Essex, England. One third of the council was up for election and the Labour party gained overall control of the council from the Conservative party.
The 2014 Brent London Borough Council election took place on 22 May 2014 to elect members of Brent London Borough Council in London, England. The whole council was up for election and the Labour Party stayed in overall control of the council.
The 1994 Hammersmith and Fulham Council election took place on 5 May 1994 to elect members of Hammersmith and Fulham London Borough Council in London, England. The whole council was up for election and the Labour party regained overall control of the council, which it had lost during the previous council term.
Elections for the London Borough of Merton were held on 6 May 1982 to elect members of Merton London Borough Council in London, England. This was on the same day as other local elections in England and Scotland.
The 2015 Harlow District Council election took place on 7 May 2015 to elect members of Harlow District Council in Essex, England. One third of the council was up for election and Labour party councillors increased their control of the council as the governing group, gaining one councillor and suffering no losses.