This is a summary of the electoral history of David Cameron , who served as Prime Minister of the United Kingdom from 2010 to 2016 and Leader of the Conservative Party from 2005 to 2016, and as Foreign Secretary in the Sunak ministry from 2023 to 2024. He was also the member of parliament (MP) for Witney from 2001 to 2016.
Contents
- Parliamentary elections
- 1997 general election, Stafford
- 2001 general election, Witney
- 2005 general election, Witney
- 2010 general election, Witney
- 2015 general election, Witney
- 2005 Conservative Party leadership election
- United Kingdom general elections
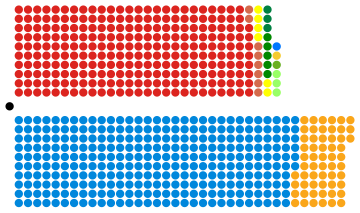
- 2010 general election
- 2015 general election
- References