List of U.S. states by African-American population

Last updated

The following is a list of U.S. states and the District of Columbia ranked by the proportion of African Americans in the population.

U.S. state constituent political entity of the United States

In the United States, a state is a constituent political entity, of which there are currently 50. Bound together in a political union, each state holds governmental jurisdiction over a separate and defined geographic territory and shares its sovereignty with the federal government. Due to this shared sovereignty, Americans are citizens both of the federal republic and of the state in which they reside. State citizenship and residency are flexible, and no government approval is required to move between states, except for persons restricted by certain types of court orders. Four states use the term commonwealth rather than state in their full official names.

Contents

Percentage of population self-reported as African American by state in 2010:
less than 2%
2-5%
5-10%
10-15%
15-20%
20-25%
25-30%
30-35%
35-40% African American by state in the USA in 2010.svg
Percentage of population self-reported as African American by state in 2010:

By 2010 census results

% African-AmericanRankStateAfrican-American Alone
Population (2010) [1]
50.08%1 District of Columbia 305,074
37.30%2 Mississippi 1,974,777|-32.4%3 Louisiana 1,506,534
31.4%4 Georgia 3,150,435
30.1%5 Maryland 1,798,593
28.48%6 South Carolina 1,290,684
26.38%7 Alabama 1,251,311
21.60%8 North Carolina 2,048,628
20.95%9 Delaware 191,814
19.91%10 Virginia 1,551,399
16.78%11 Tennessee 1,055,689
15.91%12 Florida 2,999,862
15.76%13 Arkansas 449,895
15.18%14 New York 3,073,800
14.88%15 Illinois 1,866,414
14.46%16 New Jersey 1,204,826
14.24%17 Michigan 1,400,362
12.04%18 Ohio 1,407,681
11.91%19 Texas 2,979,598
11.49%20 Missouri 704,043
10.79%21 Pennsylvania 1,377,689
10.34%22 Connecticut 362,296
9.07%23 Indiana 591,397
9.0%24 Nevada 255,633
8.2%25 Kentucky 361,273
8.1%26 Massachusetts 528,761
7.96%27 Oklahoma 277,644
7.5%28 Rhode Island 79,719
6.67%29 California 2,299,072
6.15%30 Kansas 167,864
6.07%31 Wisconsin 359,148
4.57%32 Minnesota 274,412
4.50%33 Nebraska 82,885
4.28%34 Colorado 201,737
4.27%35 Alaska 23,263
4.16%36 Arizona 259,008
3.74%37 Washington 240,042
3.58%38 West Virginia 63,124
3.08%39 Hawaii 21,424
2.97%40 New Mexico 42,550
2.68%41 Iowa 89,148
2.01%42 Oregon 69,206
1.29%43 Wyoming 4,748
1.27%44 Utah 29,287
1.22%45 New Hampshire 15,035
1.14%46 South Dakota 10,207
1.08%47 North Dakota 7,960
1.03%48 Maine 15,707
0.95%49 Idaho 9,810
0.87%50 Vermont 6,277
0.67%51 Montana 4,027

African-American proportion of state populations (1790–2010)

African-American % of Population (1790–2010) by U.S. State [2] [3] [4]
State/Territory17901800181018201830184018501860187018801890190019101920193019401950196019701980199020002010
Flag of the United States.svg United States of America 19.3%18.9%19.0%18.4%18.1%16.8%15.7%14.1%12.7%13.1%11.9%11.6%10.7%9.9%9.7%9.8%10.0%10.5%11.1%11.7%12.1%12.3%12.6%
Flag of Alabama.svg Alabama 41.4%29.0%33.2%38.5%43.3%44.7%45.4%47.7%47.5%44.8%45.2%42.5%38.4%35.7%34.7%32.0%30.0%26.2%25.6%25.3%26.0%26.2%
Flag of Alaska.svg Alaska 0.3%0.3%0.2%0.2%0.2%3.0%3.0%3.4%4.1%3.5%3.3%
Flag of Arizona.svg Arizona 0.3%0.3%0.4%1.5%1.5%1.0%2.4%2.5%3.0%3.5%3.3%3.0%2.8%3.0%3.1%4.1%
Flag of Arkansas.svg Arkansas 13.0%11.7%15.5%20.9%22.7%25.6%25.2%26.3%27.4%28.0%28.1%27.0%25.8%24.8%22.3%21.8%18.3%16.3%15.9%15.7%15.4%
Flag of California.svg California 1.0%1.1%0.8%0.7%0.9%0.7%0.9%1.1%1.4%1.8%4.4%5.6%7.0%7.7%7.4%6.7%6.2%
Flag of Colorado.svg Colorado 0.1%1.1%1.3%1.5%1.6%1.4%1.2%1.1%1.1%1.5%2.3%3.0%3.5%4.0%3.8%4.0%
Flag of Connecticut.svg Connecticut 2.3%2.5%2.6%2.9%2.7%2.6%2.1%1.9%1.8%1.9%1.6%1.7%1.4%1.5%1.8%1.9%2.7%4.2%6.0%7.0%8.3%9.1%10.1%
Flag of Delaware.svg Delaware 21.6%22.4%23.8%24.0%24.9%25.0%22.2%19.3%18.2%18.0%16.8%16.6%15.4%13.6%13.7%13.5%13.7%13.6%14.3%16.1%16.9%19.2%21.4%
Flag of Washington, D.C..svg District of Columbia 30.4%33.1%31.2%30.1%29.1%26.6%19.1%33.0%33.6%32.8%31.1%28.5%25.1%27.1%28.2%35.0%53.9%71.1%70.3%65.8%60.0%50.7%
Flag of Florida.svg Florida 47.1%48.7%46.0%44.6%48.8%47.0%42.5%43.7%41.0%34.0%29.4%27.1%21.8%17.8%15.3%13.8%13.6%14.6%16.0%
Flag of Georgia (U.S. state).svg Georgia 35.9%37.1%42.5%44.4%42.6%41.0%42.4%44.0%46.0%47.0%46.7%46.7%45.1%41.7%36.8%34.7%30.9%28.5%25.9%26.8%27.0%28.7%30.5%
Flag of Hawaii.svg Hawaii 0.2%0.4%0.1%0.2%0.1%0.5%0.8%1.0%1.8%2.5%1.8%1.6%
Flag of Idaho.svg Idaho 0.4%0.2%0.2%0.2%0.2%0.2%0.2%0.1%0.2%0.2%0.3%0.3%0.3%0.4%0.6%
Flag of Illinois.svg Illinois 7.4%6.4%2.5%1.5%0.8%0.6%0.4%1.1%1.5%1.5%1.8%1.9%2.8%4.3%4.9%7.4%10.3%12.8%14.7%14.8%15.1%14.5%
Flag of Indiana.svg Indiana 4.4%2.6%1.0%1.1%1.0%1.1%0.8%1.5%2.0%2.1%2.3%2.2%2.8%3.5%3.6%4.4%5.8%6.9%7.6%7.8%8.4%9.1%
Flag of Iowa.svg Iowa 0.4%0.2%0.2%0.5%0.6%0.6%0.6%0.7%0.8%0.7%0.7%0.8%0.9%1.2%1.4%1.7%2.1%2.9%
Flag of Kansas.svg Kansas 0.6%4.7%4.3%3.5%3.5%3.2%3.3%3.5%3.6%3.8%4.2%4.8%5.3%5.8%5.7%5.9%
Flag of Kentucky.svg Kentucky 17.0%18.6%20.2%22.9%24.7%24.3%22.5%20.4%16.8%16.5%14.4%13.3%11.4%9.8%8.6%7.5%6.9%7.1%7.2%7.1%7.1%7.3%7.8%
Flag of Louisiana.svg Louisiana 55.2%51.8%58.5%55.0%50.7%49.5%50.1%51.5%50.0%47.1%43.1%38.9%36.9%35.9%32.9%31.9%29.8%29.4%30.8%32.5%32.0%
Flag of Maine.svg Maine 0.6%0.5%0.4%0.3%0.3%0.3%0.2%0.2%0.3%0.2%0.2%0.2%0.2%0.2%0.1%0.2%0.1%0.3%0.3%0.3%0.4%0.5%1.2%
Flag of Maryland.svg Maryland 34.7%36.7%38.2%36.1%34.9%32.3%28.3%24.9%22.5%22.5%20.7%19.8%17.9%16.9%16.9%16.6%16.5%16.7%17.8%22.7%24.9%27.9%29.4%
Flag of Massachusetts.svg Massachusetts 1.4%1.5%1.4%1.3%1.2%1.2%0.9%0.8%1.0%1.0%1.0%1.1%1.1%1.2%1.2%1.3%1.6%2.2%3.1%3.9%5.0%5.4%7.9%
Flag of Michigan.svg Michigan 3.7%3.0%2.1%0.8%0.3%0.6%0.9%1.0%0.9%0.7%0.7%0.6%1.6%3.5%4.0%6.9%9.2%11.2%12.9%13.9%14.2%14.2%
Flag of Minnesota.svg Minnesota 0.6%0.2%0.2%0.2%0.3%0.3%0.3%0.4%0.4%0.4%0.5%0.7%0.9%1.3%2.2%3.5%5.2%
Flag of Mississippi.svg Mississippi 41.5%47.0%44.1%48.4%52.3%51.2%55.3%53.7%57.5%57.6%58.5%56.2%52.2%50.2%49.2%45.3%42.0%36.8%35.2%35.6%36.3%37.0%
Flag of Missouri.svg Missouri 17.6%15.9%18.3%15.6%13.2%10.0%6.9%6.7%5.6%5.2%4.8%5.2%6.2%6.5%7.5%9.0%10.3%10.5%10.7%11.2%11.6%
Flag of Montana.svg Montana 0.9%0.9%1.0%0.6%0.2%0.3%0.2%0.2%0.2%0.2%0.3%0.2%0.3%0.3%0.4%
Flag of Nebraska.svg Nebraska 0.3%0.6%0.5%0.8%0.6%0.6%1.0%1.0%1.1%1.5%2.1%2.7%3.1%3.6%4.0%4.5%
Flag of Nevada.svg Nevada 0.7%0.8%0.8%0.5%0.3%0.6%0.4%0.6%0.6%2.7%4.7%5.7%6.4%6.6%6.8%8.1%
Flag of New Hampshire.svg New Hampshire 0.6%0.5%0.5%0.3%0.2%0.2%0.2%0.2%0.2%0.2%0.2%0.2%0.1%0.1%0.2%0.1%0.1%0.3%0.3%0.4%0.6%0.7%1.1%
Flag of New Jersey.svg New Jersey 7.7%8.0%7.6%7.2%6.4%5.8%4.9%3.8%3.4%3.4%3.3%3.7%3.5%3.7%5.2%5.5%6.6%8.5%10.7%12.6%13.4%13.6%13.7%
Flag of New Mexico.svg New Mexico 0.0%0.1%0.2%0.8%1.2%0.8%0.5%1.6%0.7%0.9%1.2%1.8%1.9%1.8%2.0%1.9%2.1%
Flag of New York.svg New York 7.6%5.3%4.2%2.9%2.3%2.1%1.6%1.3%1.2%1.3%1.2%1.4%1.5%1.9%3.3%4.2%6.2%8.4%11.9%13.7%15.9%15.9%17.5%
Flag of North Carolina.svg North Carolina 26.8%29.4%32.2%34.4%35.9%35.6%36.4%36.4%36.6%38.0%34.7%33.0%31.6%29.8%29.0%27.5%25.8%24.5%22.2%22.4%22.0%21.6%21.5%
Flag of North Dakota.svg North Dakota 1.0%0.3%0.2%0.1%0.1%0.1%0.1%0.0%0.0%0.1%0.4%0.4%0.6%0.6%1.2%
Flag of Ohio.svg Ohio 0.5%0.8%0.8%1.0%1.1%1.3%1.6%2.4%2.5%2.4%2.3%2.3%3.2%4.7%4.9%6.5%8.1%9.1%10.0%10.6%11.5%12.2%
Flag of Oklahoma.svg Oklahoma 8.4%7.0%8.3%7.4%7.2%7.2%6.5%6.6%6.7%6.8%7.4%7.6%7.4%
Flag of Oregon.svg Oregon 0.5%0.2%0.4%0.3%0.4%0.3%0.2%0.3%0.2%0.2%0.8%1.0%1.3%1.4%1.6%1.6%1.8%
Flag of Pennsylvania.svg Pennsylvania 2.4%2.7%2.9%2.9%2.8%2.8%2.3%2.0%1.9%2.0%2.0%2.5%2.5%3.3%4.5%4.7%6.1%7.5%8.6%8.8%9.2%10.0%10.8%
Flag of Rhode Island.svg Rhode Island 6.3%5.3%4.8%4.3%3.7%3.0%2.5%2.3%2.3%2.3%2.1%2.1%1.8%1.7%1.4%1.5%1.8%2.1%2.7%2.9%3.9%4.5%5.7%
Flag of South Carolina.svg South Carolina 43.7%43.2%48.4%52.8%55.6%56.4%58.9%58.6%58.9%60.7%59.8%58.4%55.2%51.4%45.6%42.9%38.8%34.8%30.5%30.4%29.8%29.5%27.9%
Flag of South Dakota.svg South Dakota 0.0%0.6%0.3%0.2%0.1%0.1%0.1%0.1%0.1%0.1%0.2%0.2%0.3%0.5%0.6%1.3%
Flag of Tennessee.svg Tennessee 10.6%13.2%17.5%19.6%21.4%22.7%24.5%25.5%25.6%26.1%24.4%23.8%21.7%19.3%18.3%17.4%16.1%16.5%15.8%15.8%16.0%16.4%16.7%
Flag of Texas.svg Texas 27.5%30.3%31.0%24.7%21.8%20.4%17.7%15.9%14.7%14.4%12.7%12.4%12.5%12.0%11.9%11.5%11.8%
Flag of Utah.svg Utah 0.4%0.1%0.1%0.2%0.3%0.2%0.3%0.3%0.2%0.2%0.4%0.5%0.6%0.6%0.7%0.8%1.1%
Flag of Vermont.svg Vermont 0.3%0.4%0.3%0.4%0.3%0.3%0.2%0.2%0.3%0.3%0.3%0.2%0.5%0.2%0.2%0.1%0.1%0.1%0.2%0.2%0.3%0.5%1.0%
Flag of Virginia.svg Virginia 43.4%44.6%47.1%47.8%47.9%46.9%45.0%43.3%41.9%41.8%38.4%35.6%32.6%29.9%26.8%24.7%22.1%20.6%18.5%18.9%18.8%19.6%19.4%
Flag of Washington.svg Washington 12.7%0.3%0.9%0.4%0.4%0.5%0.5%0.5%0.4%0.4%1.3%1.7%2.1%2.6%3.1%3.2%3.6%
Flag of West Virginia.svg West Virginia 9.5%9.8%11.5%12.1%11.2%9.6%7.8%5.6%4.1%4.2%4.3%4.5%5.3%5.9%6.6%6.2%5.7%4.8%3.9%3.3%3.1%3.2%3.4%
Flag of Wisconsin.svg Wisconsin 1.2%1.8%0.6%0.2%0.2%0.2%0.2%0.1%0.1%0.1%0.2%0.4%0.4%0.8%1.9%2.9%3.9%5.0%5.7%6.3%
Flag of Wyoming.svg Wyoming 2.0%1.4%1.5%1.0%1.5%0.7%0.6%0.4%0.9%0.7%0.8%0.7%0.8%0.8%0.8%
Flag of Puerto Rico.svg Puerto Rico 8.0%12.4%

Free Blacks as a percentage out of the total Black population by U.S. region and U.S. state between 1790 and 1860

In 1865, all enslaved Blacks (African-Americans) in the United States were emancipated as a result of the Thirteenth Amendment. However, some U.S. states had previously emancipated some or all of their Black population. The table below shows the percentage of free Blacks as a percentage of the total Black population in various U.S. regions and U.S. states between 1790 and 1860 (the blank areas on the chart below mean that there is no data for those specific regions or states in those specific years).

Thirteenth Amendment to the United States Constitution abolished slavery and involuntary servitude, except as punishment for a crime

The Thirteenth Amendment to the United States Constitution abolished slavery and involuntary servitude, except as punishment for a crime. In Congress, it was passed by the Senate on April 8, 1864, and by the House on January 31, 1865. The amendment was ratified by the required number of states on December 6, 1865. On December 18, 1865, Secretary of State William H. Seward proclaimed its adoption. It was the first of the three Reconstruction Amendments adopted following the American Civil War.

Free Blacks as a percentage of the total Black (African-American) population by U.S. region and U.S. state between 1790 and 1860 [5]
State/territory17901800181018201830184018501860
Flag of the United States.svg  United States 7.9%10.8%13.5%13.2%13.7%13.4%11.9%11.0%
Northeast 40.1%56.2%73.5%83.7%97.8%99.5%99.8%100.0%
Midwest 78.7%52.4%38.0%37.7%34.4%35.5%37.6%
South 4.7%6.7%8.5%8.2%8.4%8.1%7.0%6.3%
West 97.9%99.4%
Flag of Alabama.svg  Alabama 4.4%2.2%1.3%1.3%0.8%0.7%0.6%
Flag of Alaska.svg  Alaska
Flag of Arizona.svg  Arizona 100.0%
Flag of Arkansas.svg  Arkansas 1.4%3.5%3.0%2.3%1.3%0.1%
Flag of California.svg  California 100.0%100.0%
Flag of Colorado.svg  Colorado 100.0%
Flag of Connecticut.svg  Connecticut 50.4%84.9%95.4%98.8%99.7%99.8%100.0%100.0%
Flag of Delaware.svg  Delaware 30.5%57.3%75.9%74.2%82.8%86.7%88.8%91.7%
Flag of Washington, D.C..svg  District of Columbia 16.2%30.7%37.9%50.5%66.2%73.2%77.8%
Flag of Florida.svg  Florida 5.2%3.1%2.3%1.5%
Flag of Georgia (U.S. state).svg  Georgia 1.3%1.7%1.7%1.2%1.1%1.0%0.8%0.8%
Flag of Hawaii.svg  Hawaii
Flag of Idaho.svg  Idaho
Flag of Illinois.svg  Illinois 41.5%78.5%33.3%68.7%91.6%100.0%100.0%
Flag of Indiana.svg  Indiana 75.7%62.4%86.6%99.9%100.0%100.0%100.0%
Flag of Iowa.svg  Iowa 91.5%100.0%100.0%
Flag of Kansas.svg  Kansas 99.7%
Flag of Kentucky.svg  Kentucky 0.9%1.8%2.1%2.1%2.9%3.9%4.5%4.5%
Flag of Louisiana.svg  Louisiana 18.0%13.2%13.2%13.1%6.7%5.3%
Flag of Maine.svg  Maine 100.0%100.0%100.0%100.0%99.8%100.0%100.0%100.0%
Flag of Maryland.svg  Maryland 7.2%15.6%23.3%27.0%33.9%40.9%45.3%49.1%
Flag of Massachusetts.svg  Massachusetts 100.0%100.0%100.0%100.0%100.0%100.0%100.0%100.0%
Flag of Michigan.svg  Michigan 100.0%83.3%100.0%99.6%100.0%100.0%100.0%
Flag of Minnesota.svg  Minnesota 100.0%100.0%
Flag of Mississippi.svg  Mississippi 5.0%1.2%1.4%0.8%0.7%0.3%0.2%
Flag of Missouri.svg  Missouri 17.4%3.3%2.2%2.6%2.9%3.0%
Flag of Montana.svg  Montana
Flag of Nebraska.svg  Nebraska 81.7%
Flag of Nevada.svg  Nevada 100.0%
Flag of New Hampshire.svg  New Hampshire 79.9%100.0%100.0%100.0%99.5%99.8%100.0%100.0%
Flag of New Jersey.svg  New Jersey 19.5%26.2%42.0%62.2%89.0%96.9%99.0%99.9%
Flag of New Mexico.svg  New Mexico 100.0%100.0%
Flag of New York.svg  New York 17.9%33.3%62.8%74.4%99.8%100.0%100.0%100.0%
Flag of North Carolina.svg  North Carolina 4.7%5.0%5.7%6.7%7.4%8.5%8.7%8.4%
Flag of North Dakota.svg  North Dakota
Flag of Ohio.svg  Ohio 100.0%100.0%100.0%99.9%100.0%100.0%100.0%
Flag of Oklahoma.svg  Oklahoma
Flag of Oregon.svg  Oregon 100.0%100.0%
Flag of Pennsylvania.svg  Pennsylvania 63.6%89.5%96.6%99.3%98.9%99.9%100.0%100.0%
Flag of Rhode Island.svg  Rhode Island 78.2%89.7%97.1%98.7%99.5%99.8%100.0%100.0%
Flag of South Carolina.svg  South Carolina 1.7%2.1%2.3%2.6%2.4%2.5%2.3%2.4%
Flag of South Dakota.svg  South Dakota N/A [a]
Flag of Tennessee.svg  Tennessee 9.6%2.2%2.9%3.3%3.1%2.9%2.6%2.6%
Flag of Texas.svg  Texas 0.7%0.2%
Flag of Utah.svg  Utah 48.0%50.8%
Flag of Vermont.svg  Vermont 100.0%100.0%100.0%100.0%100.0%100.0%100.0%100.0%
Flag of Virginia.svg  Virginia 4.1%5.6%7.3%8.2%9.3%10.1%10.2%10.5%
Flag of Washington.svg  Washington 100.0%100.0%
Flag of West Virginia.svg  West Virginia 11.6%6.8%10.5%8.5%10.9%14.1%13.1%13.1%
Flag of Wisconsin.svg  Wisconsin 100.0%51.6%94.4%100.0%100.0%
Flag of Wyoming.svg  Wyoming

a ^ There were no Blacks at all--either free or enslaved--in South Dakota in 1860. [5]

See also

Black Belt (U.S. region) Region of the Southeastern United States

The Black Belt is a region of the Southern United States. The term originally described the prairies and dark fertile soil of central Alabama and northeast Mississippi. Because this area in the 19th century was historically developed for cotton plantations based on enslaved African American labor, the term became associated with these conditions. It was generally applied to a much larger agricultural region in the Southern US characterized by a history of cotton plantation agriculture in the 19th century and a high percentage of African Americans outside metropolitan areas. The enslaved peoples were freed after the American Civil War, and many continued to work in agriculture afterward. Their descendants make up much of the African-American population of the United States.

Related Research Articles

Red Devil, Alaska CDP in Alaska, United States

Red Devil is a census-designated place (CDP) in Bethel Census Area, Alaska, United States. The population was 23 at the 2010 census, down from 48 in 2000. Their post office was founded in 1957

Avera, Georgia City in Georgia, United States

Avera is a city in Jefferson County, Georgia, United States. As of the 2010 census, the city had a population of 246.

Arnoldsville, Georgia City in Georgia, United States

Arnoldsville is a city in Oglethorpe County, Georgia, United States. As of the 2010 census, the city had a population of 357.

Braswell, Georgia City in Georgia, United States

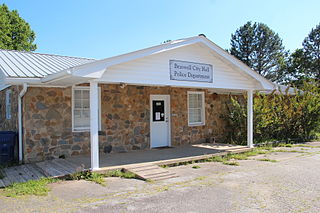
Braswell is a city in Polk and Paulding counties in the U.S. state of Georgia. As of the 2010 census, the city had a population of 379.

Middlebury, Indiana Town in Indiana, United States

Middlebury is a town in Middlebury Township, Elkhart County, Indiana, United States. It is located approximately 35 miles east of South Bend, 130 miles east of Chicago, Illinois and 165 miles north of Indianapolis. Middlebury is nestled in Northern Indiana's Amish country. As of the 2010 census, the town population was 3,420.

Lake Meade, Pennsylvania Census-designated place in Pennsylvania, United States

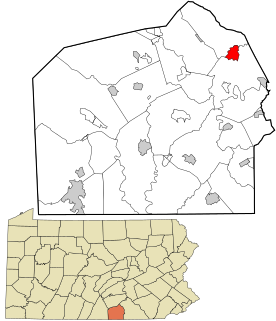
Lake Meade is an unincorporated census-designated place in Latimore and Reading townships, Adams County, Pennsylvania, United States. The population was 2,563 at the 2010 census.

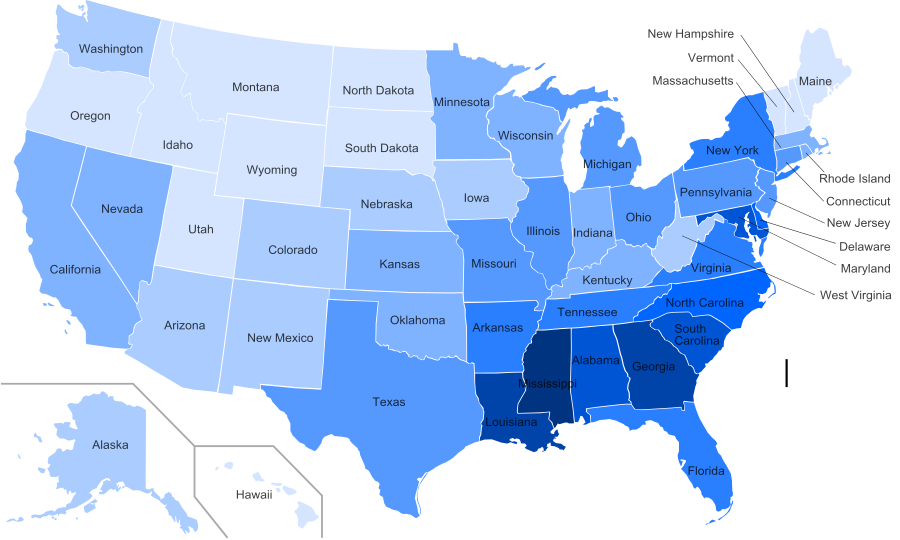
Pacific Islands Americans, also known as Oceanian Americans, Pacific Islander Americans or Native Hawaiian and/or other Pacific Islander Americans, are Americans who have ethnic ancestry among the indigenous peoples of Oceania. For its purposes, the U.S. Census also counts Indigenous Australians as part of this group.

Morristown, Arizona Census-designated place in Arizona, United States

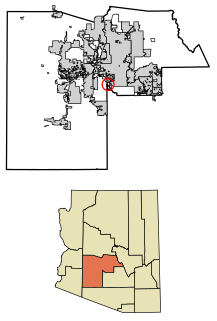
Morristown is a census-designated place in Maricopa County, Arizona, United States. It is about 50 miles (80 km) northwest of Phoenix, at the junction of State Route 74 and U.S. Route 60.

Wintersburg, Arizona Census-designated place in Arizona, United States

Wintersburg is a census-designated place in Maricopa County, Arizona, United States, located about 50 miles west of Phoenix, and 15 miles west of Buckeye along Interstate 10.

Lafayette-Opelousas-Morgan City CSA

The Lafayette–Opelousas–Morgan City combined statistical area is made up of seven parishes in the Acadiana region of southern Louisiana. The statistical area consists of the Lafayette Metropolitan Statistical Area (MSA) and two micropolitical statistical areas (μSAs) – Opelousas, Louisiana Micropolitical Statistical Area and Morgan City, Louisiana Micropolitical Statistical Area. The region consists of seven parishes: Acadia, Iberia, Lafayette, St. Landry, St. Martin, St. Mary, and Vermilion Parishes. As of the 2010 census, the CSA had a population of 604,784.

St. Johns, Maricopa County, Arizona CDP in Arizona, United States

St. Johns is a census-designated place (CDP) in Maricopa County, Arizona, United States, located in the Gila River Indian Community. The population was 476 at the 2010 census.

Sacaton Flats Village, Arizona CDP in Arizona, United States

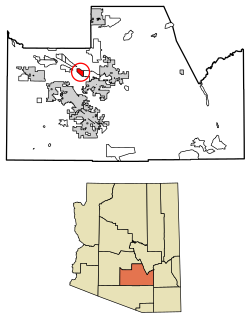
Sacaton Flats Village is a census-designated place (CDP) in Pinal County, Arizona, United States, located in the Gila River Indian Community. The population was 621 at the 2010 census.

Stotonic Village, Arizona CDP in Arizona, United States

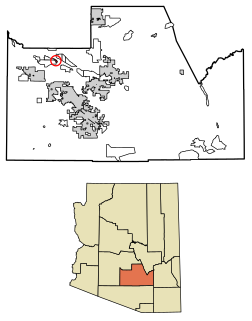
Stotonic is a census-designated place (CDP) in Pinal County, Arizona, United States, located in the Gila River Indian Community. The population was 659 at the 2010 census.

Sweet Water Village, Arizona CDP in Arizona, United States

Sweet Water Village is a census-designated place (CDP) in Pinal County, Arizona, United States, located in the Gila River Indian Community. The population was 83 at the 2010 census.

Auxier, Kentucky Census-designated place in Kentucky, United States

Auxier is an unincorporated community and census-designated place (CDP) in Floyd County, Kentucky, United States. The 2010 United States Census reported that Auxier's population was 669, of which 661 persons were white and 2 persons were black.

Dwale, Kentucky Census-designated place in Kentucky, United States

Dwale is an unincorporated community and census-designated place in Floyd County, Kentucky, United States. The 2010 United States Census reported that Dwale's population was 329, of which 312 persons were white and 9 persons were Asian.

Maytown, Kentucky Census-designated place in Kentucky, United States

Maytown is an unincorporated community and census-designated place in Floyd County, Kentucky, United States.

Tulsa is the second largest city of the U.S. state of Oklahoma and the county seat of Tulsa County. The city was estimated in 2011 by the U.S. Census Bureau to have 396,466 residents.

Mestizos in the United States are Latino Americans whose racial and/or ethnic identity is Mestizo, i.e. a mixed ancestry of white European and Native American from Latin America.

References

  1. U.S. Census Bureau (2011). "2010 Census Interactive Population Search" . Retrieved 2011-06-24.
  2. "Historical Census Statistics on Population Totals By Race, 1790 to 1990, and By Hispanic Origin, 1970 to 1990, For The United States, Regions, Divisions, and States". Census.gov. Archived from the original on July 25, 2008. Retrieved September 15, 2012.
  3. "Powered by Google Docs". Docs.google.com. Retrieved September 15, 2012.
  4. "Powered by Google Docs". Docs.google.com. Retrieved September 15, 2012.
  5. 1 2 "Population Division Working Paper No. 56" (PDF). Retrieved 2018-08-17.