
Electricity generation is the process of generating electric power from sources of primary energy. For electric utilities in the electric power industry, it is the first stage in the delivery of electricity to end users, the other stages being transmission, distribution, energy storage and recovery, using the pumped-storage method.

A fossil fuel is a fuel formed by natural processes, such as anaerobic decomposition of buried dead organisms, containing energy originating in ancient photosynthesis. The age of the organisms and their resulting fossil fuels is typically millions of years, and sometimes exceeds 650 million years. Fossil fuels contain high percentages of carbon and include petroleum, coal, and natural gas. Other commonly used derivatives include kerosene and propane. Fossil fuels range from volatile materials with low carbon to hydrogen ratios like methane, to liquids like petroleum, to nonvolatile materials composed of almost pure carbon, like anthracite coal. Methane can be found in hydrocarbon fields either alone, associated with oil, or in the form of methane clathrates.
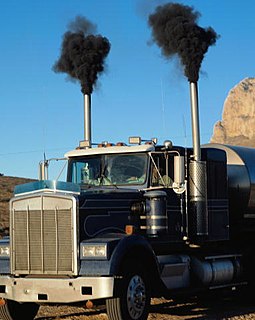
Exhaust gas or flue gas is emitted as a result of the combustion of fuels such as natural gas, gasoline, petrol, biodiesel blends, diesel fuel, fuel oil, or coal. According to the type of engine, it is discharged into the atmosphere through an exhaust pipe, flue gas stack, or propelling nozzle. It often disperses downwind in a pattern called an exhaust plume.
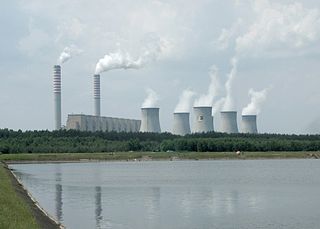
A fossil fuel power station is a thermal power station which burns a fossil fuel, such as coal or natural gas, to produce electricity. Fossil fuel power stations have machinery to convert the heat energy of combustion into mechanical energy, which then operates an electrical generator. The prime mover may be a steam turbine, a gas turbine or, in small plants, a reciprocating gas engine. All plants use the energy extracted from expanding gas, either steam or combustion gases. Although different energy conversion methods exist, all thermal power station conversion methods have efficiency limited by the Carnot efficiency and therefore produce waste heat.
An emission intensity is the emission rate of a given pollutant relative to the intensity of a specific activity, or an industrial production process; for example grams of carbon dioxide released per megajoule of energy produced, or the ratio of greenhouse gas emissions produced to gross domestic product (GDP). Emission intensities are used to derive estimates of air pollutant or greenhouse gas emissions based on the amount of fuel combusted, the number of animals in animal husbandry, on industrial production levels, distances traveled or similar activity data. Emission intensities may also be used to compare the environmental impact of different fuels or activities. In some case the related terms emission factor and carbon intensity are used interchangeably. The jargon used can be different, for different fields/industrial sectors; normally the term "carbon" excludes other pollutants, such as particulate emissions. One commonly used figure is carbon intensity per kilowatt-hour (CIPK), which is used to compare emissions from different sources of electrical power.

A carbon footprint is historically defined as the total emissions caused by an individual, event, organization, or product, expressed as carbon dioxide equivalent. Greenhouse gases (GHGs), including carbon dioxide, can be emitted through land clearance and the production and consumption of food, fuels, manufactured goods, materials, wood, roads, buildings, transportation and other services.

Coal pollution mitigation, often called clean coal, is a series of systems and technologies that seek to mitigate the pollution and other environmental effects normally associated with the burning of coal, which is widely regarded as the dirtiest of the common fuels for industrial processes and power generation.
An emission inventory is an accounting of the amount of pollutants discharged into the atmosphere. An emission inventory usually contains the total emissions for one or more specific greenhouse gases or air pollutants, originating from all source categories in a certain geographical area and within a specified time span, usually a specific year.

According to the U.S. Energy Information Industry (EIA), the United States produced 5.14 billion metric tons of carbon-dioxide equivalent greenhouse gas (GHG) emissions in 2017, the lowest since the early 1990s. From year to year, emissions rise and fall due to changes in the economy, the price of fuel and other factors. The US Environmental Protection Agency attributed recent decreases to a reduction in emissions from fossil fuel combustion, which was a result of multiple factors including switching from coal to natural gas consumption in the electric power sector; warmer winter conditions that reduced demand for heating fuel in the residential and commercial sectors; and a slight decrease in electricity demand.
The Emissions & Generation Resource Integrated Database (eGRID) is a comprehensive source of data on the environmental characteristics of almost all electric power generated in the United States. eGRID is issued by the U.S. Environmental Protection Agency (EPA).

Livestock's Long Shadow: Environmental Issues and Options is a United Nations report, released by the Food and Agriculture Organization of the United Nations (FAO) on 29 November 2006, that "aims to assess the full impact of the livestock sector on environmental problems, along with potential technical and policy approaches to mitigation".
A low-carbon diet refers to making lifestyle choices to reduce the greenhouse gas emissions (GHGe) resulting from consumption decisions. It is estimated that the U.S. food system is responsible for at least 20 percent of U.S. greenhouse gases. This estimate may be low, as it counts only direct sources of GHGe. Indirect sources, such as demand for products from other countries, are often not counted. A low-carbon diet minimizes the emissions released from the production, packaging, processing, transport, preparation and waste of food. Major tenets of a low-carbon diet include eating less industrial meat and dairy, eating less industrially produced food in general, eating food grown locally and seasonally, eating less processed and packaged foods and reducing waste from food by proper portion size, recycling or composting.

A greenhouse gas is a gas that absorbs and emits radiant energy within the thermal infrared range. Greenhouse gases cause the greenhouse effect. The primary greenhouse gases in Earth's atmosphere are water vapor, carbon dioxide, methane, nitrous oxide and ozone. Without greenhouse gases, the average temperature of Earth's surface would be about −18 °C (0 °F), rather than the present average of 15 °C (59 °F). The atmospheres of Venus, Mars and Titan also contain greenhouse gases.
Bio-energy with carbon capture and storage (BECCS) is a potential greenhouse gas mitigation technology which produces negative carbon dioxide emissions by combining bioenergy (energy from biomass) use with geologic carbon capture and storage. The concept of BECCS is drawn from the integration of trees and crops, which extract carbon dioxide (CO2) from the atmosphere as they grow, the use of this biomass in processing industries or power plants, and the application of carbon capture and storage via CO2 injection into geological formations. There are other non-BECCS forms of carbon dioxide removal and storage that include technologies such as biochar, carbon dioxide air capture and biomass burial and enhanced weathering.
Fossil Fuel Beta (FFß) measures the percent change in excess (market-adjusted) stock returns for every 1 percent increase in fossil fuel prices. For example, if a company has an FFß of –0.20, then a 1 percent increase in fossil fuel prices should produce, on average, a 0.2% decline in the firm’s stock price over and above the impact arising from fossil fuel price swing on the stock market as a whole.
The Greenhouse gas footprint, or GHG footprint, refers to the amount of greenhouse gases that are emitted during the creation of products or services.

Carbon-neutral fuel is energy fuel or energy systems which have no net greenhouse gas emissions or carbon footprint. One class is synthetic fuel produced from renewable, sustainable or nuclear energy used to hydrogenate carbon dioxide directly captured from the air (DAC), recycled from power plant flue exhaust gas or derived from carbonic acid in seawater. Renewable energy sources include wind turbines, solar panels, and hydroelectric power stations. Another type of renewable energy source is biofuel. Such fuels are potentially carbon-neutral because they do not result in a net increase in atmospheric greenhouse gases.

The long tailpipe is an argument stating that usage of electric vehicles does not always result in fewer emissions compared to those from non-electric vehicles. While the argument acknowledges that plug-in electric vehicles operating in all-electric mode have no greenhouse gas emissions from the onboard source of power, it claims that these emissions are shifted from the vehicle tailpipe to the location of the electrical generation plants. From the point of view of a well-to-wheel assessment, the extent of the actual carbon footprint depends on the fuel and technology used for electricity generation.


