Penryn and Falmouth | |
---|---|
Former county constituency for the House of Commons | |
County | Cornwall |
Major settlements | Penryn and Falmouth |
1918–1950 | |
Seats | One |
Created from | Penryn and Falmouth, St Austell and Truro |
Replaced by | Truro and Falmouth & Camborne |
1832–1918 | |
Seats | 1832-1885: Two; 1885-1918: One |
Type of constituency | Borough constituency |
Created from | Cornwall and Penryn |
Replaced by | Penryn and Falmouth |
Penryn and Falmouth was the name of a constituency in Cornwall, England, UK, represented in the House of Commons of the Parliament of the United Kingdom from 1832 until 1950. From 1832 to 1918 it was a parliamentary borough, initially returning two Members of Parliament (MPs), elected by the bloc vote system.
Under the Redistribution of Seats Act 1885, its representation was reduced to one member, elected by the first past the post system. In 1918 the borough was abolished and the name was transferred to a county constituency electing one MP.
1918–1950: The Municipal Boroughs of Falmouth, Penryn, and Truro, the Urban District of St Austell, the Rural District of St Austell except the civil parishes of St Sampson and Tywardreath, the Rural District of East Kerrier except the civil parishes of Constantine, Mabe, and Perranarworthal, and the Rural District of Truro except the civil parishes of Kea, Kenwyn Rural, Perranzabuloe, St Agnes, St Allen, and Tregavethan. [1]
The constituency was created by the Reform Act 1832 (the "Great Reform Act") as a replacement for the Penryn constituency, which had become a notoriously rotten borough. The new borough consisted of Penryn, Falmouth and parts of Budock and St Gluvias parishes, giving it a mostly urban population of nearly 12,000, of whom 875 were registered to vote at its first election in 1832.
Initially Penryn and Falmouth elected two MPs, but this was reduced to one in 1885. It was one of the smallest constituencies in England for the next thirty years. At this period its voters were politically unpredictable; though generally among the more Conservative Cornish constituencies, they were influenced by personal factors and often swung against the national tide of opinion. Falmouth, which had a stronger non-conformist presence, was the more Liberal part of the constituency in the late 19th century, but was thought to become more Conservative as it developed its economy as a destination seaside resort.
In 1918 the borough was abolished, but the Penryn and Falmouth name was applied to the county constituency in which the two towns were placed. This was a much more extensive constituency, covering the whole of south central Cornwall, including the towns of Truro and St Austell as well a long stretch of coastline. The constituency had a more industrial character (a sixth of the population were engaged in tin mining); the area suffered badly from unemployment in the 1930s, and in 1935 the Labour Party came within 3,031 votes of winning what would have been their first seat in Cornwall.
The constituency was abolished for the 1950 general election, most of its area being moved into the Truro constituency. Penryn and Falmouth were assigned to the new Falmouth and Camborne division.
Election | 1st Member | 1st Party | 2nd Member | 2nd Party | ||
---|---|---|---|---|---|---|
1832 | Sir Robert Rolfe | Whig [2] [3] [4] | Lord Tullamore | Tory [2] | ||
1834 | Conservative [2] | |||||
1835 | James William Freshfield | Conservative [2] | ||||
1840 | Edward John Hutchins [5] | Whig [2] [6] [7] [8] | ||||
1841 | John Vivian | Whig [2] [9] [10] [11] | James Hanway Plumridge | Whig [2] [11] | ||
1847 | Howel Gwyn | Conservative | Francis Mowatt | Radical [12] [13] | ||
1852 | James William Freshfield | Conservative | ||||
1857 | Thomas Baring | Whig [14] [15] | Samuel Gurney [16] | Ind. Whig | ||
1859 | Liberal | Ind. Liberal | ||||
1866 | Jervoise Smith | Liberal | ||||
1868 | Robert Fowler | Conservative | Edward Eastwick | Conservative | ||
1874 | David James Jenkins | Liberal | Henry Thomas Cole | Liberal | ||
1880 | Reginald Brett | Liberal | ||||
1885 | Representation reduced to one member |
Election | Member | Party | |
---|---|---|---|
1885 | David James Jenkins | Liberal | |
1886 | William George Cavendish-Bentinck | Conservative | |
1895 | Frederick John Horniman | Liberal | |
1906 | Sir John Barker | Liberal | |
1910 | Charles Sydney Goldman | Unionist | |
1918 | Borough abolished; name transferred to county division |
Election | Member | Party | |
---|---|---|---|
1918 | Sir Edward Nicholl | Coalition Conservative | |
1922 | Capt Denis Shipwright | Conservative | |
1923 | Sir Courtenay Mansel | Liberal | |
1924 | George Pilcher [17] | Conservative | |
1929 | Sir Tudor Walters | Liberal | |
1931 | Maurice Petherick | Conservative | |
1945 | Evelyn King | Labour | |
1950 | constituency abolished |
Party | Candidate | Votes | % | ||
---|---|---|---|---|---|
Whig | Robert Rolfe | 490 | 36.6 | ||
Tory | Charles Bury | 428 | 32.0 | ||
Tory | James William Freshfield | 338 | 25.2 | ||
Tory | Charles Stewart | 83 | 6.2 | ||
Turnout | 717 | 81.9 | |||
Registered electors | 875 | ||||
Majority | 62 | 4.6 | |||
Whig win (new seat) | |||||
Majority | 90 | 6.8 | |||
Tory win (new seat) |
Party | Candidate | Votes | % | ±% | |
---|---|---|---|---|---|
Conservative | James William Freshfield | 464 | 36.1 | +10.9 | |
Whig | Robert Rolfe | 424 | 33.0 | −3.6 | |
Conservative | Charles Bury | 397 | 30.9 | −1.1 | |
Turnout | 736 | 90.8 | +8.9 | ||
Registered electors | 811 | ||||
Majority | 40 | 3.1 | −3.7 | ||
Conservative hold | Swing | +6.4 | |||
Majority | 27 | 2.1 | −2.5 | ||
Whig hold | Swing | −4.3 |
Rolfe was appointed Solicitor General for England and Wales, requiring a by-election.
Party | Candidate | Votes | % | ±% | |
---|---|---|---|---|---|
Whig | Robert Rolfe | 348 | 51.6 | +18.6 | |
Conservative | Charles Bury | 326 | 48.4 | −18.6 | |
Majority | 22 | 3.2 | +1.1 | ||
Turnout | 674 | 83.1 | −7.7 | ||
Registered electors | 811 | ||||
Whig hold | Swing | +18.6 |
Party | Candidate | Votes | % | ±% | |
---|---|---|---|---|---|
Whig | Robert Rolfe | 523 | 39.6 | +23.1 | |
Conservative | James William Freshfield | 434 | 32.9 | −34.1 | |
Whig | James Hanway Plumridge | 363 | 27.5 | +11.0 | |
Turnout | 761 | 85.7 | −5.1 | ||
Registered electors | 888 | ||||
Majority | 89 | 6.7 | +4.6 | ||
Whig hold | Swing | +20.1 | |||
Majority | 71 | 5.4 | +2.3 | ||
Conservative hold | Swing | −34.1 |
Rolfe resigned after being appointed a Judge of the Court of the Exchequer, causing a by-election.
Party | Candidate | Votes | % | ±% | |
---|---|---|---|---|---|
Whig | Edward John Hutchins | 462 | 66.0 | −1.1 | |
Conservative | William Carne | 238 | 34.0 | +1.1 | |
Majority | 224 | 32.0 | +25.3 | ||
Turnout | 700 | 79.1 | −6.6 | ||
Registered electors | 885 | ||||
Whig hold | Swing | −1.1 |
Party | Candidate | Votes | % | ±% | |
---|---|---|---|---|---|
Whig | John Vivian | 462 | 30.5 | −9.1 | |
Whig | James Hanway Plumridge | 432 | 28.5 | +1.0 | |
Conservative | Howel Gwyn | 381 | 25.1 | +8.7 | |
Conservative | Edward John Sartoris | 240 | 15.8 | −0.7 | |
Majority | 51 | 3.4 | −3.3 | ||
Turnout | 768 | 86.9 | +1.2 | ||
Registered electors | 884 | ||||
Whig hold | Swing | −6.6 | |||
Whig gain from Conservative | Swing | −1.5 |
Party | Candidate | Votes | % | ±% | |
---|---|---|---|---|---|
Conservative | Howel Gwyn | 548 | 54.2 | +29.1 | |
Radical | Francis Mowatt | 377 | 37.3 | −21.7 | |
Conservative | Peter Borthwick [19] | 87 | 8.6 | −7.2 | |
Turnout | 506 (est) | 58.6 (est) | −28.3 | ||
Registered electors | 884 | ||||
Majority | 171 | 16.9 | N/A | ||
Conservative gain from Whig | Swing | +20.0 | |||
Majority | 290 | 28.7 | N/A | ||
Radical gain from Whig | Swing | −21.8 |
Party | Candidate | Votes | % | ±% | |
---|---|---|---|---|---|
Conservative | Howel Gwyn | 464 | 37.5 | −16.7 | |
Conservative | James William Freshfield | 435 | 35.1 | +26.5 | |
Whig | Thomas Baring | 339 | 27.4 | −9.9 | |
Majority | 96 | 7.7 | −9.2 | ||
Turnout | 789 (est) | 87.0 (est) | +28.4 | ||
Registered electors | 906 | ||||
Conservative hold | Swing | −5.9 | |||
Conservative gain from Radical | Swing | +15.7 |
Party | Candidate | Votes | % | ±% | |
---|---|---|---|---|---|
Whig | Thomas Baring | Unopposed | |||
Independent Whig | Samuel Gurney | Unopposed | |||
Registered electors | 856 | ||||
Whig gain from Conservative | |||||
Ind. Whig gain from Conservative |
Baring was appointed a Civil Lord of the Admiralty, requiring a by-election.
Party | Candidate | Votes | % | ±% | |
---|---|---|---|---|---|
Whig | Thomas Baring | Unopposed | |||
Whig hold |
Party | Candidate | Votes | % | ±% | |
---|---|---|---|---|---|
Liberal | Thomas Baring | 389 | 30.2 | N/A | |
Independent Liberal | Samuel Gurney | 373 | 29.0 | N/A | |
Conservative | Howel Gwyn | 324 | 25.2 | New | |
Conservative | John Fitzgerald Leslie Foster [20] | 200 | 15.6 | New | |
Turnout | 643 (est) | 77.4 (est) | N/A | ||
Registered electors | 856 | ||||
Majority | 16 | 1.2 | N/A | ||
Liberal hold | Swing | N/A | |||
Majority | 49 | 3.8 | N/A | ||
Independent Liberal hold | Swing | N/A |
Party | Candidate | Votes | % | ±% | |
---|---|---|---|---|---|
Liberal | Thomas Baring | Unopposed | |||
Independent Liberal | Samuel Gurney | Unopposed | |||
Registered electors | 837 | ||||
Liberal hold | |||||
Independent Liberal hold |
Baring succeeded to the peerage, becoming Lord Northbrook and causing a by-election.
Party | Candidate | Votes | % | ±% | |
---|---|---|---|---|---|
Liberal | Jervoise Smith | 376 | 54.6 | N/A | |
Conservative | Robert Fowler | 313 | 45.4 | New | |
Majority | 63 | 9.2 | N/A | ||
Turnout | 689 | 82.3 | N/A | ||
Registered electors | 837 | ||||
Liberal hold | Swing | N/A |
Party | Candidate | Votes | % | ±% | |
---|---|---|---|---|---|
Conservative | Robert Fowler | 732 | 27.9 | N/A | |
Conservative | Edward Eastwick | 683 | 26.0 | N/A | |
Liberal | Jervoise Smith | 611 | 23.3 | N/A | |
Liberal | Kirkman Hodgson [21] | 597 | 22.8 | N/A | |
Majority | 72 | 2.7 | N/A | ||
Turnout | 1,312 (est) | 72.5 (est) | N/A | ||
Registered electors | 1,808 | ||||
Conservative gain from Liberal | Swing | N/A | |||
Conservative gain from Independent Liberal | Swing | N/A |
Party | Candidate | Votes | % | ±% | |
---|---|---|---|---|---|
Liberal | David James Jenkins | 851 | 28.1 | +4.8 | |
Liberal | Henry Thomas Cole | 784 | 25.9 | +3.1 | |
Conservative | Robert Fowler | 743 | 24.6 | −3.7 | |
Conservative | Edward Eastwick | 646 | 21.4 | −4.6 | |
Majority | 41 | 1.3 | N/A | ||
Turnout | 1,512 | 81.3 | −8.8 | ||
Registered electors | 1,860 | ||||
Liberal gain from Conservative | Swing | ||||
Liberal gain from Conservative | Swing |
Party | Candidate | Votes | % | ±% | |
---|---|---|---|---|---|
Liberal | David James Jenkins | 1,176 | 30.2 | +2.1 | |
Liberal | Reginald Brett | 1,071 | 27.5 | +1.6 | |
Conservative | Julius Vogel | 882 | 22.7 | −1.9 | |
Conservative | John D. Mayne | 765 | 19.6 | −1.8 | |
Majority | 189 | 4.8 | +3.5 | ||
Turnout | 1,947 (est) | 88.4 (est) | +7.1 | ||
Registered electors | 2,202 | ||||
Liberal hold | Swing | +2.0 | |||
Liberal hold | Swing | +1.7 |
Party | Candidate | Votes | % | ±% | |
---|---|---|---|---|---|
Liberal | David James Jenkins | 1,170 | 52.3 | −5.4 | |
Conservative | William Cavendish-Bentinck | 1,069 | 47.7 | +5.4 | |
Majority | 101 | 4.6 | −0.2 | ||
Turnout | 2,239 | 87.4 | −1.0 (est) | ||
Registered electors | 2,562 | ||||
Liberal hold | Swing | −5.4 |
Party | Candidate | Votes | % | ±% | |
---|---|---|---|---|---|
Conservative | William Cavendish-Bentinck | 1,089 | 52.2 | +4.5 | |
Liberal | David James Jenkins | 998 | 47.8 | −4.5 | |
Majority | 91 | 4.4 | N/A | ||
Turnout | 2,087 | 81.5 | −5.9 | ||
Registered electors | 2,562 | ||||
Conservative gain from Liberal | Swing | +4.5 |
Party | Candidate | Votes | % | ±% | |
---|---|---|---|---|---|
Conservative | William Cavendish-Bentinck | 1,218 | 58.1 | +5.9 | |
Liberal | Arthur Serena | 880 | 41.9 | −5.9 | |
Majority | 338 | 16.2 | +11.8 | ||
Turnout | 2,098 | 81.3 | −0.2 | ||
Registered electors | 2,580 | ||||
Conservative hold | Swing | +5.9 |
Party | Candidate | Votes | % | ±% | |
---|---|---|---|---|---|
Liberal | Frederick John Horniman | 1,150 | 51.1 | +9.2 | |
Conservative | William Cavendish-Bentinck | 1,101 | 48.9 | −9.2 | |
Majority | 49 | 2.2 | N/A | ||
Turnout | 2,251 | 86.0 | +4.7 | ||
Registered electors | 2,616 | ||||
Liberal gain from Conservative | Swing | +9.2 |
Party | Candidate | Votes | % | ±% | |
---|---|---|---|---|---|
Liberal | Frederick John Horniman | 1,184 | 50.4 | −0.7 | |
Conservative | Nathaniel Louis Cohen | 1,164 | 49.6 | +0.7 | |
Majority | 20 | 0.8 | −1.4 | ||
Turnout | 2,348 | 85.2 | −0.8 | ||
Registered electors | 2,756 | ||||
Liberal hold | Swing | −0.7 |
Party | Candidate | Votes | % | ±% | |
---|---|---|---|---|---|
Liberal | John Barker | 1,345 | 51.9 | +1.5 | |
Conservative | D B Hall | 1,248 | 48.1 | −1.5 | |
Majority | 97 | 3.8 | +3.0 | ||
Turnout | 2,593 | 88.6 | +3.4 | ||
Registered electors | 2,926 | ||||
Liberal hold | Swing | +1.5 |
Party | Candidate | Votes | % | ±% | |
---|---|---|---|---|---|
Conservative | Charles Sydney Goldman | 1,593 | 53.0 | +4.9 | |
Liberal | John Barker | 1,412 | 47.0 | −4.9 | |
Majority | 181 | 6.0 | N/A | ||
Turnout | 3,005 | 93.5 | +4.9 | ||
Registered electors | 3,215 | ||||
Conservative gain from Liberal | Swing | +4.9 |
Party | Candidate | Votes | % | ±% | |
---|---|---|---|---|---|
Conservative | Charles Sydney Goldman | 1,585 | 55.1 | +2.1 | |
Liberal | Walter Burt | 1,291 | 44.9 | −2.1 | |
Majority | 294 | 10.2 | +4.2 | ||
Turnout | 2,876 | 89.5 | −4.0 | ||
Registered electors | 3,215 | ||||
Conservative hold | Swing | +2.1 |
General Election 1914–15: Another General Election was required to take place before the end of 1915. The political parties had been making preparations for an election to take place and by July 1914, the following candidates had been selected;
Party | Candidate | Votes | % | ±% | |
---|---|---|---|---|---|
C | Unionist | Edward Nicholl | 10,050 | 50.6 | −4.5 |
Liberal | Arthur Carkeek (businessman) | 9,815 | 49.4 | +4.5 | |
Majority | 235 | 1.2 | −9.0 | ||
Turnout | 19,865 | 56.6 | −32.9 | ||
Unionist hold | Swing | −4.5 | |||
Cindicates candidate endorsed by the coalition government. |
Party | Candidate | Votes | % | ±% | |
---|---|---|---|---|---|
Unionist | Denis Shipwright | 11,566 | 42.7 | −7.9 | |
Liberal | Courtenay Mansel | 8,879 | 32.8 | −16.6 | |
Labour | Joseph Harris | 4,482 | 16.6 | New | |
National Liberal | George Hay Morgan | 2,129 | 7.9 | New | |
Majority | 2,687 | 9.9 | +8.7 | ||
Turnout | 27,056 | 72.5 | +15.9 | ||
Unionist hold | Swing | +4.3 |
Party | Candidate | Votes | % | ±% | |
---|---|---|---|---|---|
Liberal | Courtenay Mansel | 17,015 | 62.0 | +23.2 | |
Unionist | Denis Shipwright | 10,429 | 38.0 | −4.7 | |
Majority | 6,586 | 24.0 | N/A | ||
Turnout | 27,444 | 73.0 | +0.5 | ||
Liberal gain from Unionist | Swing | +17.0 |
Party | Candidate | Votes | % | ±% | |
---|---|---|---|---|---|
Unionist | George Pilcher | 12,485 | 43.3 | +5.3 | |
Liberal | Courtenay Mansel | 9,913 | 34.3 | −27.7 | |
Labour | Frederick Jesse Hopkins | 6,462 | 22.4 | New | |
Majority | 2,572 | 9.0 | N/A | ||
Turnout | 22,398 | 74.7 | +1.7 | ||
Unionist gain from Liberal | Swing | +16.5 |
Party | Candidate | Votes | % | ±% | |
---|---|---|---|---|---|
Liberal | Tudor Walters | 14,274 | 37.0 | +2.7 | |
Unionist | Maurice Petherick | 13,136 | 34.1 | −9.2 | |
Labour | Frederick Jesse Hopkins | 11,166 | 28.9 | +6.5 | |
Majority | 1,138 | 2.9 | N/A | ||
Turnout | 38,576 | 78.4 | +3.7 | ||
Liberal gain from Unionist | Swing | +6.0 |
Party | Candidate | Votes | % | ±% | |
---|---|---|---|---|---|
Conservative | Maurice Petherick | 16,388 | 40.5 | +6.4 | |
Liberal | Ernest Simon | 14,006 | 34.6 | −2.4 | |
Labour | A.L.Rowse | 10,098 | 24.9 | −4.0 | |
Majority | 2,382 | 5.9 | N/A | ||
Turnout | 40,492 | 79.8 | +1.4 | ||
Conservative gain from Liberal | Swing | +4.4 |
Party | Candidate | Votes | % | ±% | |
---|---|---|---|---|---|
Conservative | Maurice Petherick | 16,136 | 39.6 | −0.9 | |
Labour | A.L.Rowse | 13,105 | 32.1 | +7.2 | |
Liberal | Ronald Wilberforce Allen | 11,527 | 28.3 | −6.3 | |
Majority | 3,031 | 7.5 | +1.6 | ||
Turnout | 40,778 | 77.6 | −2.2 | ||
Conservative hold | Swing | -4.0 |
A General election was due to take place before the end of 1940, but was postponed due to the Second World War. By 1939, the following candidates had been selected to contest this constituency;
Party | Candidate | Votes | % | ±% | |
---|---|---|---|---|---|
Labour | Evelyn King | 17,962 | 43.8 | +11.7 | |
Conservative | Maurice Petherick | 15,169 | 36.9 | −2.7 | |
Liberal | Percy Harris | 7,917 | 19.3 | −9.0 | |
Majority | 2,793 | 6.9 | N/A | ||
Turnout | 41,048 | 73.0 | −4.6 | ||
Labour gain from Conservative | Swing |
Blackburn is a constituency in Lancashire, England, which is represented in the House of Commons of the UK Parliament by independent politician Adnan Hussain. From 2015 to 2024 it was represented by Kate Hollern of the Labour Party and, from 1979 to 2015, by Jack Straw who served under the Labour leaders of Neil Kinnock and John Smith and the Labour governments of Tony Blair and Gordon Brown.
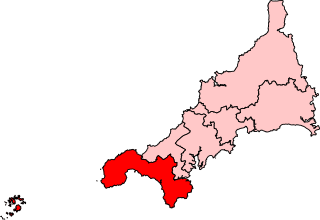
St Ives is a parliamentary constituency covering the western end of Cornwall and the Isles of Scilly. The constituency has been represented in the House of Commons of the UK Parliament since 2024 by Andrew George, a Lib Dem MP; George previously represented the constituency from 1997 to 2015.
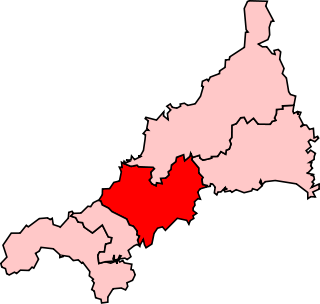
Truro was the name of a parliamentary constituency in Cornwall represented in the House of Commons of England and later of Great Britain from 1295 until 1800, then in the Parliament of the United Kingdom from 1801 to 1918 and finally from 1950 to 1997. Until 1885 it was a parliamentary borough, electing two members of parliament (MPs) by the plurality-at-large system of election; the name was then transferred to the surrounding county constituency, which elected a single Member by the first past the post system. In 1997, although there had been no changes to its boundaries, it was renamed as Truro and St Austell, reflecting the fact that St Austell by then had a larger population than Truro.
The parliamentary borough of Finsbury was a constituency of the House of Commons of the UK Parliament from 1832 to 1885, and from 1918 to 1950. The constituency was first created in 1832 as one of seven two-seat "metropolis" parliamentary boroughs other than the two which already existed: Westminster and the City of London; the latter until 1885 retained an exceptional four seats. Finsbury was directly north of the City of London and was smaller than the Finsbury division of the Ossulstone hundred but took in land of Holborn division to its southwest in pre-introduction changes by Boundary Commissioners. It included Finsbury, Holborn, Moorfields, Clerkenwell, Islington, Stoke Newington and historic St Pancras. The 1918 constituency corresponded to the smaller Metropolitan Borough of Finsbury ; it was a seat, thus electing a single member, fulfilling a longstanding aim of Chartism which underscored the 1832 reforms.
Frome was a constituency centred on the town of Frome in Somerset. It returned one Member of Parliament (MP) to the House of Commons of the Parliament of the United Kingdom from 1832, until it was abolished for the 1950 general election. Between 1832 and 1885, it was a parliamentary borough; after 1885 it was a county constituency, a division of Somerset.
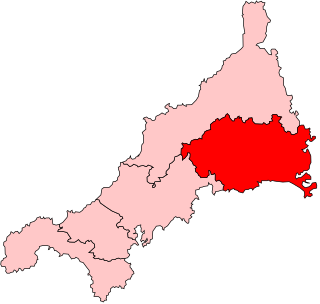
Bodmin was the name of a parliamentary constituency in Cornwall from 1295 until 1983. Initially, it was a parliamentary borough, which returned two Members of Parliament to the House of Commons of England and later the House of Commons of the Parliament of the United Kingdom until the 1868 general election, when its representation was reduced to one member.
Clitheroe was a parliamentary constituency in Lancashire.
Hertford was the name of a parliamentary constituency in Hertfordshire, which elected Members of Parliament (MPs) from 1298 until 1974.
Tavistock was the name of a parliamentary constituency in Devon between 1330 and 1974. Until 1885 it was a parliamentary borough, consisting solely of the town of Tavistock; it returned two Members of Parliament to the House of Commons of the Parliament of the United Kingdom until 1868, when its representation was reduced to one member. From 1885, the name was transferred to a single-member county constituency covering a much larger area.
Bury was a borough constituency centred on the town of Bury in Lancashire. It returned one Member of Parliament (MP) to the House of Commons of the Parliament of the United Kingdom.
Helston, sometimes known as Helleston, was a parliamentary borough centred on the small town of Helston in Cornwall.
East Cornwall was a county constituency in the House of Commons of the Parliament of the United Kingdom. It elected two Members of Parliament (MPs) by the bloc vote system of election.
West Cornwall was a county constituency in the House of Commons of the Parliament of the United Kingdom. It elected two Members of Parliament (MPs) by the bloc vote system of election.
Tower Hamlets was a parliamentary borough (constituency) in Middlesex, England from 1832 to 1885. It elected two Members of Parliament (MPs) to the House of Commons of the Parliament of the United Kingdom. It was one of the first five of its type in the metropolitan area of London. It was enfranchised by the Reform Act 1832.
Marylebone was a parliamentary constituency in Middlesex, England from 1832 to 1885. The parliamentary borough formed part of the built up area of London, and returned two members to the House of Commons of the UK Parliament and was created under the Reform Act 1832. It was abolished by the Redistribution of Seats Act, 1885 which split it into 8 seats.
Launceston, also known at some periods as Dunheved, was a parliamentary constituency in Cornwall which returned two Members of Parliament to the British House of Commons from 1295 until 1832, and one member from 1832 until 1918. It was a parliamentary borough until 1885, and a county constituency thereafter.
Liskeard was a parliamentary borough in Cornwall, which elected two Members of Parliament (MPs) to the House of Commons from 1295 until 1832, and then one member from 1832 until 1885. The constituency was abolished by the Redistribution of Seats Act 1885.
Malmesbury was a parliamentary borough in Wiltshire, which elected two Members of Parliament (MPs) to the House of Commons from 1275 until 1832, and then one member from 1832 until 1885, when the borough was abolished.
Stoke-upon-Trent was a parliamentary borough in Staffordshire, which elected two Members of Parliament (MPs) to the House of Commons from 1832 until 1885, and then one member from 1885 until 1918, when the borough was enlarged, renamed Stoke-on-Trent, and split into three single-member constituencies.
Truro and St Austell was a county constituency in Cornwall represented in the House of Commons of the UK Parliament from its 1997 creation to its 2010 abolition by Matthew Taylor of the Liberal Democrats, who was appointed a life peer in the House of Lords following his service as a Member of Parliament (MP). The constituency elected one MP by the first past the post system of election.