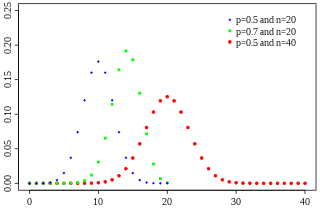
In probability theory and statistics, the binomial distribution with parameters n and p is the discrete probability distribution of the number of successes in a sequence of n independent experiments, each asking a yes–no question, and each with its own boolean-valued outcome: success/yes/true/one or failure/no/false/zero. A single success/failure experiment is also called a Bernoulli trial or Bernoulli experiment and a sequence of outcomes is called a Bernoulli process; for a single trial, i.e., n = 1, the binomial distribution is a Bernoulli distribution. The binomial distribution is the basis for the popular binomial test of statistical significance.

In probability theory, a normaldistribution is a type of continuous probability distribution for a real-valued random variable. The general form of its probability density function is
In probability theory and statistics, a probability distribution is a mathematical function that provides the probabilities of occurrence of different possible outcomes in an experiment. In more technical terms, the probability distribution is a description of a random phenomenon in terms of the probabilities of events. For instance, if the random variable X is used to denote the outcome of a coin toss, then the probability distribution of X would take the value 0.5 for X = heads, and 0.5 for X = tails. Examples of random phenomena can include the results of an experiment or survey.
In probability theory, the central limit theorem (CLT) establishes that, in some situations, when independent random variables are added, their properly normalized sum tends toward a normal distribution even if the original variables themselves are not normally distributed. The theorem is a key concept in probability theory because it implies that probabilistic and statistical methods that work for normal distributions can be applicable to many problems involving other types of distributions.

In probability theory and statistics, the negative binomial distribution is a discrete probability distribution that models the number of failures in a sequence of independent and identically distributed Bernoulli trials before a specified (non-random) number of successes occurs. For example, we can define rolling a 6 on a die as a success, and rolling any other number as a failure, and ask how many failed rolls will occur before we see the third success. In such a case, the probability distribution of the number of non-6s that appear will be a negative binomial distribution.
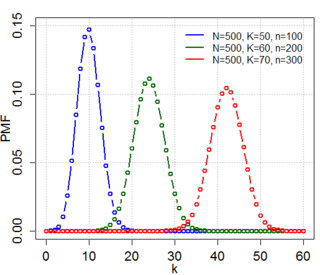
In probability theory and statistics, the hypergeometric distribution is a discrete probability distribution that describes the probability of successes in draws, without replacement, from a finite population of size that contains exactly objects with that feature, wherein each draw is either a success or a failure. In contrast, the binomial distribution describes the probability of successes in draws with replacement.
In numerical analysis and computational statistics, rejection sampling is a basic technique used to generate observations from a distribution. It is also commonly called the acceptance-rejection method or "accept-reject algorithm" and is a type of exact simulation method. The method works for any distribution in with a density.

In probability theory and statistics, the triangular distribution is a continuous probability distribution with lower limit a, upper limit b and mode c, where a < b and a ≤ c ≤ b.

In statistics, the generalized linear model (GLM) is a flexible generalization of ordinary linear regression that allows for response variables that have error distribution models other than a normal distribution. The GLM generalizes linear regression by allowing the linear model to be related to the response variable via a link function and by allowing the magnitude of the variance of each measurement to be a function of its predicted value.
In Bayesian probability theory, if the posterior distributions p(θ | x) are in the same probability distribution family as the prior probability distribution p(θ), the prior and posterior are then called conjugate distributions, and the prior is called a conjugate prior for the likelihood function. For example, the Gaussian family is conjugate to itself with respect to a Gaussian likelihood function: if the likelihood function is Gaussian, choosing a Gaussian prior over the mean will ensure that the posterior distribution is also Gaussian. This means that the Gaussian distribution is a conjugate prior for the likelihood that is also Gaussian. The concept, as well as the term "conjugate prior", were introduced by Howard Raiffa and Robert Schlaifer in their work on Bayesian decision theory. A similar concept had been discovered independently by George Alfred Barnard.
In mathematics, unimodality means possessing a unique mode. More generally, unimodality means there is only a single highest value, somehow defined, of some mathematical object.

In probability theory and statistics, the continuous uniform distribution or rectangular distribution is a family of symmetric probability distributions. The distribution describes an experiment where there is an arbitrary outcome that lies between certain bounds. The bounds are defined by the parameters, a and b, which are the minimum and maximum values. The interval can be either closed or open. Therefore, the distribution is often abbreviated U, where U stands for uniform distribution. The difference between the bounds defines the interval length; all intervals of the same length on the distribution's support are equally probable. It is the maximum entropy probability distribution for a random variable X under no constraint other than that it is contained in the distribution's support.

In probability theory and statistics, the characteristic function of any real-valued random variable completely defines its probability distribution. If a random variable admits a probability density function, then the characteristic function is the Fourier transform of the probability density function. Thus it provides the basis of an alternative route to analytical results compared with working directly with probability density functions or cumulative distribution functions. There are particularly simple results for the characteristic functions of distributions defined by the weighted sums of random variables.

In probability and statistics, the Irwin–Hall distribution, named after Joseph Oscar Irwin and Philip Hall, is a probability distribution for a random variable defined as the sum of a number of independent random variables, each having a uniform distribution. For this reason it is also known as the uniform sum distribution.
The generalized normal distribution or generalized Gaussian distribution (GGD) is either of two families of parametric continuous probability distributions on the real line. Both families add a shape parameter to the normal distribution. To distinguish the two families, they are referred to below as "version 1" and "version 2". However this is not a standard nomenclature.

In probability theory and statistics, the Poisson distribution, named after French mathematician Siméon Denis Poisson, is a discrete probability distribution that expresses the probability of a given number of events occurring in a fixed interval of time or space if these events occur with a known constant mean rate and independently of the time since the last event. The Poisson distribution can also be used for the number of events in other specified intervals such as distance, area or volume.
In mathematical physics and probability and statistics, the Gaussian q-distribution is a family of probability distributions that includes, as limiting cases, the uniform distribution and the normal (Gaussian) distribution. It was introduced by Diaz and Teruel, is a q-analogue of the Gaussian or normal distribution.

In probability and statistics, the Bates distribution, named after Grace Bates, is a probability distribution of the mean of a number of statistically independent uniformly distributed random variables on the unit interval. This distribution is sometimes confused with the Irwin–Hall distribution, which is the distribution of the sum of n independent random variables uniformly distributed from 0 to 1. Thus, the two distributions are simply versions of each other as they only differ in scale.
In probability, statistics and related fields, a Poisson point process is a type of random mathematical object that consists of points randomly located on a mathematical space. The Poisson point process is often called simply the Poisson process, but it is also called a Poisson random measure, Poisson random point field or Poisson point field. This point process has convenient mathematical properties, which has led to it being frequently defined in Euclidean space and used as a mathematical model for seemingly random processes in numerous disciplines such as astronomy, biology, ecology, geology, seismology, physics, economics, image processing, and telecommunications.


