| |||||||||||||||||||||||||||||||||
All 60 seats to Waltham Forest London Borough Council 31 seats needed for a majority | |||||||||||||||||||||||||||||||||
| |||||||||||||||||||||||||||||||||
Map of the results of the 2010 Waltham Forest council election. Conservatives in blue, Labour in red and Liberal Democrats in yellow. | |||||||||||||||||||||||||||||||||
|
Elections for London Borough of Waltham Forest were held on 6 May 2010. The 2010 General Election and other local elections took place on the same day.
The London Borough of Waltham Forest is a London borough in northeast London, England.
In London council elections the entire council is elected every four years, opposed to some local elections where one councillor is elected every year for three of the four years.
All locally registered electors (British, Irish, Commonwealth and European Union citizens) who were aged 18 or over on Thursday 6 May 2010 were entitled to vote in the local elections. Those who were temporarily away from their ordinary address (for example, away working, on holiday, in student accommodation or in hospital) were also entitled to vote in the local elections, [1] although those who had moved abroad and registered as overseas electors cannot vote in the local elections. It is possible to register to vote at more than one address (such as a university student who had a term-time address and lives at home during holidays) at the discretion of the local Electoral Register Office, but it remains an offence to vote more than once in the same local government election. [2]
In general, a Commonwealth citizen is a citizen of a member state of the Commonwealth of Nations. This designation is given legal effect in the nationality laws of some Commonwealth countries, and Commonwealth citizens may enjoy some privileges in the United Kingdom and, less commonly, other member states. Each Commonwealth country determines what special rights, if any, are accorded to citizens of other Commonwealth countries. The status is most significant in British law and has little effect in many other Commonwealth countries, such as Canada.
The European Union (EU) is a political and economic union of 28 member states that are located primarily in Europe. It has an area of 4,475,757 km2 (1,728,099 sq mi) and an estimated population of about 513 million. The EU has developed an internal single market through a standardised system of laws that apply in all member states in those matters, and only those matters, where members have agreed to act as one. EU policies aim to ensure the free movement of people, goods, services and capital within the internal market, enact legislation in justice and home affairs and maintain common policies on trade, agriculture, fisheries and regional development. For travel within the Schengen Area, passport controls have been abolished. A monetary union was established in 1999 and came into full force in 2002 and is composed of 19 EU member states which use the euro currency.
The pattern of local government in England is complex, with the distribution of functions varying according to the local arrangements.
Elected in 2006 | Before election | ||||
---|---|---|---|---|---|
Party | Seats | Party | Seats | ||
Labour | 26 | Labour | 25 | ||
Liberal Democrat | 19 | Liberal Democrat | 20 | ||
Conservative | 15 | Conservative | 15 |
Party | Seats | Gains | Losses | Net gain/loss | Seats % | Votes % | Votes | +/− | |
---|---|---|---|---|---|---|---|---|---|
Labour | 36 | 9 | 0 | +9 | 60.0 | 38.9 | 109,998 | ||
Liberal Democrat | 6 | 0 | 14 | -14 | 10.0 | 30.1 | 85,036 | ||
Conservative | 18 | 3 | 0 | +3 | 30.0 | 24.9 | 70,400 | ||
Green | 0 | 0 | 0 | 4.3 | 12,133 | ||||
Independent | 0 | 0 | 0 | 1.4 | 3,963 | ||||
UKIP | 0 | 0 | 0 | 0.2 | 551 | ||||
TUSC | 0 | 0 | 0 | 0.2 | 332 | ||||
Christian Peoples | 0 | 0 | 0 | 0.1 | 278 |
The ward results listed below are based on the changes from the 2006 elections, not taking into account any mid-term by-elections or party defections.
The wards and electoral divisions in the United Kingdom are electoral districts at sub-national level represented by one or more councillors. The ward is the primary unit of English electoral geography for civil parishes and borough and district councils, electoral ward is the unit used by Welsh principal councils, while the electoral division is the unit used by English county councils and some unitary authorities. Each ward/division has an average electorate of about 5,500 people, but ward-population counts can vary substantially. As at the end of 2014 there were 9,456 electoral wards/divisions in the UK.
Party | Candidate | Votes | % | ||
---|---|---|---|---|---|
Labour | Tunde Davies | 2,103 | |||
Labour | Nicholas Russell | 1,986 | |||
Liberal Democrat | Liz Phillips | 1,986 | |||
Liberal Democrat | Keith Rayner | 1,829 | |||
Labour | Faiz Yunis | 1,784 | |||
Liberal Democrat | Adrian Trett | 1,493 | |||
Conservative | Bill de Gouveia | 509 | |||
Conservative | Letrois Bernard | 492 | |||
Conservative | David Hemsted | 447 | |||
Green | Pat Howie | 420 | |||
Turnout | 55.2% | ||||
Labour gain from Liberal Democrat | |||||
Liberal Democrat hold | |||||
Party | Candidate | Votes | % | ||
---|---|---|---|---|---|
Labour | Naheed Asghar | 2,087 | |||
Labour | Shameem Highfield | 1,885 | |||
Labour | Terry Wheeler | 1,848 | |||
Liberal Democrat | Joe Dyer | 1,439 | |||
Liberal Democrat | Milton Martin | 1,435 | |||
Liberal Democrat | Shahid Majid | 1,316 | |||
Conservative | Anne Pryor | 466 | |||
Conservative | Derek Pryor | 404 | |||
Conservative | Jean Savage | 377 | |||
Green | Anne Warrington | 320 | |||
Turnout | 51.1% | ||||
Labour hold | |||||
Labour hold | |||||
Labour hold | |||||
Party | Candidate | Votes | % | ||
---|---|---|---|---|---|
Labour | Paul Douglas | 2,180 | |||
Labour | Kieran Falconer | 1,995 | |||
Labour | Abu Samih | 1,823 | |||
Liberal Democrat | Matt Lake | 1,343 | |||
Liberal Democrat | Saeed Diwan | 1,294 | |||
Liberal Democrat | Andrew Morrell | 1,229 | |||
Conservative | Millie Balkan | 904 | |||
Independent | Bob Belam | 844 | |||
Conservative | Owen Evans | 820 | |||
Conservative | Anne Hexter | 772 | |||
Independent | Bob Carey | 667 | |||
Independent | John Macklin | 569 | |||
Green | Susan Wheat | 536 | |||
UKIP | Bob Brock | 296 | |||
Turnout | 60.1% | ||||
Labour gain from Liberal Democrat | |||||
Party | Candidate | Votes | % | ||
---|---|---|---|---|---|
Conservative | Thom Goddard | 3,152 | |||
Conservative | Michael Lewis | 3,112 | |||
Conservative | Andrew Hemsted | 3,083 | |||
Liberal Democrat | Joan Carder | 985 | |||
Labour | Noel Hayes | 964 | |||
Liberal Democrat | Ian Paterson | 964 | |||
Liberal Democrat | Keith Wenden | 932 | |||
Labour | Elizabeth Lee | 917 | |||
Labour | Frances Manjra | 760 | |||
Turnout | 68.0% | ||||
Conservative hold | |||||
Party | Candidate | Votes | % | ||
---|---|---|---|---|---|
Conservative | Roy Berg | 3,002 | |||
Conservative | Peter Herrington | 2,741 | |||
Conservative | Matthew Davis | 2,686 | |||
Labour | William Bayliss | 976 | |||
Independent | Trevor Calver | 869 | |||
Labour | Kenneth Kennedy | 861 | |||
Labour | Sheila Dore | 859 | |||
Liberal Democrat | Violet Wells | 679 | |||
Liberal Democrat | Kathleen Mudie | 665 | |||
Liberal Democrat | Edward Carder | 644 | |||
Green | Joan Allen | 461 | |||
Independent | Dawn Bishop | 234 | |||
Turnout | 67.0% | ||||
Conservative hold | |||||
Party | Candidate | Votes | % | ||
---|---|---|---|---|---|
Labour | Gerry Lyons | 2,070 | |||
Liberal Democrat | Farooq Qureshi | 1,914 | |||
Labour | Shabana Qadir | 1,875 | |||
Labour | Mumtaz Zafar | 1,710 | |||
Liberal Democrat | Samina Safdar | 1,497 | |||
Liberal Democrat | Haroon Munir | 1,436 | |||
Conservative | Julien Foster | 755 | |||
Conservative | David Bromiley | 674 | |||
Green | Rosalind Bedlow | 658 | |||
Conservative | Gulsum Aytac | 565 | |||
Independent | Martin Duncan-Jones | 298 | |||
Christian Peoples | Jean Farmer | 278 | |||
Turnout | 59.0% | ||||
Labour hold | |||||
Liberal Democrat hold | |||||
Labour gain from Liberal Democrat | |||||
Party | Candidate | Votes | % | ||
---|---|---|---|---|---|
Labour | Chris Robbins | 2,342 | |||
Labour | Anna Mbachu | 2,271 | |||
Labour | Khevyn Limbajee | 2,178 | |||
Liberal Democrat | Neal Chubb | 1,681 | |||
Liberal Democrat | Abbas Yousaf | 1,639 | |||
Liberal Democrat | Paul Olford | 1,563 | |||
Conservative | Pervaiz Khan | 608 | |||
Conservative | Michelle Sweetman | 599 | |||
Conservative | Ben Smith | 594 | |||
Green | Bill Measure | 429 | |||
Green | Maureen Measure | 383 | |||
Turnout | 54.4% | ||||
Labour hold | |||||
Labour hold | |||||
Labour hold | |||||
Party | Candidate | Votes | % | ||
---|---|---|---|---|---|
Conservative | Sheree Rackham | 2,064 | |||
Conservative | Paul Braham | 2,026 | |||
Conservative | Darshan Singh Sunger | 1,904 | |||
Liberal Democrat | Sheila Smith-Pryor | 1,825 | |||
Liberal Democrat | Nick Bason | 1,814 | |||
Liberal Democrat | Jane Morgan | 1,796 | |||
Labour | Martin Dore | 1,401 | |||
Labour | Richard James | 1,287 | |||
Labour | Neil Weekes | 1,225 | |||
Turnout | 67.0% | ||||
Conservative gain from Liberal Democrat | |||||
Party | Candidate | Votes | % | ||
---|---|---|---|---|---|
Conservative | Marion Fitzgerald | 2,743 | |||
Conservative | Laurie Braham | 2,500 | |||
Conservative | Geoffrey Walker | 2,481 | |||
Labour | David Blunt | 1,312 | |||
Liberal Democrat | Marc Jones | 1,115 | |||
Liberal Democrat | Jeremy Dauncey | 1,055 | |||
Labour | Ali Murtaza | 977 | |||
Labour | Shaheen Rafique | 934 | |||
Liberal Democrat | Clyde Kitson | 819 | |||
Green | Robert Tatam | 569 | |||
Turnout | 63.0% | ||||
Conservative hold | |||||
Party | Candidate | Votes | % | ||
---|---|---|---|---|---|
Labour | Liaquat Ali | 2,325 | |||
Labour | Clare Coghill | 2,180 | |||
Liberal Democrat | Mahmood Hussain | 2,045 | |||
Labour | Steve Terry | 1,932 | |||
Liberal Democrat | Johar Khan | 1,923 | |||
Liberal Democrat | James O'Rourke | 1,712 | |||
Green | Anna Lindstrom | 774 | |||
Conservative | Shaun Hexter | 507 | |||
Conservative | Rachel Wedderburn | 506 | |||
Conservative | Mike Vero | 488 | |||
Green | Kuan Phillips | 478 | |||
Independent | Aurangzaib Sharif | 157 | |||
Independent | Michael Gold | 110 | |||
Turnout | 58.7% | ||||
Labour hold | |||||
Labour gain from Liberal Democrat | |||||
Liberal Democrat hold | |||||
Party | Candidate | Votes | % | ||
---|---|---|---|---|---|
Labour | Karen Bellamy | 2,124 | |||
Labour | Geoff Hammond | 1,914 | |||
Labour | Haroon Khan | 1,849 | |||
Liberal Democrat | Sean Meiszner | 1,810 | |||
Liberal Democrat | Peter Woollcott | 1,677 | |||
Liberal Democrat | Patrick Smith | 1,647 | |||
Conservative | Kathy Berg | 648 | |||
Conservative | Pamela Jovcic | 550 | |||
Conservative | Sheila Vero | 503 | |||
Green | Oliver Parsons | 377 | |||
UKIP | Judith Chisholm | 255 | |||
TUSC | Uthayasenan Thanabala Singam | 104 | |||
Turnout | 56.5% | ||||
Labour gain from Liberal Democrat | |||||
Party | Candidate | Votes | % | ||
---|---|---|---|---|---|
Labour | Ahsan Khan | 2,265 | |||
Labour | Saima Mahmud | 2,098 | |||
Labour | Mark Rusling | 2,096 | |||
Liberal Democrat | Farooq Arif | 1,542 | |||
Liberal Democrat | Najm Anwar | 1,425 | |||
Green | Stephen Lambert | 1,015 | |||
Green | Elen Miles | 915 | |||
Liberal Democrat | Naseem Saleemi | 913 | |||
Green | Daniel Perrett | 816 | |||
Conservative | Dominic Gover | 701 | |||
Conservative | Roger Hemsted | 699 | |||
Conservative | Susan Herrington | 681 | |||
Turnout | 58.9% | ||||
Labour hold | |||||
Labour hold | |||||
Labour hold | |||||
Party | Candidate | Votes | % | ||
---|---|---|---|---|---|
Conservative | Nicholas Buckmaster | 2,777 | |||
Conservative | Bernadette Mill | 2,720 | |||
Conservative | Edwin Northover | 2,498 | |||
Labour | Anne Garrett | 1,427 | |||
Labour | Sivakumar Chelliah | 1,224 | |||
Labour | Johanna Rashid | 1,148 | |||
Liberal Democrat | Graham Woolnough | 891 | |||
Liberal Democrat | Gerry McGarry | 817 | |||
Liberal Democrat | Khalid Sharif | 668 | |||
Turnout | 62.0% | ||||
Conservative hold | |||||
Party | Candidate | Votes | % | ||
---|---|---|---|---|---|
Labour | Masood Ahmad | 2,891 | |||
Labour | Afzal Akram | 2,850 | |||
Labour | Elisabeth Davies | 2,730 | |||
Liberal Democrat | Katy Andrews | 1,810 | |||
Liberal Democrat | Eren Aslan | 1,435 | |||
Green | David Hamilton | 711 | |||
Conservative | Abdul Mahroof | 661 | |||
Liberal Democrat | Yousaff Khan | 618 | |||
Independent | Mian Zahid | 215 | |||
Turnout | 53.1% | ||||
Labour hold | |||||
Labour hold | |||||
Labour hold | |||||
Party | Candidate | Votes | % | ||
---|---|---|---|---|---|
Liberal Democrat | Naheed Qureshi | 2,190 | |||
Liberal Democrat | Winnie Smith | 2,104 | |||
Liberal Democrat | Bob Sullivan | 2,095 | |||
Labour | Patrick Edwards | 1,996 | |||
Labour | Simon Miller | 1,967 | |||
Labour | Matthew Garness | 1,954 | |||
Green | Diana Wellings | 618 | |||
Conservative | Christopher Nott | 446 | |||
Conservative | Mollie Neilson-Hansen | 436 | |||
Conservative | Carol Chatfield | 123 | |||
Turnout | 54.6% | ||||
Liberal Democrat hold | |||||
Liberal Democrat gain from Labour | |||||
Party | Candidate | Votes | % | ||
---|---|---|---|---|---|
Labour | Jenny Gray | 2,338 | |||
Labour | Clyde Loakes | 2,298 | |||
Labour | Marie Pye | 2,246 | |||
Liberal Democrat | Anthony Ashworth | 1,519 | |||
Liberal Democrat | Faiz Faiz | 1,473 | |||
Liberal Democrat | John Howard | 1,428 | |||
Conservative | David Atherton | 867 | |||
Conservative | Helen Johnson | 844 | |||
Green | Mark Dawes | 708 | |||
Conservative | John Moss | 704 | |||
Turnout | 58.4% | ||||
Labour hold | |||||
Labour hold | |||||
Labour hold | |||||
Party | Candidate | Votes | % | ||
---|---|---|---|---|---|
Labour | Mohammad Asghar | 2,309 | |||
Labour | Asim Mahmood | 2,286 | |||
Labour | Ebony Vincent | 2,108 | |||
Liberal Democrat | Javed Azam | 1,749 | |||
Liberal Democrat | Doreen Ingleton | 1,515 | |||
Liberal Democrat | Osman Saleemi | 1,143 | |||
Conservative | Zahood Ahmed | 665 | |||
Green | Maria Paterlini-Phillips | 658 | |||
Conservative | Michael Bamber | 607 | |||
Conservative | Ayhan Kizil | 446 | |||
Turnout | 56.7% | ||||
Labour hold | |||||
Labour hold | |||||
Labour hold | |||||
Party | Candidate | Votes | % | ||
---|---|---|---|---|---|
Conservative | Jemma Hemsted | 2,060 | |||
Conservative | Alan Siggers | 2,020 | |||
Conservative | Laurance Wedderburn | 1,967 | |||
Liberal Democrat | Grace Chambers | 1,334 | |||
Liberal Democrat | Aktar Beg | 1,309 | |||
Liberal Democrat | Peter Woodrow | 1,265 | |||
Labour | Henry Boyle | 703 | |||
Labour | Afzal Malik | 669 | |||
Labour | Cynthia Wenden | 662 | |||
Turnout | 62.0% | ||||
Conservative hold | |||||
Party | Candidate | Votes | % | ||
---|---|---|---|---|---|
Labour | Geraldine Reardon | 2,467 | |||
Labour | Nadeem Ali | 2,387 | |||
Labour | Raja Anwar | 2,300 | |||
Liberal Democrat | Bob Wheatley | 1,714 | |||
Liberal Democrat | Tulat Raja | 1,543 | |||
Liberal Democrat | Samantha Syrus | 1,487 | |||
Green | Alison Walker | 713 | |||
Conservative | Shane Clapham | 596 | |||
Conservative | David Mears | 592 | |||
Conservative | Mladen Jovcic | 508 | |||
TUSC | Susan Wills | 228 | |||
Turnout | 60.5% | ||||
Labour hold | |||||
Labour hold | |||||
Labour gain from Liberal Democrat | |||||
Party | Candidate | Votes | % | ||
---|---|---|---|---|---|
Labour | Angie Bean | 2,740 | |||
Labour | Peter Barnett | 2,612 | |||
Labour | Richard Sweden | 2,293 | |||
Liberal Democrat | Andrew Hudson | 1,488 | |||
Liberal Democrat | Azhar Kayani | 1,244 | |||
Liberal Democrat | Dil Pazeer | 1,116 | |||
Conservative | Elliott Burton | 1,103 | |||
Conservative | Tim James | 1,010 | |||
Conservative | Sandeep Christian | 987 | |||
Green | Christine Olende | 574 | |||
Turnout | 61.5% | ||||
Labour hold | |||||
Labour hold | |||||
Labour hold | |||||
A whole-council election to Lancashire County Council took place on 4 June 2009 as part of the 2009 United Kingdom local elections. The United Kingdom government department Department for Communities and Local Government consulted on the issue of moving the elections to the same date as the 2009 European Parliament election, which resulted in the council elections being postponed to June to coincide. 84 councillors were elected for 84 divisions by first-past-the-post' for a four-year term of office. Wards were the same as those at the previous election in 2005. Elections are held in all electoral divisions across the present ceremonial county, excepting Blackpool, and Blackburn with Darwen which are unitary authorities in a similar way to Greater Manchester and most of Merseyside.
An election to Hertfordshire County Council took place on 4 June 2009 the date of the United Kingdom local elections, 2009. The whole elected council was up for election. The councillors were elected from the 77 wards, which return one each by first-past-the-post voting for a four-year term of office. The wards were the same as those used at the previous election in 2005.
The East Sussex County Council election, 2009 took place on 4 June 2009 as part of the United Kingdom local elections, 2009, having been delayed from 7 May, to coincide with elections to the European Parliament. All 49 seats of this council were up for election. The councillors were elected from 44 electoral divisions, which accordingly return one or two by first-past-the-post voting, for a four-year term of office.
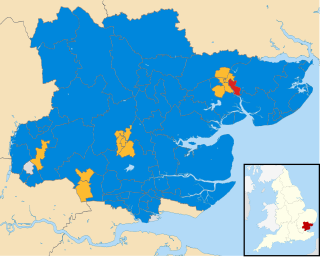
An election to Essex County Council took place on 4 June 2009 as part of the United Kingdom local elections, 2009. The elections had been delayed from 7 May, to coincide with elections to the European Parliament. 75 councillors were elected from various electoral divisions, which returned either one or two county councillors each by first-past-the-post voting for a four-year term of office. The electoral divisions were the same as those used at the previous election in 2005.
Elections to Lincolnshire County Council took place on 4 June 2009 as part of the United Kingdom local elections, 2009, having been delayed from 7 May, in order to coincide with elections to the European Parliament. 77 councillors were elected, each electoral division returned either one or two county councillors by first-past-the-post voting for a four-year term of office. The electoral divisions were the same as those used at the previous election in 2005.
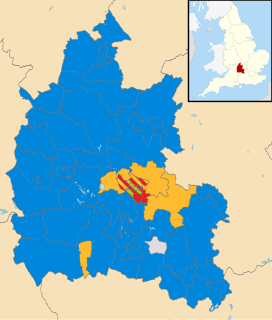
An election to Oxfordshire County Council took place on 4 June 2009 as part of the United Kingdom local elections, 2009, having been delayed from 7 May, to coincide with elections to the European Parliament. 73 councillors were elected from various electoral divisions, which returned either one, two or three county councillors each by first-past-the-post voting for a four-year term of office. The electoral divisions were the same as those used at the previous election in 2005.
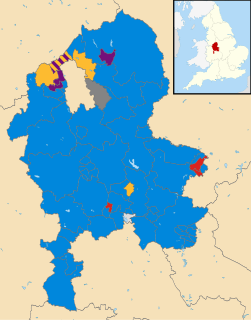
Elections to Staffordshire County Council took place on 4 June 2009 as part of the United Kingdom local elections, 2009, having been delayed from 7 May, in order to coincide with elections to the European Parliament. 62 councillors were elected from the various electoral divisions, which returned either one or two county councillors each by first-past-the-post voting for a four-year term of office. The electoral divisions were the same as those used at the previous election in 2005. The council continues to be administered on the Leader and Cabinet model.
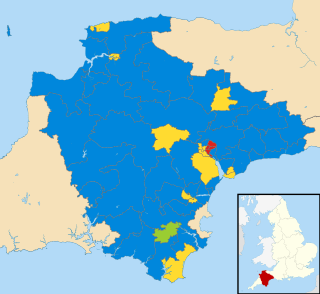
An election to Devon County Council took place on 7 May 2009 as part of the United Kingdom local elections, 2009. The elections had been delayed from 7 May, to coincide with elections to the European Parliament. 62 councillors were elected from various electoral divisions, which returned either one or two county councillors each by first-past-the-post voting for a four-year term of office. The electoral divisions were the same as those used at the previous election in 2009. No elections were held in Plymouth and Torbay, which are unitary authorities outside the area covered by the County Council.
The Waltham Forest Council elections, were held on 4 May 2006 in Waltham Forest, England. The whole council was up for election for the first time since the 2002 election.
The 2012 City of Lincoln Council election took place on 3 May 2012 to elect one-third of the members of City of Lincoln Council in Lincolnshire, England, for a 4-year term of office. This was on the same day as other United Kingdom local elections, 2012.
An election to Lancashire County Council took place on 2 May 2013 as part of the United Kingdom local elections, 2013. 84 councillors were elected from single-member electoral divisions by first-past-the-post for a four-year term of office. Electoral divisions were the same as those at the previous election in 2009. Elections were held in all electoral divisions across the present ceremonial county, excepting Blackpool and Blackburn with Darwen which are unitary authorities in a similar way to Greater Manchester and most of Merseyside. The election saw the Conservative Party lose overall control of the council, instead overtaken in number of seats by the Labour Party, without any absolute majority.
An election to North Yorkshire County Council took place on 2 May 2013 as part of the United Kingdom local elections, 2013. 72 councillors were elected from 68 electoral divisions, which returned either one or two county councillors each by first-past-the-post voting for a four-year term of office. The four divisions which elected two members were Harrogate Bilton & Nidd Gorge, Harrogate Central, Knaresborough, and Selby Barlby. The electoral divisions were the same as those used at the previous election in 2009. The election saw the Conservative Party maintain overall control of the council.
An election to Worcestershire County Council took place on 2 May 2013 as part of the United Kingdom local elections, 2013. 57 councillors were elected from 53 electoral divisions, which returned either one or two county councillors each by first-past-the-post voting for a four-year term of office. The divisions were the same as those used at the previous election in 2009. The election saw the Conservative Party retain overall control of the council with a significantly reduced majority of just 2 seats.
An election to Essex County Council took place on 2 May 2013 as part of the United Kingdom local elections, 2013. 75 councillors were elected from 70 electoral divisions, which returned either one or two county councillors each by first-past-the-post voting for a four-year term of office. The electoral divisions were the same as those used at the previous election in 2009. No elections were held in Thurrock or Southend-on-Sea, which are unitary authorities outside the area covered by the County Council.
Elections to Suffolk County Council took place on 2 May 2013 as part of the United Kingdom local elections, 2013. 75 councillors were elected from 63 electoral divisions, which returned either one or two county councillors each by first-past-the-post voting for a four-year term of office. The electoral divisions were the same as those used at the previous election in 2009.
Council elections for the City of Preston, Lancashire were held on 22 May 2014 as part of the 2014 United Kingdom local elections. The elections have been moved from earlier on in May to coincide with the North West component of the 2014 European Parliament election. Nineteen electoral wards were fought with those councillors elected in the corresponding elections in 2010 defending their seats due to the "in thirds" system employed in Preston local elections. The previous elections to Preston council occurred in 2012 but due to the "in thirds" system employed by Preston council, councillors are elected for four-year terms. This means gains, losses, and vote share comparisons this year are with those fought in 2010.
Elections to Harrogate Borough Council were held on 22 May 2014. A third of the council was up for election, with voting only in the urban wards of Harrogate, Knaresborough and Ripon. The elections were held on the same day as the British local elections and the European Parliament elections. Each ward up for election returned a councillor for a four-year term of office.
The 2014 Waltham Forest Council election took place on 22 May 2014 to elect members of Waltham Forest Council in England. This was on the same day as other local elections.
An election to Derbyshire County Council took place on 4 May 2017 as part of the United Kingdom local elections, 2017. 64 councillors were elected from 61 electoral divisions which returned either one or two county councillors each by first-past-the-post voting for a four-year term of office. No elections were held in the City of Derby, which is a unitary authority outside the area covered by the County Council. The Conservative Party won back control of the council, taking thirty-seven of the authority's sixty-four seats.
The 2017 Gloucestershire County Council election took place on 4 May 2017 as part of the 2017 local elections in the United Kingdom. All 53 councillors were elected from electoral divisions which returned one county councillor each by first-past-the-post voting for a four-year term of office. Control of the council went from a Conservative Party minority to a majority administration.