Last election in South Africa under apartheid
1989 South African general election Registered 3,120,104 Turnout 69.48% ( Turnout 18.14% ( This lists parties that won seats. See the complete results below.
Turnout 23.29% ( This lists parties that won seats. See the complete results below.
Results by House of Assembly constituency
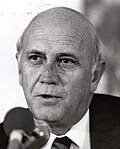
General elections were held in South Africa on 6 September 1989, the last under apartheid . Snap elections had been called early (no election was required until 1992) by the recently elected head of the National Party (NP), F. W. de Klerk , who was in the process of replacing P. W. Botha as the country's president, and his expected program of reform to include further retreat from the policy of apartheid. The creation of the Conservative Party had realigned the NP as a moderate party, now almost certain to initiate negotiations with the black opposition, with liberal opposition (the PFP) openly seeking a new constitutional settlement on liberal democratic and federalist principles.
Although the National Party won a comfortable majority of seats (94 of 166) in the House of Assembly , the governing party suffered a setback and received only 48% of the popular vote, the first elections since 1961 in which the NP failed to win a majority of the vote. However, the first-past-the-post system, and a severely fractured opposition as well as the twelve appointed and indirectly elected members entrenched the NP's majority, allowing it to comfortably remain in power.
The Conservative Party (CP), which opposed any form of power-sharing with other races, failed to accomplish a breakthrough beyond its conservative Afrikaner backing as some had expected, but remained the official opposition with 39 seats. By some estimates, the party had received the backing of a slim majority of Afrikaners particularly in the Orange Free State , once the NP's heartland, but with very limited support among English-speaking voters. [ 1]
Before the elections, the liberal Progressive Federal Party (PFP) had dissolved itself and regrouped as the Democratic Party (DP), winning 33 seats, six seats short of retaking its position as the official opposition. In terms of vote share, it fell a quarter million votes behind the CP, but was favoured by its stronghold in the Cape Province and Natal .
The White Chamber of Parliament had 178 members, 166 of whom were directly elected (including a seat from Walvis Bay annexed from South West Africa , which was added in 1981) with 8 members indirectly elected by the directly elected members on the basis of proportional representation and four nominated by the State President (one from each province). [ 2]
The results of the election were interpreted by the government (based on support for the NP and the DP together) as a mandate from the white electorate to reform the apartheid system and seek a compromise with the African National Congress and its leader Nelson Mandela . Mandela was released half a year later, and the 1989 elections were the last under the limited, whites-only franchise and the Tricameral Parliament introduced in 1984.
Of the twelve appointed and indirectly-elected seats, nine were taken by the National Party, two by the Conservative Party and one by the Democratic Party. [ 3]
Two seats won by the Democratic Party were uncontested, while the National and Conservative parties were tied in the Orange Free State division of Fauresmith. A five-month court battle followed after the Free State Supreme Court ordered a recount, which eventually resulted in a majority of five votes for the National Party candidate. [ 4]
Party Votes % Seats +/– National Party 1,039,704 48.19 94 −29 Conservative Party 680,131 31.52 39 +17 Democratic Party 431,444 20.00 33 +13 Herstigte Nasionale Party 5,416 0.25 0 0 Independents 898 0.04 0 –1 Presidential appointees 4 0 Indirectly-elected members 8 0 Total 2,157,593 100.00 178 0 Valid votes 2,157,593 99.52 Invalid/blank votes 10,336 0.48 Total votes 2,167,929 100.00 Registered voters/turnout 3,120,104 69.48 Source: [ 5] [ 6]
Cape Province Constituency Region 1987 1989 winning party Turnout Votes Party Votes Share Majority NP DP CP HNP Independents Total Albany East NP DP 6,060 52.6% 687 69.3% 5,373 6,060 11,510 Algoa East NP NP 7,094 62.7% 3,101 62.1% 7,094 3,993 11,315 Aliwal East NP NP 4,419 62.5% 1,840 71.4% 4,419 2,579 7,066 Beaufort West West NP NP 4,086 57.1% 1,067 80.2% 4,086 3,019 7,155 Bellville West NP NP 6,607 66.8% 4,666 65.1% 6,607 1,326 1,941 9,896 Caledon West NP NP 7,211 72.3% 4,605 71.1% 7,211 2,606 9,978 Cape Town Gardens West PFP DP 5,975 63.0% 2,520 57.4% 3,455 5,975 9,484 Ceres West NP NP 5,390 64.7% 2,519 77.3% 5,390 2,871 8,335 Claremont West PFP DP 8,078 77.3% 5,720 61.9% 2,358 8,078 10,455 Constantia West PFP DP 10,132 73.3% 6,478 67.3% 3,654 10,132 13,832 Cradock East NP NP 4,251 50.5% 1,359 81.2% 4,251 1,254 2,892 8,415 De Aar North NP NP 4,402 53.1% 579 82.9% 4,402 3,823 8,292 De Kuilen West NP NP 9,997 66.6% 7,204 71.2% 9,997 2,187 2,793 15,009 Durbanville West NP NP 11,597 57.0% 3,060 75.9% 11,597 8,537 20,334 East London City East NP NP 4,807 52.1% 446 57.0% 4,807 4,361 9,233 East London North East NP NP 5,556 46.7% 500 65.7% 5,556 5,056 1,256 11,903 False Bay West NP NP 7,856 68.1% 5,931 66.4% 7,856 1,726 1,925 11,538 George West NP NP 7,781 52.5% 3,967 73.4% 7,781 3,179 3,814 14,813 Gordonia West NP NP 4,569 56.8% 1,119 76.8% 4,569 3,450 8,041 Graaff-Reinet East NP NP 3,991 52.3% 1,381 80.4% 3,991 1,022 2,610 7,637 Green Point West PFP DP 4,814 61.3% 1,823 55.0% 2,991 4,814 7,852 Groote Schuur West PFP DP 6,285 75.1% 4,246 56.5% 2,039 6,285 8,374 Helderberg West NP NP 10,540 55.0% 2,048 77.4% 10,540 8,492 19,173 Humansdorp East NP NP 6,327 48.3% 2,261 73.6% 6,327 2,704 4,066 13,112 Kimberley North North NP NP 5,525 57.3% 1,560 70.2% 5,525 3,965 9,644 Kimberley South North NP NP 6,541 61.1% 2,658 70.1% 6,541 3,883 123 10,706 King William's Town East NP NP 6,207 51.3% 401 65.8% 6,207 5,806 12,089 Kuruman North NP CP 4,566 52.5% 435 84.6% 4,131 4,566 8,702 Maitland West NP NP 6,154 54.1% 1,405 57.0% 6,154 4,749 441 11,374 Malmesbury West NP NP 9,099 71.1% 5,615 62.0% 9,099 3,484 12,792 Mossel Bay West NP NP 7,327 61.3% 2,805 78.6% 7,327 4,522 11,945 Namaqualand North NP NP 4,263 56.1% 959 76.4% 4,263 3,304 7,596 Newton Park East NP NP 7,197 57.0% 1,897 68.5% 7,197 5,300 12,628 Oudtshoorn West NP NP 5,673 54.8% 1,039 80.0% 5,673 4,634 10,349 Paarl West NP NP 7,059 61.7% 4,456 71.7% 7,059 1,748 2,603 11,441 Parow West NP NP 7,362 83.3% 6,039 54.7% 7,362 1,323 8,842 Piketberg West NP NP 7,935 70.3% 4,991 78.0% 7,935 398 2,944 11,294 Pinelands West PFP DP 8,174 71.8% 5,021 71.3% 3,153 8,174 11,380 Port Elizabeth Central East PFP DP 5,505 59.7% 1,870 62.6% 3,635 5,505 9,228 Port Elizabeth North East NP NP 5,117 65.7% 2,705 50.2% 5,117 2,412 119 7,792 Prieska North NP NP 3,695 58.6% 1,150 78.5% 3,695 2,545 6,303 Queenstown East NP NP 4,014 43.3% 1,108 75.2% 4,014 2,906 2,302 9,278 Sea Point West PFP DP 8,879 79.0% 6,561 64.1% 2,318 8,879 11,237 Simonstown West NP DP 9,282 60.7% 3,362 69.3% 5,920 9,282 15,280 Stellenbosch West NP NP 5,772 61.2% 2,215 68.2% 5,772 3,557 9,435 Sundays River East NP NP 5,778 55.6% 1,217 76.0% 5,778 4,561 10,383 Swellendam West NP NP 5,724 57.5% 2,681 78.3% 5,724 1,154 3,043 9,947 Tygervallei West NP NP 6,274 70.2% 4,260 50.7% 6,274 2,014 579 8,932 Uitenhage East NP CP 6,217 50.2% 126 76.0% 6,091 6,217 12,377 Vasco West NP NP 6,544 70.6% 3,899 56.3% 6,544 2,645 9,271 Vryburg North NP NP 4,261 54.0% 659 81.5% 4,261 3,602 7,892 Walmer East NP DP 6,798 53.1% 891 70.4% 5,907 6,798 12,798 Walvis Bay West NP NP 1,868 65.6% 912 57.2% 1,868 956 2,846 Wellington West NP NP 8,164 62.9% 4,743 63.6% 8,164 1,370 3,421 12,976 Worcester West NP NP 6,679 59.8% 3,409 73.4% 6,679 1,193 3,270 11,170 Wynberg West NP DP 7,253 63.0% 3,024 66.5% 4,229 7,253 11,515 Total for all constituencies Turnout NP DP CP HNP Independents Total Votes 68.6% 315,967 164,687 106,427 1,262 0 592,194 53.4% 27.8% 17.9% 0.2% 0% 100.0% Seats 42 12 2 0 0 56 75% 21.4% 3.6% 0% 0% 100.0%
Natal Constituency 1987 1989 winning party Turnout Votes Party Votes Share Majority NP DP CP HNP Independents Total Amanzimtoti NP NP 6,630 49.0% 1,722 67.3% 6,630 4,908 1,968 13,526 Berea PFP DP 7,779 68.2% 4,279 66.1% 3,500 7,779 11,403 Durban Central PFP DP 6,326 63.4% 2,739 58.8% 3,587 6,326 9,978 Durban North PFP DP 8,376 64.7% 3,854 68.2% 4,522 8,376 12,955 Durban Point NP NP 4,102 47.0% 694 51.3% 4,102 3,408 1,177 8,725 Greytown PFP DP 8,235 51.4% 1,808 71.3% 6,427 8,235 1,318 16,010 Klip River NP NP 5,053 47.8% 1,916 70.0% 5,053 2,355 3,137 10,580 Mooi River NRP DP 6,612 54.0% 2,300 70.1% 4,312 6,612 1,256 12,253 Newcastle NP NP 6,054 50.8% 961 68.2% 6,054 750 5,093 11,909 Pietermaritzburg North NP DP 6,252 48.3% 620 68.8% 5,632 6,252 1,021 12,936 Pietermaritzburg South NP DP 7,332 48.8% 764 69.9% 6,568 7,332 1,057 15,037 Pinetown PFP DP 8,957 61.7% 3,703 67.7% 5,254 8,957 241 14,519 Port Natal NP NP 5,620 49.6% 2,247 61.0% 5,620 3,373 2,310 11,336 South Coast NP NP 6,095 50.2% 1,525 71.9% 6,095 4,570 1,451 12,144 Umbilo NP DP 4,783 48.1% 725 59.3% 4,058 4,783 1,080 9,949 Umfolozi NP NP 5,010 42.3% 907 66.7% 5,010 2,437 4,103 11,564 Umhlanga NP DP 6,626 51.5% 1,406 70.1% 5,220 6,626 1,012 12,873 Umhlatuzana NP NP 7,459 56.7% 1,881 60.1% 7,459 5,578 13,159 Umlazi NP NP 6,149 51.6% 2,835 61.2% 6,149 3,314 2,429 11,919 Vryheid NP NP 5,825 50.4% 1,434 72.6% 5,825 1,072 4,391 256 11,558 Total for all constituencies Turnout NP DP CP HNP Independents Total Votes 66.2% 107,077 103,043 32,803 256 241 244,343 43.8% 42.2% 13.4% 0.1% 0.1% 100.0% Seats 10 10 0 0 0 20 50% 50% 0% 5% 0% 100.0%
Orange Free State Constituency 1987 1989 winning party Turnout Votes Party Votes Share Majority NP CP DP HNP Total Bethlehem NP NP 6,373 48.2% 401 81.3% 6,373 5,972 716 159 13,232 Bloemfontein East NP NP 8,515 57.0% 2,148 72.2% 8,515 6,367 14,951 Bloemfontein North NP NP 6,476 56.3% 3,204 68.7% 6,476 3,272 1,732 11,508 Bloemfontein West NP NP 7,371 60.8% 2,696 72.1% 7,371 4,675 12,125 Fauresmith NP NP [ b] 4,519 49.2% 0 86.7% 4,519 4,519 120 9,185 Heilbron NP CP 5,896 49.5% 124 81.2% 5,772 5,896 231 11,922 Kroonstad NP NP 6,706 54.9% 1,294 76.4% 6,706 5,412 12,211 Ladybrand NP CP 5,805 48.2% 70 86.3% 5,735 5,805 471 12,041 Parys NP CP 7,736 54.9% 1,413 82.2% 6,323 7,736 14,100 Sasolburg NP CP 7,361 49.9% 22 71.7% 7,339 7,361 14,747 Smithfield NP CP 5,080 50.0% 105 77.3% 4,975 5,080 10,151 Virginia NP NP 6,911 47.4% 47 70.6% 6,911 6,864 680 88 14,587 Welkom NP CP 9,312 49.8% 856 71.8% 8,456 9,312 791 112 18,687 Winburg NP NP 7,538 54.0% 1,218 81.0% 7,538 6,320 13,947 Total for all constituencies Turnout Total NP CP DP HNP Votes 76.6% 86,533 84,591 5,453 966 183,394 47.2% 46.1% 3.0% 0.5% 100.0% Seats 8 6 0 0 14 57.1% 42.9% 0% 0% 100.0%
Transvaal Constituency Region 1987 1989 winning party Turnout Votes Party Votes Share Majority NP CP DP HNP Independents Total Alberton PWV NP NP 7,161 47.8% 753 67.3% 7,161 6,408 1,325 14,982 Barberton East CP CP 7,708 54.6% 1,381 78.0% 6,327 7,708 14,109 Benoni PWV NP NP 5,957 44.5% 2,752 66.0% 5,957 3,205 4,212 13,394 Bethal East CP CP 12,383 56.4% 3,066 71.2% 9,317 12,383 210 21,967 Bezuidenhout PWV NP DP 5,618 46.6% 356 56.6% 5,262 976 5,618 162 12,063 Boksburg PWV NP NP 8,043 50.0% 2,390 69.4% 8,043 5,653 2,260 111 16,093 Brakpan PWV CP CP 7,543 50.4% 891 68.9% 6,652 7,543 729 14,969 Brentwood PWV NP NP 8,997 48.1% 2,374 71.9% 8,997 6,623 3,016 18,691 Brits West CP CP 8,831 60.1% 3,032 77.6% 5,799 8,831 14,687 Bryanston PWV PFP DP 10,947 71.5% 6,642 67.8% 4,305 10,947 15,320 Carletonville PWV CP CP 7,918 53.0% 955 70.1% 6,963 7,918 14,940 Delmas East CP CP 8,956 51.0% 581 75.2% 8,375 8,956 17,553 Edenvale PWV NP DP 9,358 59.4% 3,551 70.0% 5,807 9,358 451 3,551 Ermelo East CP CP 7,695 53.6% 1,074 77.9% 6,621 7,695 14,363 Florida PWV NP NP 7,566 51.0% 3,882 73.2% 7,566 3,529 3,684 14,826 Geduld PWV NP NP 8,285 45.9% 377 72.7% 8,285 7,908 1,826 18,046 Germiston PWV NP NP 6,198 47.5% 1,315 63.8% 6,198 4,883 1,953 13,054 Germiston District PWV NP NP 7,000 46.0% 926 64.3% 7,000 6,074 2,088 15,207 Gezina PWV NP NP 6,421 49.4% 7 65.8% 6,421 6,414 13,010 Helderkruin PWV NP NP 12,113 50.8% 5,748 74.0% 12,113 5,302 6,365 23,832 Hercules PWV NP CP 9,379 59.8% 3,538 68.1% 5,841 9,379 371 44 15,673 Hillbrow PWV PFP DP 3,971 49.7% 1,054 44.3% 2,917 1,079 3,971 7,997 Houghton PWV PFP DP 10,003 72.7% 6,301 66.1% 3,702 10,003 13,752 Innesdal PWV NP NP 8,250 53.8% 1,509 76.8% 8,250 6,741 255 15,344 Jeppe PWV NP NP 4,593 54.2% 1,922 40.6% 4,593 2,671 1,189 8,480 Johannesburg North PWV PFP DP 9,511 73.9% 6,205 67.4% 3,306 9,511 12,874 Johannesburg West PWV NP NP 4,247 42.1% 1,328 55.5% 4,247 2,919 2,870 10,088 Kempton Park PWV NP NP 7,461 52.0% 2,196 67.3% 7,461 5,265 1,601 14,351 Klerksdorp West NP NP 10,440 48.7% 495 72.3% 10,440 9,945 1,008 21,443 Koedoespoort PWV NP NP 7,477 46.9% 271 73.9% 7,477 7,206 1,200 15,958 Krugersdorp PWV NP NP 8,188 52.8% 949 69.3% 8,188 7,239 15,518 Langlaagte PWV NP NP 6,580 56.6% 1,701 59.3% 6,580 4,879 11,618 Lichtenburg West CP CP 7,906 62.4% 3,195 79.1% 4,711 7,906 12,663 Losberg PWV CP CP 8,342 54.0% 1,302 66.7% 7,040 8,342 15,459 Lydenburg East NP CP 6,753 50.9% 870 78.4% 5,883 6,753 332 165 13,266 Maraisburg PWV NP CP 5,340 50.0% 214 52.3% 5,126 5,340 71 10,679 Meyerton PWV NP CP 9,069 44.7% 7 70.6% 9,062 9,069 2,112 20,285 Middelburg East CP CP 10,472 57.8% 3,688 74.7% 6,784 10,472 609 230 18,113 Modderfontein PWV NP NP 10,269 50.4% 4,159 68.4% 10,269 6,110 3,972 20,392 Nelspruit East NP NP 7,417 46.8% 496 73.9% 7,417 6,921 1,472 15,833 Nigel PWV CP CP 9,466 52.7% 1,207 75.3% 8,259 9,466 193 17,969 North Rand PWV NP DP 13,542 42.6% 2,305 72.9% 11,237 6,901 13,542 31,820 Overvaal PWV CP CP 8,589 54.2% 1,426 65.4% 7,163 8,589 15,849 Parktown PWV PFP DP 8,804 75.1% 6,004 65.1% 2,800 8,804 11,730 Pietersburg North CP CP 9,174 53.8% 1,356 74.8% 9,174 7,818 17,061 Potchefstroom West NP NP 8,684 54.8% 1,583 76.3% 8,684 7,101 15,846 Potgietersrus North CP CP 9,090 60.0% 3,141 80.8% 5,949 9,090 15,146 Pretoria Central PWV NP NP 5,916 54.7% 1,969 57.3% 5,916 3,947 776 140 10,819 Pretoria East PWV NP NP 17,237 55.0% 10,099 80.6% 17,237 7,138 6,875 31,341 Pretoria West PWV NP CP 8,085 57.1% 2,149 59.2% 5,936 8,085 14,148 Primrose PWV NP NP 7,253 54.8% 1,359 68.4% 7,253 5,894 13,244 Randburg PWV Ind DP 8,481 52.9% 1,714 74.1% 6,767 755 8,481 16,038 Randfontein PWV CP CP 9,060 59.3% 2,902 58.8% 6,158 9,060 15,278 Rissik PWV NP NP 6,778 52.6% 3,533 69.0% 6,778 3,245 2,817 12,893 Roodeplaat PWV NP CP 9,983 50.9% 565 74.7% 9,418 9,983 19,629 Roodepoort PWV CP CP 7,724 52.3% 796 66.1% 6,928 7,724 14,759 Rosettenville PWV NP NP 6,195 55.9% 3,282 58.4% 6,195 2,913 1,945 11,083 Rustenburg West NP CP 8,921 53.8% 1,502 68.9% 7,419 8,921 183 16,591 Sandton PWV PFP DP 100% Unopposed Schweizer-Reneke West CP CP 7,146 57.4% 1,892 83.8% 5,254 7,146 12,459 Soutpansberg North CP CP 8,130 51.4% 530 84.3% 7,600 8,130 15,807 Springs PWV NP NP 6,622 49.0% 1,241 68.8% 6,622 5,381 1,473 13,507 Standerton East CP CP 9,081 56.9% 2,249 74.1% 6,832 9,081 15,970 Stilfontein West NP CP 5,865 59.6% 1,926 67.3% 3,939 5,865 9,840 Sunnyside PWV NP NP 6,374 51.6% 3,073 67.4% 6,374 3,301 2,623 12,341 Turffontein PWV NP NP 7,957 49.9% 3,958 63.4% 7,957 3,999 3,961 15,939 Vanderbijlpark PWV NP NP 10,295 59.2% 3,246 67.7% 10,295 7,049 17,401 Ventersdorp West CP CP 7,488 57.2% 2,106 77.4% 5,382 7,488 152 13,083 Vereeniging PWV NP NP 7,199 47.1% 5 70.4% 7,199 7,194 863 15,292 Verwoerdburg PWV NP NP 12,085 56.4% 5,524 79.4% 12,085 6,561 2,753 21,445 Waterberg North CP CP 8,746 60.2% 3,990 77.4% 4,756 8,746 1,015 14,530 Waterkloof PWV NP NP 8,220 48.8% 2,307 82.8% 8,220 2,667 5,913 16,837 Westdene PWV NP NP 6,974 49.7% 2,647 70.5% 6,974 2,691 4,327 14,020 Witbank East CP CP 9,596 53.1% 2,091 69.0% 7,505 9,596 949 18,083 Wonderboom PWV NP CP 11,703 51.4% 905 75.6% 10,798 11,703 212 22,760 Yeoville PWV PFP DP 100% Unopposed Total for all constituencies Turnout NP CP DP HNP Independents Total Votes 67.9% 528,170 460,829 159,333 3,308 657 1,157,193 45.6% 39.8% 13.8% 0.3% 0.1% 100.0% Seats 34 31 11 0 0 76 44.7% 40.8% 14.5% 0% 0% 100.0%
This page is based on this
Wikipedia article Text is available under the
CC BY-SA 4.0 license; additional terms may apply.
Images, videos and audio are available under their respective licenses.