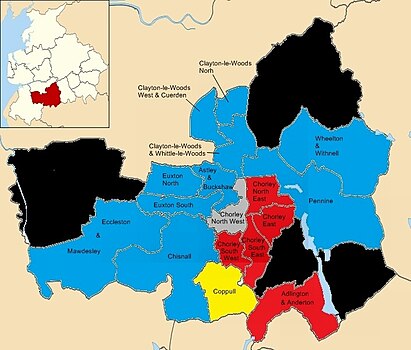
Elections to Chorley Borough Council were held on 4 May 2006. One third of the council was up for election and the Conservative party gained overall control of the council from no overall control.
The Conservative Party, officially the Conservative and Unionist Party, is a centre-right political party in the United Kingdom. Presently led by Theresa May, it has been the governing party since 2010. It presently has 314 Members of Parliament in the House of Commons, 249 members of the House of Lords, and 18 members of the European Parliament. It also has 31 Members of the Scottish Parliament, 12 members of the Welsh Assembly, eight members of the London Assembly and 9,008 local councillors. One of the major parties of UK politics, it has formed the government on 45 occasions, more than any other party.
After the election, the composition of the council was:
Party | Seats | ± | |
---|---|---|---|
Conservative | 25 | +5 | |
Labour | 17 | −4 | |
Independent | 3 | 0 | |
Liberal Democrat | 2 | −1 |
Party | Seats | Gains | Losses | Net gain/loss | Seats % | Votes % | Votes | +/− | |
---|---|---|---|---|---|---|---|---|---|
Conservative | 11 | 5 | 0 | +5 | 61.1 | 45.0 | 12,037 | +9.0 | |
Labour | 5 | 0 | 4 | −4 | 27.8 | 35.7 | 9,555 | +1.7 | |
Liberal Democrat | 1 | 0 | 1 | −1 | 5.6 | 9.5 | 2,552 | −8.6 | |
Independent | 1 | 0 | 0 | 0 | 5.6 | 8.7 | 2,312 | −3.2 | |
New Party | 0 | 0 | 0 | 0 | 0 | 1.0 | 272 | +1.0 | |
One Labour councillor was unopposed.
Party | Candidate | Votes | % | ± | |
---|---|---|---|---|---|
Labour | 1,264 | 57.1 | +13.3 | ||
Conservative | Paul Barron | 700 | 31.6 | −7.9 | |
Liberal Democrat | Philip William Pilling | 249 | 11.3 | −5.5 | |
Majority | 564 | 25.5 | +21.2 | ||
Turnout | 2,213 | 39.5 | |||
Labour hold | Swing | ||||
Party | Candidate | Votes | % | ± | |
---|---|---|---|---|---|
Conservative | 832 | 66.4 | +8.2 | ||
Labour | Laura Jane Lennox | 421 | 33.6 | +1.6 | |
Majority | 411 | 32.8 | +6.6 | ||
Turnout | 1,253 | 45.5 | |||
Conservative gain from Labour | Swing | ||||
Party | Candidate | Votes | % | ± | |
---|---|---|---|---|---|
Conservative | 701 | 55.7 | +19.9 | ||
Liberal Democrat | Nora Theresa Ball | 319 | 25.4 | +9.1 | |
Labour | David Christopher Lloyd | 238 | 18.9 | −11.7 | |
Majority | 382 | 30.3 | +25.1 | ||
Turnout | 1,258 | 39.0 | |||
Conservative hold | Swing | ||||
Party | Candidate | Votes | % | ± | |
---|---|---|---|---|---|
Labour | 798 | 56.9 | +5.0 | ||
Conservative | Simon Parkinson | 605 | 43.1 | +20.9 | |
Majority | 193 | 13.8 | −15.9 | ||
Turnout | 1,403 | 29.2 | |||
Labour hold | Swing | ||||
Party | Candidate | Votes | % | ± | |
---|---|---|---|---|---|
Labour | 816 | 51.8 | +10.5 | ||
Conservative | Marlene Ann Bedford | 486 | 30.9 | +2.9 | |
New Party | Colin Denby | 272 | 17.3 | +17.3 | |
Majority | 330 | 20.9 | +10.3 | ||
Turnout | 1,574 | 31.5 | |||
Labour hold | Swing | ||||
Party | Candidate | Votes | % | ± | |
---|---|---|---|---|---|
Independent | 2,312 | 85.3 | +8.3 | ||
Labour | Alistair Ward Bradley | 203 | 7.5 | +7.5 | |
Conservative | Kirk Houghton | 197 | 7.3 | −5.3 | |
Majority | 2,109 | 77.8 | +13.4 | ||
Turnout | 2,712 | 54.5 | |||
Independent hold | Swing | ||||
Party | Candidate | Votes | % | ± | |
---|---|---|---|---|---|
Labour | 625 | 42.9 | −2.2 | ||
Conservative | Barbara Higham | 612 | 42.0 | +7.3 | |
Liberal Democrat | David Porter | 219 | 15.0 | −5.2 | |
Majority | 13 | 0.9 | −9.5 | ||
Turnout | 1,456 | 31.4 | |||
Labour hold | Swing | ||||
Party | Candidate | Votes | % | ± | |
---|---|---|---|---|---|
Labour | unopposed | ||||
Labour hold | Swing | ||||
Party | Candidate | Votes | % | ± | |
---|---|---|---|---|---|
Conservative | 1,268 | 64.8 | +13.4 | ||
Labour | David Edwin Rogerson | 362 | 18.5 | −4.5 | |
Liberal Democrat | Glenda Charlesworth | 327 | 16.7 | −8.9 | |
Majority | 941 | 46.3 | +20.5 | ||
Turnout | 1,957 | 36.7 | |||
Conservative hold | Swing | ||||
Party | Candidate | Votes | % | ± | |
---|---|---|---|---|---|
Conservative | 713 | ||||
Conservative | 661 | ||||
Labour | Karen Teresa Martyniuk | 561 | |||
Labour | Edward Anthony Murphy | 484 | |||
Liberal Democrat | Andrew Peter Philip Buckley | 420 | |||
Turnout | 2,839 | 30.0 | |||
Conservative gain from Liberal Democrat | Swing | ||||
Conservative hold | Swing | ||||
Party | Candidate | Votes | % | ± | |
---|---|---|---|---|---|
Conservative | 793 | 60.1 | +18.1 | ||
Labour | James Freeman | 526 | 39.9 | +2.2 | |
Majority | 267 | 20.2 | +15.9 | ||
Turnout | 1,319 | 38.1 | |||
Conservative gain from Labour | Swing | ||||
Party | Candidate | Votes | % | ± | |
---|---|---|---|---|---|
Liberal Democrat | 907 | 54.4 | +6.0 | ||
Labour | Susan Elizabeth Millar | 521 | 31.2 | −8.2 | |
Conservative | Stephen William Royce | 240 | 14.4 | +2.2 | |
Majority | 386 | 23.2 | +14.2 | ||
Turnout | 1,668 | 33.4 | |||
Liberal Democrat hold | Swing | ||||
Party | Candidate | Votes | % | ± | |
---|---|---|---|---|---|
Conservative | 1,176 | 54.1 | +0.3 | ||
Labour | Alan Whittaker | 998 | 45.9 | −0.3 | |
Majority | 178 | 8.2 | +0.6 | ||
Turnout | 2,174 | 45.6 | |||
Conservative gain from Labour | Swing | +0.3 | |||
Party | Candidate | Votes | % | ± | |
---|---|---|---|---|---|
Conservative | 833 | 53.7 | +0.4 | ||
Labour | Thomas Gray | 718 | 46.3 | −0.4 | |
Majority | 115 | 7.4 | +0.8 | ||
Turnout | 1,551 | 43.5 | |||
Conservative gain from Labour | Swing | +0.4 | |||
Party | Candidate | Votes | % | ± | |
---|---|---|---|---|---|
Conservative | 836 | 67.6 | +10.4 | ||
Labour | Helen Margaret Bradley | 401 | 32.4 | −10.4 | |
Majority | 435 | 35.2 | +20.8 | ||
Turnout | 1,237 | 38.2 | |||
Conservative hold | Swing | ||||
Party | Candidate | Votes | % | ± | |
---|---|---|---|---|---|
Conservative | 498 | 65.2 | +10.2 | ||
Labour | Hollie Louise Berry | 155 | 20.3 | +5.1 | |
Liberal Democrat | Janet Ross-Mills | 111 | 14.5 | −15.3 | |
Majority | 343 | 44.9 | +19.7 | ||
Turnout | 764 | 43.5 | |||
Conservative hold | Swing | ||||
Party | Candidate | Votes | % | ± | |
---|---|---|---|---|---|
Conservative | 886 | 65.6 | +18.5 | ||
Labour | Christopher Howard | 464 | 34.4 | +2.2 | |
Majority | 422 | 31.2 | +16.3 | ||
Turnout | 1,350 | 41.6 | |||
Conservative hold | Swing | ||||
One third of Chorley Borough Council is elected each year, followed by one year without election.
Elections to Chorley Borough Council were held on 7 May 1998. One third of the council was up for election and the Labour party kept overall control of the council.
Elections to Chorley Borough Council were held on 6 May 1999. One third of the council was up for election and the Labour party kept overall control of the council.
Elections to Chorley Borough Council were held on 4 May 2000. One third of the council was up for election and the Labour party lost overall control of the council to no overall control.
Elections to Chorley Borough Council were held on 2 May 2002. The whole council was up for election with boundary changes since the last election in 2000 reducing the number of seats by one. The council stayed under no overall control.
Elections to Chorley Borough Council were held on 1 May 2003. One third of the council was up for election and the council stayed under no overall control.
Elections to Chorley Borough Council were held on 10 June 2004. One third of the council was up for election and the council stayed under no overall control.
Elections to Wigan Council were held on 4 May 2006. One-third of the council was up for election and the Labour party kept overall control of the council. Overall turnout was 29.2%.
The 2003 South Lakeland District Council election took place on 1 May 2003 to elect members of South Lakeland District Council in Cumbria, England. One third of the council was up for election and the council stayed under no overall control.
Elections to Barrow-in-Furness Borough Council were held on 4 May 2006. One third of the council was up for election and the Labour party lost overall control of the council to no overall control.
2006 elections to Redditch Borough Council were held on 4 May 2006. One third of the council was up for election and the Labour party lost overall control of the council to no overall control.
Elections to Mole Valley Council were held on 4 May 2006. One third of the council was up for election and the Conservative party gained overall control of the council from no overall control. Overall turnout was 49.0%.
Elections to Chorley Borough Council were held on 3 May 2007. One third of the council was up for election and the Conservative party retained overall control.
The Chorley Borough Council elections took place on 1 May 2008. One third of the council was up for election.
Elections to West Lindsey District Council were held on 4 May 2006. One third of the council was up for election and the Conservative party lost overall control of the council to no overall control. The Liberal Democrat party took overall control of the council two weeks later after a by-election victory in Lea ward.
The 2006 Thurrock Council election took place on 4 May 2006 to elect members of Thurrock Council in Essex, England. One third of the council was up for election and the Conservative party stayed in overall control of the council.
Elections to Chorley Borough Council were held on 6 May 2010. One third of the council was up for election and the Conservative party held overall control.
Elections to Chorley Borough Council were held on 5 May 2011. One third of the council was up for election and the Conservative party lost overall control to NOC.
Elections to Chorley Borough Council were held on 3 May 2012. One third of the council was up for election and the Labour party won majority control from the Conservative-Liberal Democrat Coalition. Labour gaining control of this council was notable as David Cameron visited the town in 2006 when the Conservative Party gained control saying "this is the beginning." Nick Robinson of the BBC asked on the election coverage, "then what is it now?"
The 2014 Chorley Borough Council election took place on 22 May 2014 to elect members of Chorley Borough Council in England. This was on the same day as other local elections. One third of the council was up for election and the Labour party held control.