The economy of the Republic of the Congo is a mixture of subsistence hunting and agriculture, an industrial sector based largely on petroleum extraction and support services. Government spending is characterized by budget problems and overstaffing. Petroleum has supplanted forestry as the mainstay of the economy, providing a major share of government revenues and exports. Nowadays the Republic of the Congo is increasingly converting natural gas to electricity rather than burning it, greatly improving energy prospects.

Government spending or expenditure includes all government consumption, investment, and transfer payments. In national income accounting, the acquisition by governments of goods and services for current use, to directly satisfy the individual or collective needs of the community, is classed as government final consumption expenditure. Government acquisition of goods and services intended to create future benefits, such as infrastructure investment or research spending, is classed as government investment. These two types of government spending, on final consumption and on gross capital formation, together constitute one of the major components of gross domestic product.

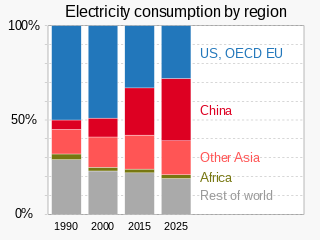
Electric energy consumption is energy consumption in the form of electrical energy. About a fifth of global energy is consumed as electricity: for residential, industrial, commercial, transportation and other purposes. The global electricity consumption in 2022 was 24,398 terawatt-hour (TWh), almost exactly three times the amount of consumption in 1981. China, the United States, and India accounted for more than half of the global share of electricity consumption. Japan and Russia followed with nearly twice the consumption of the remaining industrialized countries.

Energy in the United States is obtained from a diverse portfolio of sources, although the majority came from fossil fuels in 2021, as 36% of the nation's energy originated from petroleum, 32% from natural gas, and 11% from coal. Electricity from nuclear power supplied 8% and renewable energy supplied 12%, which includes biomass, wind, hydro, solar and geothermal.

The economy of Ivory Coast is stable and currently growing, in the aftermath of political instability in recent decades. The Ivory Coast's economy is largely market-based and depends heavily on the agricultural sector. Almost 70% of the Ivorian people are engaged in some form of agricultural activity. The economy grew 82% in the 1960s, reaching a peak growth of 360% in the 1970s, but this proved unsustainable and it shrank by 28% in the 1980s and a further 22% in the 1990s. This decline, coupled with high population growth, resulted in a steady fall in living standards. The gross national product per capita, now rising again, was about US$727 in 1996. It was substantially higher two decades before. Real GDP growth is expected to average 6.5% in 2024–25.
This is a list of European countries by percentage of urban population. The three most urban countries as of 2018 are Monaco, Belgium (98%), and San Marino (97%), whereas the three least urban countries as of 2018 are Liechtenstein (14%), Moldova (43%), and Bosnia and Herzegovina (48%).
There is a wide range in military spending throughout the European continent. In general, spending is low, with an average of around 3% of government spending, in comparison with an average of about 6.4% globally. In 2020, Russia and Belarus spent more on the military than any other European countries. However, this data precedes the Russian invasion of Ukraine, which caused military spending in Ukraine to skyrocket.
The following is a map of European countries by the percentage of the population which is between 0 and 14. The most recent World Bank data available is from 2022. As of then, the average for the continent as a whole is 18%. This is one of the lowest rates in the world, compared with the average of 25%. Europe and Central Asia are tied for the lowers share of people 0-14 with North America, likely due to the high GDP of countries in those regions.
This article presents data on agricultural employment in European countries.
This is a list of total public and private health expenditure for European countries, divided by the population of the country to give expenditure per capita. It includes health services, family planning, nutrition activities, and emergency health aid.

World energy supply and consumption refers to the global supply of energy resources and its consumption. The system of global energy supply consists of the energy development, refinement, and trade of energy. Energy supplies may exist in various forms such as raw resources or more processed and refined forms of energy. The raw energy resources include for example coal, unprocessed oil & gas, uranium. In comparison, the refined forms of energy include for example refined oil that becomes fuel and electricity. Energy resources may be used in various different ways, depending on the specific resource, and intended end use. Energy production and consumption play a significant role in the global economy. It is needed in industry and global transportation. The total energy supply chain, from production to final consumption, involves many activities that cause a loss of useful energy.


