This article is about foreign-born groups in the United Kingdom. For ethnic groups in the United Kingdom regardless of birthplace, see Ethnic groups in the United Kingdom.
The foreign-born population increased from about 5.3 million in 2004 to nearly 9.3 million in 2018. In the decade leading up to 2018, the number of non-EU migrants outnumbered EU migrants while the number of EU migrants increased more rapidly. EU citizens were noted to be less likely to become British citizens than non-EU migrants.[1]
Size of the foreign-born population
This section needs to be updated. Please help update this article to reflect recent events or newly available information.(March 2025)
Foreign-born population in England, Wales and Northern Ireland in 2021Percentage born to foreign-born mothers in England and Wales in 2021
At the time of the UK census conducted in April 2001, 8.3 per cent of the country's population were foreign-born.[3] This was substantially less than that of major immigration countries such as Australia (23 per cent), Canada (19.3 per cent) and the USA (12.3 per cent).[4] In 2005, the foreign-born population was estimated at 9.1 per cent, compared to a European Union average of 8.6 per cent.[5] The 2011 census recorded 7,337,139 foreign-born residents in England, corresponding to 13.8 per cent of the population.[6] The foreign-born population of Wales was recorded as 167,871 (5.5 per cent),[7]Scotland's as 369,284 (7 per cent)[8] and Northern Ireland's as 119,186 (6.6 per cent),[9] making the total foreign-born population of the UK 7,993,480.[10][11] Figures for each census since 1951 are given in the table below.
A 2010 estimate for the whole of the UK showed that 4.76 million people (7.7 per cent) were born outside the EU and 2.24 million (3.6 per cent) were born in another EU member state.[12]
The Office for National Statistics produces annual estimates of the size of the UK population by country of birth, based on the Annual Population Survey. The estimates for 2018 showed that 9.3 million people (14 per cent of the usual resident population) were born abroad.[13]
According to the 2021–2022 United Kingdom censuses the foreign-born population was 10.7 million or 16% of the total United Kingdom, a 34% increase over the 2011 census.[14]
In January 2021, analysis by the Economic Statistics Centre of Excellence suggested that there had been an "unprecedented exodus" of almost 1.3 million foreign-born people from the UK between July 2019 and September 2020, in part due to the burden of job losses resulting from the COVID-19 pandemic falling disproportionately on foreign-born workers. Interviews conducted by Al Jazeera suggested that Brexit may have been a more significant push factor than the pandemic.[16] Subsequent analysis of the impact of the pandemic on population statistics generated by the Labour Force Survey (LFS) suggests that "LFS-based estimates are likely to significantly overstate the change in the non-UK national population". Payroll data shows that the number of EU workers fell by 7 per cent between October–December 2019 and October–December 2020.[17]
According to the Migration Observatory at the University of Oxford:
The different sources of data on migration and migrants in the UK are not always consistent with each other. For example, from 2017 to 2019, the estimated number of EU-born residents as measured by the Annual Population Survey declined, while the International Passenger Survey (LTIM data) estimated that the net migration of EU citizens was still positive. There are various reasons for this, including differences in how data sources define migrants; known uncertainty in the estimates, which come with margins of error; and unknown sources of error, such as that arising from the fact that not everyone agrees to participate in official surveys. This means that it is often sensible to look at the overall picture across several data sources, rather than focusing on short-term changes in a single dataset. ONS has identified several limitations in current data sources, and is currently developing new approaches to producing migration statistics to address them. This is likely to lead to substantial changes in official migration data between now and 2023. The foreign-born will include some people who are born abroad to UK citizen parents. However, it is usually still the preferred definition when using data on the migrant population, and especially change in the population over time. This is because migrants who acquire UK citizenship are excluded from data on the non-UK citizen population, and rates of naturalisation vary significantly depending on migrants’ country of origin. Moreover, data on non-UK citizens also include many UK-born children of migrants who have themselves never migrated.[18]
Population structure
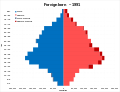
Population pyramid of the foreign born population of England and Wales (unless otherwise specified)
1971 (Great Britain)
1981 (Great Britain)
1991
2001
2011
2021
Year of arrival
Year of arrival by year grouping of current non-UK born residents in England and Wales in 2021Year of arrival for non-UK born residents in England and Wales in 2021
In 2001, the five most common foreign countries of birth were Ireland, India, Pakistan, Germany and the United States respectively.[20] In 2010, the most common foreign countries of birth were India, Poland (up from 18th in 2001), Pakistan, Ireland and Germany, respectively. While those born in Germany constitute one of the UK's largest foreign-born groups, many are British nationals who were born in Germany to British military personnel based there.[23][24][22] The United States dropped to eighth place behind South Africa and Bangladesh, despite growth in the size of the U.S.-born population.[21]
The period between 2001 and 2010 saw significant change in the UK's foreign-born population. In particular, the 2004 and 2007 enlargements of the European Union have led to mass migration from Poland, Bulgaria, Latvia, Romania, Slovakia and Lithuania.[21] The number of Poland-born people resident in the UK increased from 60,711 in 2001 to an estimated 532,000 in the year to December 2010, whilst the population born in Lithuania increased from 4,363 to an estimated 87,000.[21] The most significant decrease in a foreign-born population resident in the UK between 2001 and 2010 is in the number of those originating from Ireland. Whilst 533,901 people born in Ireland were resident in the UK in 2001, this is estimated to have declined to 405,000 by 2010.[21]
This section needs to be updated. Please help update this article to reflect recent events or newly available information.(March 2025)
In 2005 the Institute for Public Policy Research published an analysis of data from the 2001 Census, revealing the number of people included in the census who were born outside the British Isles, where they lived, and comparing this information against the 1991 Census.[24] The results were made available on the BBC website.[27] Note that this data refers to Great Britain only, rather than the whole of the UK, because of the lack of digital boundaries in the census data for Northern Ireland.[24]
↑Krausova, Anna; Vargas-Silva, Carlos (19 August 2014). "England: Census Profile". Migration Observatory, University of Oxford. Retrieved 4 July 2016.
↑Krausova, Anna; Vargas-Silva, Carlos (4 March 2014). "Wales: Census Profile". Migration Observatory, University of Oxford. Retrieved 4 July 2016.
↑Krausova, Anna; Vargas-Silva, Carlos (3 December 2013). "Scotland: Census Profile". Migration Observatory, University of Oxford. Retrieved 4 July 2016.
↑Krausova, Anna; Vargas-Silva, Carlos (26 June 2014). "Northern Ireland: Census Profile". Migration Observatory, University of Oxford. Retrieved 4 July 2016.
This page is based on this Wikipedia article Text is available under the CC BY-SA 4.0 license; additional terms may apply. Images, videos and audio are available under their respective licenses.