Northampton | |
---|---|
Former borough constituency for the House of Commons | |
County | Northamptonshire |
Major settlements | Northampton |
1295–1918 | |
Seats | 2 |
1918–1974 | |
Type of constituency | borough constituency |
Replaced by | Northampton North and Northampton South |
Northampton was a parliamentary constituency (centred on the town of Northampton), which existed until 1974.
It returned two Members of Parliament (MPs) to the House of Commons of the Parliament of the United Kingdom until its representation was reduced to one member for the 1918 general election. The constituency was abolished for the February 1974 general election, when it was replaced by the new constituencies of Northampton North and Northampton South.
A former MP of note for the constituency was Spencer Perceval, the only British Prime Minister to be assassinated.
![]() |
Election | Member | Party | |
---|---|---|---|
1918 | Charles McCurdy | Coalition Liberal | |
1922 | National Liberal | ||
1923 | Margaret Bondfield | Labour | |
1924 | Sir Arthur Holland | Conservative | |
1928 by-election | Cecil Malone | Labour | |
1931 | Sir Mervyn Manningham-Buller | Conservative | |
1940 by-election | Spencer Summers | Conservative | |
1945 | Reginald Paget | Labour | |
Feb 1974 | constituency abolished |
Party | Candidate | Votes | % | ±% | |
---|---|---|---|---|---|
Whig | ![]() | 1,376 | 42.2 | ||
Tory | ![]() | 1,315 | 40.4 | ||
Whig | Raikes Currie | 566 | 17.4 | ||
Turnout | 1,919 | c. 80.0 | |||
Registered electors | c. 2,400 | ||||
Majority | 61 | 1.8 | |||
Whig hold | Swing | −0.2 | |||
Majority | 749 | 23.0 | N/A | ||
Tory gain from Whig | Swing | +8.8 | |||
Party | Candidate | Votes | % | ±% | |
---|---|---|---|---|---|
Whig | ![]() | 1,686 | 37.5 | −4.7 | |
Whig | ![]() | 1,383 | 30.7 | +13.3 | |
Tory | Sir Robert Gunning, 3rd Baronet | 1,241 | 27.6 | +7.4 | |
Tory | James Lyon | 191 | 4.2 | −16.0 | |
Majority | 142 | 3.2 | +1.4 | ||
Turnout | 2,404 | ||||
Registered electors | |||||
Whig hold | Swing | ||||
Whig gain from Tory | Swing | ||||
Party | Candidate | Votes | % | ±% | |
---|---|---|---|---|---|
Whig | ![]() | 1,321 | 27.8 | −2.9 | |
Tory | ![]() | 1,275 | 26.9 | −0.7 | |
Whig | George Bainbridge [19] | 1,191 | 25.1 | −12.4 | |
Tory | Henry FitzRoy | 958 | 20.2 | +16.0 | |
Turnout | 2,406 | 96.4 | |||
Registered electors | 2,497 | ||||
Majority | 46 | 0.9 | −2.3 | ||
Whig hold | Swing | −5.3 | |||
Majority | 84 | 1.8 | N/A | ||
Tory gain from Whig | Swing | −3.5 | |||
Party | Candidate | Votes | % | ±% | |
---|---|---|---|---|---|
Whig | ![]() | 1,119 | 35.2 | +7.4 | |
Conservative | ![]() | 1,111 | 34.9 | −12.2 | |
Whig | Charles Hill [20] | 951 | 29.9 | +4.8 | |
Turnout | c. 1,591 | c. 73.0 | c. −23.4 | ||
Registered electors | 2,178 | ||||
Majority | 8 | 0.3 | −0.6 | ||
Whig hold | Swing | +6.8 | |||
Majority | 160 | 5.0 | +3.2 | ||
Conservative hold | Swing | −12.2 | |||
Party | Candidate | Votes | % | ±% | |
---|---|---|---|---|---|
Whig | ![]() | 1,095 | 35.9 | −29.2 | |
Radical | ![]() | 1,033 | 33.8 | New | |
Conservative | Charles Ross | 925 | 30.3 | −4.6 | |
Turnout | 1,922 | 92.4 | c. +19.4 | ||
Registered electors | 2,079 | ||||
Majority | 62 | 2.1 | +1.8 | ||
Whig hold | Swing | −13.5 | |||
Majority | 108 | 3.5 | N/A | ||
Radical gain from Conservative | Swing | N/A | |||
Party | Candidate | Votes | % | ±% | |
---|---|---|---|---|---|
Whig | ![]() | 990 | 32.6 | −3.3 | |
Radical | ![]() | 970 | 32.0 | −1.8 | |
Conservative | Henry Willoughby | 897 | 29.6 | −0.7 | |
Chartist | Peter Murray McDouall | 176 | 5.8 | New | |
Turnout | 1,517 (est) | 75.9 (est) | c. −16.5 | ||
Registered electors | 1,997 | ||||
Majority | 20 | 0.6 | −1.5 | ||
Whig hold | Swing | −0.8 | |||
Majority | 73 | 2.4 | −1.1 | ||
Radical hold | Swing | +0.8 | |||
Party | Candidate | Votes | % | ±% | |
---|---|---|---|---|---|
Radical | ![]() | 897 | 28.6 | −3.4 | |
Whig | ![]() | 841 | 26.8 | −5.8 | |
Conservative | Lebbeus Charles Humfrey | 652 | 20.8 | +6.0 | |
Conservative | Augustus Frederick Bayford | 607 | 19.3 | +4.5 | |
Chartist | John Epps | 141 | 4.5 | −1.3 | |
Turnout | 1,569 (est) | 84.0 (est) | +8.1 | ||
Registered electors | 1,867 | ||||
Majority | 56 | 1.8 | −0.6 | ||
Radical hold | Swing | −4.3 | |||
Majority | 189 | 6.0 | +5.4 | ||
Whig hold | Swing | −5.5 | |||
Vernon Smith was appointed Secretary of State for War, requiring a by-election.
Party | Candidate | Votes | % | ±% | |
---|---|---|---|---|---|
Whig | ![]() | 823 | 63.2 | +36.4 | |
Conservative | Christopher Markham [22] [23] | 480 | 36.8 | +3.3 | |
Majority | 343 | 26.4 | +20.4 | ||
Turnout | 1,303 | 57.6 | −26.4 | ||
Registered electors | 2,263 | ||||
Whig hold | Swing | +16.6 | |||
Party | Candidate | Votes | % | ±% | |
---|---|---|---|---|---|
Whig | ![]() | 855 | 33.8 | +7.0 | |
Radical | ![]() | 825 | 32.6 | +4.0 | |
Conservative | George Ward Hunt | 745 | 29.4 | −10.7 | |
Chartist | John Ingram Lockhart | 106 | 4.2 | −0.3 | |
Turnout | 1,585 (est) | 70.0 (est) | −14.0 | ||
Registered electors | 2,263 | ||||
Majority | 30 | 1.2 | −4.8 | ||
Whig hold | Swing | +6.2 | |||
Majority | 80 | 3.2 | +1.4 | ||
Radical hold | Swing | +4.7 | |||
Vernon Smith was appointed President of the Board of Control, requiring a by-election.
Party | Candidate | Votes | % | ±% | |
---|---|---|---|---|---|
Whig | ![]() | Unopposed | |||
Whig hold |
Party | Candidate | Votes | % | ±% | |
---|---|---|---|---|---|
Whig | ![]() | 1,079 | 37.1 | +3.3 | |
Radical | ![]() | 1,011 | 34.8 | +2.2 | |
Conservative | George Ward Hunt | 815 | 28.1 | −1.3 | |
Turnout | 1,860 (est) | 78.3 (est) | +8.3 | ||
Registered electors | 2,375 | ||||
Majority | 68 | 2.3 | +1.1 | ||
Whig hold | Swing | +2.0 | |||
Majority | 196 | 6.7 | +3.5 | ||
Radical hold | Swing | +1.4 | |||
Party | Candidate | Votes | % | ±% | |
---|---|---|---|---|---|
Liberal | ![]() | 1,151 | 36.5 | +1.7 | |
Liberal | ![]() | 1,143 | 36.3 | −0.8 | |
Conservative | James Thomas Mackenzie | 832 | 26.4 | −1.7 | |
Chartist | Richard Hart | 27 | 0.9 | New | |
Majority | 311 | 9.9 | +3.2 | ||
Turnout | 1,979 (est) | 78.3 (est) | +0.0 | ||
Registered electors | 2,526 | ||||
Liberal hold | Swing | +1.3 | |||
Liberal hold | Swing | 0.0 | |||
Vernon Smith was raised to the peerage, becoming 1st Baron Lyveden, and causing a by-election.
Party | Candidate | Votes | % | ±% | |
---|---|---|---|---|---|
Liberal | ![]() | Unopposed | |||
Liberal hold |
Party | Candidate | Votes | % | ±% | |
---|---|---|---|---|---|
Liberal | ![]() | 1,269 | 28.2 | −8.1 | |
Liberal | ![]() | 1,250 | 27.8 | −8.7 | |
Conservative | George Frederick Holroyd [24] | 1,029 | 22.9 | +9.7 | |
Conservative | Sackville Stopford [25] | 950 | 21.1 | +7.9 | |
Majority | 221 | 4.9 | −5.0 | ||
Turnout | 2,249 (est) | 85.8 (est) | +7.5 | ||
Registered electors | 2,620 | ||||
Liberal hold | Swing | −8.5 | |||
Liberal hold | Swing | −8.8 | |||
Party | Candidate | Votes | % | ±% | |
---|---|---|---|---|---|
Liberal | ![]() | 2,691 | 28.5 | +0.7 | |
Liberal | ![]() | 2,154 | 22.8 | −5.4 | |
Conservative | Charles Merewether | 1,634 | 17.3 | −5.6 | |
Conservative | William Edmonstone Lendrick [26] | 1,396 | 14.8 | −6.3 | |
Liberal | Charles Bradlaugh | 1,086 | 11.5 | N/A | |
Liberal | Frederick Richard Lees [27] | 492 | 5.2 | N/A | |
Majority | 520 | 5.5 | +0.6 | ||
Turnout | 4,727 (est) | 71.4 (est) | −14.4 | ||
Registered electors | 6,621 | ||||
Liberal hold | Swing | +3.3 | |||
Liberal hold | Swing | +0.2 | |||
Party | Candidate | Votes | % | ±% | |
---|---|---|---|---|---|
Conservative | ![]() | 2,690 | 25.3 | +10.5 | |
Liberal | ![]() | 2,310 | 21.7 | −6.8 | |
Conservative | Charles Merewether | 2,175 | 20.5 | +3.2 | |
Liberal | Anthony Henley | 1,796 | 16.9 | −5.9 | |
Liberal | Charles Bradlaugh | 1,653 | 15.6 | +4.1 | |
Turnout | 5,312 (est) | 77.8 (est) | +6.4 | ||
Registered electors | 6,829 | ||||
Majority | 380 | 3.6 | N/A | ||
Conservative gain from Liberal | Swing | +6.7 | |||
Majority | 135 | 1.2 | −4.3 | ||
Liberal hold | Swing | −6.8 | |||
Gilpin's death caused a by-election.
Party | Candidate | Votes | % | ±% | |
---|---|---|---|---|---|
Conservative | ![]() | 2,171 | 37.6 | −8.2 | |
Liberal | William Fowler [28] | 1,836 | 31.8 | +4.7 | |
Liberal | Charles Bradlaugh | 1,766 | 30.6 | +3.5 | |
Majority | 335 | 5.8 | +2.2 | ||
Turnout | 5,773 | 84.5 | +6.7 | ||
Registered electors | 6,829 | ||||
Conservative gain from Liberal | Swing | −4.5 | |||
Party | Candidate | Votes | % | ±% | |
---|---|---|---|---|---|
Liberal | ![]() | 4,158 | 29.8 | +2.7 | |
Liberal | ![]() | 3,827 | 27.4 | +0.3 | |
Conservative | Pickering Phipps | 3,152 | 22.6 | −2.7 | |
Conservative | Charles Merewether [29] | 2,826 | 20.2 | −0.3 | |
Majority | 675 | 4.8 | +3.6 | ||
Turnout | 6,982 (est) | 85.3 (est) | +7.5 | ||
Registered electors | 8,189 | ||||
Liberal hold | Swing | +1.5 | |||
Liberal gain from Conservative | Swing | +1.5 | |||
Bradlaugh was unseated after voting in the Commons before taking the Oath of Allegiance, causing a by-election. [18]
Party | Candidate | Votes | % | ±% | |
---|---|---|---|---|---|
Liberal | ![]() | 3,437 | 51.0 | −6.2 | |
Conservative | Edward Corbett | 3,305 | 49.0 | +6.2 | |
Majority | 132 | 2.0 | −2.8 | ||
Turnout | 6,742 | 82.4 | −2.9 (est) | ||
Registered electors | 8,185 | ||||
Liberal hold | Swing | −6.2 | |||
Bradlaugh was expelled from the House of Commons due to his continuing prevention from taking the Oath, causing a by-election. [30] [18]
Party | Candidate | Votes | % | ±% | |
---|---|---|---|---|---|
Liberal | ![]() | 3,796 | 50.7 | −6.5 | |
Conservative | Edward Corbett | 3,688 | 49.3 | +6.5 | |
Majority | 108 | 1.4 | −3.4 | ||
Turnout | 7,484 | 89.5 | +4.2 (est) | ||
Registered electors | 8,361 | ||||
Liberal hold | Swing | −6.5 | |||
Bradlaugh resigned and sought election once more, after a resolution to exclude him from the precincts of the House of Commons was sought. [18]
Party | Candidate | Votes | % | ±% | |
---|---|---|---|---|---|
Liberal | ![]() | 4,032 | 52.4 | −4.8 | |
Conservative | Henry Charles Richards | 3,664 | 47.6 | +4.8 | |
Majority | 368 | 4.8 | 0.0 | ||
Turnout | 7,696 | 86.6 | +1.3 (est) | ||
Registered electors | 8,886 | ||||
Liberal hold | Swing | −4.8 | |||
Party | Candidate | Votes | % | ±% | |
---|---|---|---|---|---|
Liberal | ![]() | 4,845 | 37.1 | +7.3 | |
Liberal | ![]() | 4,315 | 33.1 | +5.7 | |
Conservative | Henry Charles Richards | 3,890 | 29.8 | −13.0 | |
Majority | 425 | 3.3 | −1.5 | ||
Turnout | 8,561 | 89.3 | +4.0 (est) | ||
Registered electors | 9,582 | ||||
Liberal hold | Swing | +6.9 | |||
Liberal hold | Swing | +6.1 | |||
Party | Candidate | Votes | % | ±% | |
---|---|---|---|---|---|
Liberal | ![]() | 4,570 | 28.2 | −8.9 | |
Liberal | ![]() | 4,353 | 26.8 | −6.3 | |
Liberal Unionist | Richard Turner [32] | 3,850 | 23.7 | N/A | |
Conservative | Thomas Orde Hastings Lees [33] | 3,456 | 21.3 | −8.5 | |
Majority | 503 | 3.1 | −0.2 | ||
Turnout | 8,343 | 87.1 | −2.2 | ||
Registered electors | 9,582 | ||||
Liberal hold | Swing | −2.3 | |||
Liberal hold | Swing | −1.0 | |||
Bradlaugh's death caused a by-election.
Party | Candidate | Votes | % | ±% | |
---|---|---|---|---|---|
Liberal | ![]() | 5,436 | 59.4 | +4.4 | |
Conservative | Robert Arthur Germaine [34] | 3,723 | 40.6 | −4.4 | |
Majority | 1,713 | 18.8 | +15.7 | ||
Turnout | 9,159 | 84.1 | −3.0 | ||
Registered electors | 10,895 | ||||
Liberal hold | Swing | +4.4 | |||
Party | Candidate | Votes | % | ±% | |
---|---|---|---|---|---|
Liberal | ![]() | 5,439 | 31.1 | +2.9 | |
Liberal | ![]() | 5,164 | 29.5 | +2.7 | |
Conservative | Henry Charles Richards | 3,651 | 20.9 | −2.8 | |
Conservative | Adolphus Drucker | 3,235 | 18.5 | −2.8 | |
Majority | 1,513 | 8.6 | +5.5 | ||
Turnout | 9,078 (est) | 81.2 | −5.9 | ||
Registered electors | 11,180 | ||||
Liberal hold | Swing | +2.9 | |||
Liberal hold | Swing | +2.8 | |||
Party | Candidate | Votes | % | ±% | |
---|---|---|---|---|---|
Liberal | ![]() | 4,884 | 27.0 | −4.1 | |
Conservative | ![]() | 3,820 | 21.0 | +2.5 | |
Lib-Lab | Edward Harford | 3,703 | 20.4 | −9.1 | |
Conservative | Jacob Jacobs | 3,394 | 18.7 | −2.2 | |
Social Democratic Federation | Frederick George Jones | 1,216 | 6.7 | N/A | |
Independent Liberal | J. M. Robertson | 1,131 | 6.2 | N/A | |
Turnout | 9,554 (est) | 83.5 | +2.3 | ||
Registered electors | 11,442 | ||||
Majority | 1,490 | 8.3 | −0.3 | ||
Liberal hold | Swing | −3.3 | |||
Majority | 117 | 0.6 | N/A | ||
Conservative gain from Liberal | Swing | +5.8 | |||
Party | Candidate | Votes | % | ±% | |
---|---|---|---|---|---|
Liberal | ![]() | 5,437 | 28.2 | +7.8 | |
Liberal | ![]() | 5,281 | 27.3 | +0.3 | |
Conservative | Richard Rouse Boughton Orlebar | 4,480 | 23.2 | +2.2 | |
Conservative | H E Randall | 4,124 | 21.3 | +2.6 | |
Turnout | 19,322 | 83.1 | −0.4 | ||
Registered electors | 12,180 | ||||
Majority | 166 | 4.1 | −4.2 | ||
Liberal gain from Conservative | Swing | +2.8 | |||
Liberal hold | Swing | −1.0 | |||
Party | Candidate | Votes | % | ±% | |
---|---|---|---|---|---|
Liberal | ![]() | 4,479 | 20.7 | −6.6 | |
Liberal | ![]() | 4,244 | 19.5 | −8.7 | |
Conservative | Richard Rouse Boughton Orlebar | 4,078 | 18.8 | −4.4 | |
Conservative | Frederic Gorell Barnes | 4,000 | 18.4 | −2.9 | |
Social Democratic Federation | Jack Williams | 2,544 | 11.7 | New | |
Social Democratic Federation | James Gribble | 2,366 | 10.9 | New | |
Turnout | 21,711 | 92.0 | +8.9 | ||
Registered electors | 11,954 | ||||
Majority | 166 | 0.7 | −3.4 | ||
Liberal hold | Swing | −1.1 | |||
Liberal hold | Swing | −2.2 | |||
Party | Candidate | Votes | % | ±% | |
---|---|---|---|---|---|
Liberal | ![]() | 5,398 | 23.3 | +2.6 | |
Liberal | ![]() | 5,289 | 22.9 | +3.4 | |
Conservative | Richard Rouse Boughton Orlebar | 4,569 | 19.8 | +1.0 | |
Conservative | Frederic Gorell Barnes | 4,464 | 19.3 | +0.9 | |
Social Democratic Federation | James Gribble | 1,792 | 7.7 | −4.0 | |
Social Democratic Federation | Harry Quelch | 1,617 | 7.0 | −3.9 | |
Majority | 720 | 3.1 | +2.4 | ||
Turnout | 23,129 | 92.7 | +0.7 | ||
Liberal hold | |||||
Liberal hold |
Party | Candidate | Votes | % | ±% | |
---|---|---|---|---|---|
Liberal | ![]() | 6,179 | 28.6 | +5.7 | |
Liberal | ![]() | 6,025 | 27.8 | +4.5 | |
Conservative | F. C. Parker | 4,885 | 22.6 | +2.8 | |
Conservative | J. V. Collier | 4,550 | 21.0 | +1.7 | |
Majority | 1,140 | 5.2 | +2.1 | ||
Turnout | 21,639 | 87.7 | −5.0 | ||
Liberal hold | |||||
Liberal hold |
A General Election was due to take place by the end of 1915. By the summer of 1914, the following candidates had been adopted to contest that election. Due to the outbreak of war, the election never took place.
Party | Candidate | Votes | % | ±% | |
---|---|---|---|---|---|
C | Liberal | Charles McCurdy | 18,010 | 62.7 | +16.5 |
Labour | Walter Halls | 10,735 | 37.3 | New | |
Majority | 7,275 | 25.4 | N/A | ||
Turnout | 28,745 | 62.5 | −30.2 | ||
Registered electors | 46,007 | ||||
Liberal hold | Swing | N/A | |||
Cindicates candidate endorsed by the coalition government. |
Party | Candidate | Votes | % | ±% | |
---|---|---|---|---|---|
C | Liberal | Charles McCurdy | 16,650 | 55.6 | −7.1 |
Labour | Margaret Bondfield | 13,279 | 44.4 | +7.1 | |
Majority | 3,371 | 11.2 | −14.2 | ||
Turnout | 29,929 | 67.1 | +4.6 | ||
Registered electors | 44,573 | ||||
Liberal hold | Swing | −7.1 | |||
Cindicates candidate endorsed by the coalition government. |
Party | Candidate | Votes | % | ±% | |
---|---|---|---|---|---|
National Liberal | Charles McCurdy | 19,974 | 52.3 | New | |
Labour | Margaret Bondfield | 14,498 | 37.9 | +0.6 | |
Liberal | Henry Vivian | 3,753 | 9.8 | −52.9 | |
Majority | 5,476 | 14.4 | N/A | ||
Turnout | 38,225 | 85.5 | +23.0 | ||
Registered electors | 44,722 | ||||
National Liberal gain from Liberal | Swing | N/A | |||
Party | Candidate | Votes | % | ±% | |
---|---|---|---|---|---|
Labour | Margaret Bondfield | 15,556 | 40.5 | +2.6 | |
Unionist | John Veasy Collier | 11,520 | 30.0 | New | |
Liberal | Charles McCurdy | 11,342 | 29.5 | +19.7 | |
Majority | 4,036 | 10.5 | N/A | ||
Turnout | 38,418 | 84.3 | −1.2 | ||
Registered electors | 45,599 | ||||
Labour gain from National Liberal | Swing | N/A | |||
Party | Candidate | Votes | % | ±% | |
---|---|---|---|---|---|
Unionist | Arthur Holland | 16,017 | 39.5 | +9.5 | |
Labour | Margaret Bondfield | 15,046 | 37.2 | −3.3 | |
Liberal | James Manfield | 9,436 | 23.3 | −6.2 | |
Majority | 971 | 2.3 | N/A | ||
Turnout | 40,499 | 87.0 | +2.7 | ||
Registered electors | 46,543 | ||||
Unionist gain from Labour | Swing | +6.4 | |||
Party | Candidate | Votes | % | ±% | |
---|---|---|---|---|---|
Labour | Cecil Malone | 15,173 | 37.5 | +0.3 | |
Unionist | Alexander Renton | 14,616 | 36.1 | −3.4 | |
Liberal | Sydney Morgan | 9,584 | 23.7 | +0.4 | |
Ind. Unionist | E.A. Hailwood | 1,093 | 2.7 | New | |
Majority | 557 | 1.4 | N/A | ||
Turnout | 40,466 | 84.2 | −2.8 | ||
Registered electors | 48,048 | ||||
Labour gain from Unionist | Swing | +1.9 | |||
Party | Candidate | Votes | % | ±% | |
---|---|---|---|---|---|
Labour | Cecil Malone | 22,356 | 41.7 | +4.5 | |
Unionist | Alexander Renton | 20,177 | 37.7 | −1.8 | |
Liberal | Helen Schilizzi | 11,054 | 20.6 | −2.7 | |
Majority | 2,179 | 4.0 | N/A | ||
Turnout | 53,587 | 87.5 | +0.5 | ||
Registered electors | 61,222 | ||||
Labour hold | Swing | +3.2 | |||
Party | Candidate | Votes | % | ±% | |
---|---|---|---|---|---|
Conservative | Mervyn Manningham-Buller | 34,817 | 63.6 | +25.9 | |
Labour | Cecil Malone | 19,898 | 36.4 | −5.3 | |
Majority | 14,919 | 27.2 | N/A | ||
Turnout | 54,715 | 87.4 | −0.1 | ||
Conservative gain from Labour | Swing | ||||
Party | Candidate | Votes | % | ±% | |
---|---|---|---|---|---|
Conservative | Mervyn Manningham-Buller | 25,438 | 51.5 | −12.1 | |
Labour | Reginald Paget | 23,983 | 48.5 | +12.1 | |
Majority | 1,455 | 3.0 | −24.2 | ||
Turnout | 49,421 | 79.6 | −7.8 | ||
Conservative hold | Swing | ||||
General Election 1939–40
Another General Election was required to take place before the end of 1940. The political parties had been making preparations for an election to take place and by the Autumn of 1939, the following candidates had been selected;
Party | Candidate | Votes | % | ±% | |
---|---|---|---|---|---|
Conservative | Spencer Summers | 16,587 | 93.4 | +41.9 | |
Christian Pacifist | William Stanley Seamark | 1,167 | 6.6 | New | |
Majority | 15,420 | 86.8 | +83.8 | ||
Turnout | 17,754 | 30.0 | −49.6 | ||
Conservative hold | Swing | ||||
Party | Candidate | Votes | % | ±% | |
---|---|---|---|---|---|
Labour | Reginald Paget | 27,681 | 56.36 | +7.86 | |
Conservative | Spencer Summers | 20,864 | 42.11 | −9.39 | |
Independent Labour | James Edward Bugby | 749 | 1.53 | New | |
Majority | 6,997 | 14.25 | N/A | ||
Turnout | 49,114 | 75.52 | −4.08 | ||
Registered electors | 65,038 | ||||
Labour gain from Conservative | Swing | +8.63 | |||
Party | Candidate | Votes | % | ±% | |
---|---|---|---|---|---|
Labour | Reginald Paget | 31,946 | 48.98 | −7.38 | |
Conservative | R.L. Agnew | 24,664 | 37.81 | −4.30 | |
Liberal | Sydney Husbands Alloway | 8,619 | 13.21 | New | |
Majority | 7,282 | 11.17 | −3.08 | ||
Turnout | 65,229 | 87.55 | +12.03 | ||
Registered electors | 74,502 | ||||
Labour hold | Swing | −1.54 | |||
Party | Candidate | Votes | % | ±% | |
---|---|---|---|---|---|
Labour | Reginald Paget | 35,038 | 53.67 | +4.69 | |
Conservative | John Veasey Collier | 30,244 | 46.33 | +8.52 | |
Majority | 4,794 | 7.34 | −3.83 | ||
Turnout | 65,282 | 86.41 | −1.14 | ||
Registered electors | 75,551 | ||||
Labour hold | Swing | −1.92 | |||
Party | Candidate | Votes | % | ±% | |
---|---|---|---|---|---|
Labour | Reginald Paget | 32,119 | 52.75 | −0.92 | |
Conservative | William Clark | 28,771 | 47.25 | +0.92 | |
Majority | 3,348 | 5.50 | −1.84 | ||
Turnout | 60,890 | 82.60 | −3.81 | ||
Registered electors | 73,713 | ||||
Labour hold | Swing | −0.92 | |||
Party | Candidate | Votes | % | ±% | |
---|---|---|---|---|---|
Labour | Reginald Paget | 27,823 | 46.30 | −6.45 | |
Conservative | Jill Knight | 25,106 | 41.77 | −5.48 | |
Liberal | Anthony Smith | 7,170 | 11.93 | New | |
Majority | 2,717 | 4.53 | −0.97 | ||
Turnout | 60,099 | 82.87 | +0.27 | ||
Registered electors | 72,521 | ||||
Labour hold | Swing | −0.49 | |||
Party | Candidate | Votes | % | ±% | |
---|---|---|---|---|---|
Labour | Reginald Paget | 28,568 | 49.04 | +2.74 | |
Conservative | Jill Knight | 24,128 | 41.42 | −0.35 | |
Liberal | Irene Watson | 5,557 | 9.54 | −2.39 | |
Majority | 4,440 | 7.62 | +3.09 | ||
Turnout | 58,253 | 79.66 | −3.21 | ||
Registered electors | 73,129 | ||||
Labour hold | Swing | +1.55 | |||
Party | Candidate | Votes | % | ±% | |
---|---|---|---|---|---|
Labour | Reginald Paget | 31,541 | 56.74 | +7.70 | |
Conservative | Oliver Wright | 24,052 | 43.26 | +1.84 | |
Majority | 7,489 | 13.48 | +5.86 | ||
Turnout | 55,593 | 76.38 | −3.28 | ||
Registered electors | 72,781 | ||||
Labour hold | Swing | +2.93 | |||
Party | Candidate | Votes | % | ±% | |
---|---|---|---|---|---|
Labour | Reginald Paget | 27,424 | 51.16 | −5.58 | |
Conservative | Cecil Parkinson | 26,183 | 48.84 | +5.58 | |
Majority | 1,241 | 2.32 | −11.16 | ||
Turnout | 53,607 | 71.87 | −4.51 | ||
Registered electors | 74.590 | ||||
Labour hold | Swing | −5.58 | |||
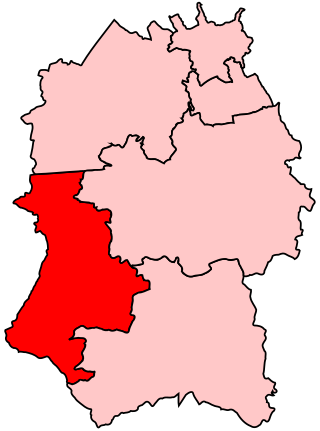
Westbury was a parliamentary constituency in Wiltshire from 1449 to 2010. It was represented in the House of Commons of England until 1707, and then in the House of Commons of Great Britain from 1707 to 1800, and finally in the House of Commons of the Parliament of the United Kingdom from 1801 until 2010.
Great Yarmouth is a constituency represented in the House of Commons of the Parliament of the United Kingdom. Its MP is Brandon Lewis, the current Secretary of State for Justice and Lord Chancellor, who has held the seat since the 2010 general election. He was previously the Chairman of the Conservative Party and Secretary of State for Northern Ireland.
St Albans is a constituency represented in the House of Commons of the UK Parliament since 2019 by Daisy Cooper, a Liberal Democrat.
Stockport is a constituency represented in the House of Commons of the UK Parliament since 2019 by Navendu Mishra of the Labour Party.
South Shields is a borough constituency represented in the House of Commons of the Parliament of the United Kingdom. It elects one Member of Parliament (MP) by the first past the post system of election. It has been represented by Emma Lewell-Buck of the Labour Party since 2013.
Cambridge is a constituency represented in the House of Commons of the UK Parliament since 2015 by Daniel Zeichner of the Labour Party.
Dewsbury is a constituency created in 1868. This seat is represented in the House of Commons of the United Kingdom Parliament since 2019 by Mark Eastwood of the Conservative Party.
Lincoln is a constituency in Lincolnshire, England represented in the House of Commons of the UK Parliament since 2019 by Karl McCartney, a Conservative Party politician.
Lichfield is a constituency in Staffordshire represented in the House of Commons of the UK Parliament since its 1997 recreation by Michael Fabricant, a Conservative.
Harwich was a parliamentary constituency represented in the House of Commons of the Parliament of the United Kingdom. Until its abolition for the 2010 general election it elected one Member of Parliament (MP) by the first past the post system of election.
Ipswich is a constituency represented in the House of Commons of the UK Parliament since December 2019 by Tom Hunt of the Conservative Party.
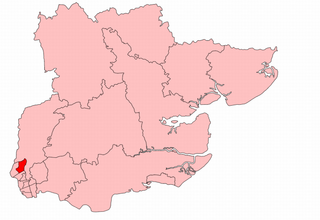
Reading was a parliamentary borough, and later a borough constituency, represented in the House of Commons of the Parliament of the United Kingdom. It comprised the town of Reading in the county of Berkshire.
Paisley was a parliamentary constituency represented in the House of Commons of the Parliament of the United Kingdom from 1832 until 1983, when it was divided into Paisley North and Paisley South. These two constituencies were in turn amalgamated into Paisley and Renfrewshire South and Paisley and Renfrewshire North in 2005.
Greenwich was a constituency in south-east London, which returned at first two, then one member (MP) to the House of Commons of the UK Parliament. It existed from 1832 to 1997. Elections used the first past the post system; when this elects more than one member, it is sometimes called plurality-at-large voting.
Huntingdonshire was a Parliamentary constituency covering the county of Huntingdonshire in England. It was represented in the House of Commons of England until 1707, then in the House of Commons of Great Britain from 1707 to 1800, and then in the House of Commons the Parliament of the United Kingdom from 1801 to 1885. It returned two Knights of the Shire ; when elections were contested, the bloc vote system was used.
Kidderminster was a parliamentary constituency in Worcestershire, represented in the House of Commons of the Parliament of the United Kingdom. It elected one Member of Parliament (MP) by the first past the post voting system.
King's Lynn was a constituency in Norfolk represented continually in the House of Commons of the Parliament of the United Kingdom from 1298 until it was abolished for the February 1974 general election.
Hertford was the name of a parliamentary constituency in Hertfordshire, which elected Members of Parliament (MPs) from 1298 until 1974.
Walthamstow East was a parliamentary constituency in what was then the Municipal Borough of Walthamstow in east London. It returned one Member of Parliament (MP) to the House of Commons of the Parliament of the United Kingdom, elected by the first-past-the-post voting system.
Kirkcaldy Burghs was a burgh constituency of the House of Commons of the Parliament of the United Kingdom (Westminster) from 1832 to 1974. It elected one Member of Parliament (MP) by the first-past-the-post voting system. From 1832 to 1950 it was, officially, a district of burghs constituency.
{{cite book}}
: |format=
requires |url=
(help)