South Carolina's 7th congressional district

Last updated

South Carolina's 7th congressional district
South Carolina's 7th congressional district (since 2023).svg
South Carolina's 7th congressional district
Interactive map of district boundaries since January 3, 2023
Representative
  Russell Fry
RMurrells Inlet
Population (2022)762,499 [1]
Median household
income
$53,313 [1]
Ethnicity
Cook PVI R+11 [2]

South Carolina's 7th congressional district is a congressional district for the United States House of Representatives in South Carolina, established in 2011 following apportionment of another seat to the state in the redistricting cycle following the 2010 census. It is located in the Pee Dee region, and includes all of Chesterfield, Darlington, Dillon, Georgetown, Horry, Marion, and Marlboro Counties and most of Florence County. The district is represented by Republican Russell Fry who was elected in 2022 and took office on January 3, 2023.

Contents

History

The 7th congressional district of South Carolina existed in the 19th century, but was eliminated in 1853 as a result of the 1850 census. After the 1880 census, Congress apportioned the state another seat, and the state legislature re-established the district.

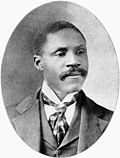
By that time, the Reconstruction era had ended and the state legislature was controlled by Democrats, who wrested control by a mixture of violence and fraud. They defined the boundaries of the 7th district, which was called the "shoestring district" because of its long, narrow shape that included many black precincts. In 1892 and 1894 the majority-black voters of the district elected George W. Murray to Congress; he was the only African American to serve in Congress in those sessions and, following disfranchisement and demographic changes, the last elected from the state until Jim Clyburn in 1992.

In 1895, the Democrat-dominated state legislature passed a new constitution, disfranchising black voters by changes to voter registration and electoral rules that were applied against them in a discriminatory way. For decades after 1896, only white Democrats were elected to Congress from the state. (Such disfranchisement occurred among all the states of the former Confederacy, and their use of poll taxes, literacy tests, grandfather clauses, and white primaries survived several US Supreme Court challenges.)

During the first half of the 20th century, 6.5 million blacks in total left South Carolina and other southern states in the Great Migration to the North, Midwest and West. Following cumulative declines in state population, after the 1930 census, South Carolina lost a seat and the 7th district was eliminated in redistricting. It was last represented by Democrat Hampton P. Fulmer, who was redistricted into the 2nd district.

South Carolina had only six districts for the next 80 years. African Americans were effectively barred from voting until after passage of the Voting Rights Act of 1965. Increases in population led to the state's receiving another congressional seat in the redistricting cycle following the 2010 census.

The 7th district is located in the rapidly developing area of northeastern South Carolina, including the Myrtle Beach metropolitan area (the Grand Strand) and the Pee Dee region. [3] [4] It is a white-majority district and its voters elected Republican Tom Rice as US Representative from the district in 2012; he took office in January 2013, when the 113th Congress convened. Due almost entirely to the presence of heavily Republican Horry County, which has as many people as the rest of the district combined, it tilts Republican.

The district boundaries are roughly similar to the configuration of the 6th congressional district before it was reconfigured after the 1990 census as a black-majority district.

Counties

Counties in the 2023–2033 district map:

Election results from presidential races

YearOfficeResult
2012 President Romney 54.5–44.4%
2016 President Trump 58–39.1%
2020 President Trump 58–40.2%

List of members representing the district

Member
(Residence)
PartyYearsCong
ress
Electoral historyDistrict location
District established March 4, 1803
Thomas Moore
(Prices Store)
Democratic-Republican March 4, 1803 –
March 3, 1813
8th
9th
10th
11th
12th
Redistricted from the 6th district and re-elected in 1803.
Re-elected in 1804.
Re-elected in 1806.
Re-elected in 1808.
Re-elected in 1810.
Retired.
1803–1813
"Chester district"
Elias Earle (1762-1823).png
Elias Earle
(Centerville)
Democratic-Republican March 4, 1813 –
March 3, 1815
13th Redistricted from the 8th district and re-elected in 1812.
Lost re-election.
1813–1823
"Pendleton district"
John Taylor
(Pendleton)
Democratic-Republican March 4, 1815 –
March 3, 1817
14th Elected in 1814.
Lost re-election.
Elias Earle (1762-1823).png
Elias Earle
(Centerville)
Democratic-Republican March 4, 1817 –
March 3, 1821
15th
16th
Elected in 1816.
Re-elected in 1818.
Retired.
John Wilson
(Golden Grove)
Democratic-Republican March 4, 1821 –
March 3, 1823
17th Elected in 1820.
Redistricted to the 6th district .
Joseph Gist
(Pinckneyville)
Jackson
Republican
March 4, 1823 –
March 3, 1825
18th
19th
Redistricted from the 8th district and re-elected in 1823.
Re-elected in 1824.
Retired.
1823–1833
"Chester district"
Jacksonian March 4, 1825 –
March 3, 1827
William T. Nuckolls
(Hancockville)
Jacksonian March 4, 1827 –
March 3, 1833
20th
21st
22nd
Elected in 1826.
Re-elected in 1828.
Re-elected in 1830.
Retired.
William K. Clowney
(Union)
Nullifier March 4, 1833 –
March 3, 1835
23rd Elected in 1833.
Lost re-election.
1833–1843
[ data missing ]
James Rogers
(Yorkville)
Jacksonian March 4, 1835 –
March 3, 1837
24th Elected in 1834.
Lost re-election.
William K. Clowney
(Union)
Nullifier March 4, 1837 –
March 3, 1839
25th Elected in 1836.
Retired.
James Rogers
(Maybinton)
Democratic March 4, 1839 –
March 3, 1843
26th
27th
Elected in 1838.
Re-elected in 1840.
Retired.
Robert Barnwell Rhett, Sr.gif
Robert B. Rhett
(Ashepoo)
Democratic March 4, 1843 –
March 3, 1849
28th
29th
30th
Redistricted from the 2nd district and re-elected in 1843.
Re-elected in 1844.
Re-elected in 1846.
Retired.
1843–1853
[ data missing ]
William F. Colcock
(Grahamville)
Democratic March 4, 1849 –
March 3, 1853
31st
32nd
Elected in 1848.
Re-elected in 1850.
Retired.
District dissolved March 3, 1853
District re-established March 4, 1883
Edmund William McGregor Mackey - Brady-Handy.jpg
Edmund W. M. Mackey
(Berkeley)
Republican March 4, 1883 –
January 27, 1884
48th Redistricted from the 2nd district and re-elected in 1882.
Died.
1883–1893
[ data missing ]
VacantJanuary 27, 1884 –
March 18, 1884
Robert Smalls - Brady-Handy.jpg
Robert Smalls
(Beaufort)
Republican March 18, 1884 –
March 3, 1887
48th
49th
Elected to finish Mackey's term.
Re-elected in 1884.
Lost re-election.
William Elliott (1838-1907).jpg
William Elliott
(Beaufort)
Democratic March 4, 1887 –
September 23, 1890
50th
51st
Elected in 1886.
Re-elected in 1888.
Lost election contest.
Thomas Ezekiel Miller.jpg
Thomas E. Miller
(Beaufort)
Republican September 24, 1890 –
March 3, 1891
51st Won election contest.
Lost re-election.
William Elliott (1838-1907).jpg
William Elliott
(Beaufort)
Democratic March 4, 1891 –
March 3, 1893
52nd Elected in 1890.
Retired.
George Washington Murray.jpg
George W. Murray
(Sumter)
Republican March 4, 1893 –
March 3, 1895
53rd Elected in 1892.
Redistricted to the 1st district .
1893–1903
[ data missing ]
JWilliamStokes.jpg
J. William Stokes
(Orangeburg)
Democratic March 4, 1895 –
June 1, 1896
54th Elected in 1894.
Seat declared vacant while being contested because of Democratic election fraud.
VacantJune 1, 1896 –
November 3, 1896
JWilliamStokes.jpg
J. William Stokes
(Orangeburg)
Democratic November 3, 1896 –
July 6, 1901
54th
55th
56th
57th
Elected to finish his own term.
Also elected in 1896 to the next term.
Re-elected in 1898.
Re-elected in 1900.
Died.
VacantJuly 6, 1901 –
November 5, 1901
57th
Asbury Francis Lever hec-12496 (cropped).jpg
Asbury F. Lever
(Lexington)
Democratic November 5, 1901 –
August 1, 1919
57th
58th
59th
60th
61st
62nd
63rd
64th
65th
66th
Elected to finish Stokes's term.
Re-elected in 1902.
Re-elected in 1904.
Re-elected in 1906.
Re-elected in 1908.
Re-elected in 1910.
Re-elected in 1912.
Re-elected in 1914.
Re-elected in 1916.
Re-elected in 1918.
Resigned to become member of Federal Farm Loan Board.
1903–1913
[ data missing ]
1913–1923
[ data missing ]
VacantAugust 1, 1919 –
October 7, 1919
66th
EdwardCMann.jpg
Edward C. Mann
(St. Matthews)
Democratic October 7, 1919 –
March 3, 1921
Elected to finish Lever's term.
Lost renomination.
HamptonPFulmer.jpg
Hampton P. Fulmer
(Orangeburg)
Democratic March 4, 1921 –
March 3, 1933
67th
68th
69th
70th
71st
72nd
Elected in 1920.
Re-elected in 1922.
Re-elected in 1924.
Re-elected in 1926.
Re-elected in 1928.
Re-elected in 1930.
Redistricted to the 2nd district .
1923–1933
[ data missing ]
District dissolved March 3, 1933
District re-established January 3, 2013
Tom Rice, Official Portrait, 113th Congress - full (cropped).jpg
Tom Rice
(Myrtle Beach)
Republican January 3, 2013 –
January 3, 2023
113th
114th
115th
116th
117th
Elected in 2012.
Re-elected in 2014.
Re-elected in 2016.
Re-elected in 2018.
Re-elected in 2020.
Lost renomination.
2013–2023
South Carolina US Congressional District 7 (since 2013).tif
Rep Russell Fry Offficial Portrait.jpg
Russell Fry
(Murrells Inlet)
Republican January 3, 2023 –
present
118th Elected in 2022.2023–2033
South Carolina's 7th congressional district (since 2023).svg

Past election results

2012

2012 South Carolina's 7th congressional district election [5] [6]
PartyCandidateVotes%
Republican Tom Rice 153,068 55.5
Democratic Gloria Tinubu 122,38944.4
Write-in 2810.1
Total votes275,738 100.0
Republican win (new seat)

2014

2014 South Carolina's 7th congressional district election [7]
PartyCandidateVotes%
Republican Tom Rice (Incumbent) 102,833 59.9
Democratic Gloria Bromell-Tinubu68,57640.0
Write-in 1150.1
Total votes171,524 100.0
Republican hold

2016

2016 South Carolina's 7th congressional district election [8]
PartyCandidateVotes%
Republican Tom Rice (incumbent) 176,468 61.0
Democratic Mal Hyman112,74438.9
Write-in 2510.1
Total votes289,463 100.0
Republican hold

2018

2018 South Carolina's 7th congressional district election [9]
PartyCandidateVotes%
Republican Tom Rice (incumbent) 142,681 59.6
Democratic Robert Williams96,56440.3
Write-in 3090.1
Total votes239,554 100.0
Republican hold

2020

2020 South Carolina's 7th congressional district election [10]
PartyCandidateVotes%
Republican Tom Rice (incumbent) 224,993 61.8
Democratic Melissa Ward Watson138,86338.1
Write-in 2350.1
Total votes364,091 100.0
Republican hold

2022

2022 South Carolina's 7th congressional district election [11]
PartyCandidateVotes%
Republican Russell Fry 164,440 64.7
Democratic Daryl W. Scott89,03035.0
Write-in 3950.1
Total votes253,865 100.0
Republican hold

See also

Related Research Articles

<span class="mw-page-title-main">Solid South</span> 1877–1964 U.S. Democratic voting bloc

The Solid South or the Southern bloc was the electoral voting bloc of the states of the Southern United States for issues that were regarded as particularly important to the interests of Democrats in those states. The Southern bloc existed between the end of the Reconstruction era in 1877 and the passage of the Civil Rights Act of 1964. During this period, the Democratic Party overwhelmingly controlled southern state legislatures, and most local, state and federal officeholders in the South were Democrats. During the late 1800s and early 1900s, Southern Democrats disenfranchised blacks in all Southern states, along with a few non-Southern states doing the same as well. This resulted essentially in a one-party system, in which a candidate's victory in Democratic primary elections was tantamount to election to the office itself. White primaries were another means that the Democrats used to consolidate their political power, excluding blacks from voting in primaries.

<span class="mw-page-title-main">South Carolina's 2nd congressional district</span> U.S. House district for South Carolina

South Carolina's 2nd congressional district is in central and southwestern South Carolina. The district spans from Columbia to the South Carolina side of the Augusta, Georgia metropolitan area.

<span class="mw-page-title-main">Alabama's congressional districts</span>

The U.S. state of Alabama is currently divided into seven congressional districts, each represented by a member of the United States House of Representatives.

<span class="mw-page-title-main">South Carolina's 1st congressional district</span> U.S. House district for South Carolina

South Carolina's 1st congressional district is a coastal congressional district in South Carolina, represented by Republican Nancy Mace since January 3, 2021. She succeeded Democrat Joe Cunningham, having defeated him in the 2020 election. Cunningham was the first Democrat to represent the district since the 1980s.

<span class="mw-page-title-main">South Carolina's 5th congressional district</span> U.S. House district for South Carolina

South Carolina's 5th congressional district is a congressional district in northern South Carolina bordering North Carolina. The district includes all of Cherokee, Chester, Fairfield, Kershaw, Lancaster, Lee, Union and York counties and parts of Newberry, Spartanburg and Sumter counties. The bulk of its population lives on the South Carolina side of the Charlotte metropolitan area, including the rapidly growing cities of Rock Hill, Fort Mill, and Lake Wylie. Outside the Charlotte suburbs, the district is mostly rural and agricultural. The district borders were contracted from some of the easternmost counties in the 2012 redistricting.

<span class="mw-page-title-main">South Carolina's 6th congressional district</span> U.S. House district for South Carolina

South Carolina's 6th congressional district is in central and eastern South Carolina. It includes all of Allendale, Bamberg, Calhoun, Clarendon, Hampton, and Williamsburg counties and parts of Charleston, Colleton, Dorchester, Florence, Jasper, Orangeburg, Richland and Sumter counties. With a Cook Partisan Voting Index rating of D+14, it is the only Democratic district in South Carolina.

<span class="mw-page-title-main">South Carolina's congressional districts</span> U.S. House districts in the state of South Carolina

There are currently seven United States congressional districts in South Carolina. There have been as few as four and as many as nine congressional districts in South Carolina. The 9th district and the 8th district were lost after the 1840 census. The 5th district and the 6th district were also briefly lost after the Civil War, but both had been regained by the 1880 census. Because of the state population growth in the 2010 census, South Carolina regained its 7th district, which had remained unused since the Civil War.

<span class="mw-page-title-main">Thomas E. Miller</span> American politician

Thomas Ezekiel Miller was an American educator, lawyer and politician. After being elected as a state legislator in South Carolina, he was one of only five African Americans elected to Congress from the South in the Jim Crow era of the last decade of the nineteenth century, as disfranchisement reduced black voting. After that, no African Americans were elected from the South until 1972.

<span class="mw-page-title-main">North Carolina's 2nd congressional district</span> U.S. House district for North Carolina

North Carolina's 2nd congressional district is located in the central part of the state. The district contains most of Wake County. Prior to court-mandated redistricting in 2019, it also included northern Johnston County, southern Nash County, far western Wilson County, and all of Franklin and Harnett counties. The 2nd district has been represented by Democratic Rep. Deborah Ross since 2021.

<span class="mw-page-title-main">Disfranchisement after the Reconstruction era</span> Post-civil war voter suppression efforts in the United States

Disfranchisement after the Reconstruction era in the United States, especially in the Southern United States, was based on a series of laws, new constitutions, and practices in the South that were deliberately used to prevent black citizens from registering to vote and voting. These measures were enacted by the former Confederate states at the turn of the 20th century. Efforts were also made in Maryland, Kentucky, and Oklahoma. Their actions were designed to thwart the objective of the Fifteenth Amendment to the United States Constitution, ratified in 1870, which prohibited states from depriving voters of their voting rights based on race. The laws were frequently written in ways to be ostensibly non-racial on paper, but were implemented in ways that selectively suppressed black voters apart from other voters.

<span class="mw-page-title-main">William Elliott (American politician)</span> American politician

William Elliott was an American attorney and politician, serving as U.S. Representative from South Carolina.

<span class="mw-page-title-main">1992 United States House of Representatives elections in South Carolina</span>

The 1992 United States House of Representatives elections in South Carolina were held on November 3, 1992, to elect the six U.S. representatives from the state of South Carolina, one from each of the state's six congressional districts. The elections coincided with the 1992 U.S. presidential election, as well as other elections to the House of Representatives, elections to the United States Senate and various state and local elections.

<span class="mw-page-title-main">Government of Mississippi</span> Government of the U.S. state of Mississippi

The Government of Mississippi is the government of the U.S. state of Mississippi. Power in Mississippi's government is distributed by the state's Constitution between the executive and legislative branches. The state's current governor is Tate Reeves. The Mississippi Legislature consists of the House of Representatives and Senate. Mississippi is one of only five states that elects its state officials in odd numbered years. Mississippi holds elections for these offices every four years in the years preceding Presidential election years.

<span class="mw-page-title-main">Politics of North Carolina</span> Overview of the politics of the U.S. state of North Carolina

Like most U.S. states, North Carolina is politically dominated by the Democratic and Republican political parties. North Carolina has 14 seats in the U.S. House of Representatives and two seats in the U.S. Senate. North Carolina has voted for the Republican candidate in all but one presidential election since 1980; the one exception was in 2008, when a plurality of North Carolinians voted for Barack Obama. However, since that election, the state has remained closely contested with Republicans winning by no more than four points and obtaining a majority of the vote only in 2012. This stands in contrast to the post-Civil War era, as the state was a strongly Democratic Solid South state from 1880 to 1964, only voting Republican in 1928.

<span class="mw-page-title-main">2012 United States House of Representatives elections in South Carolina</span> Elections

The 2012 United States House of Representatives elections in South Carolina were held on Tuesday, November 6, 2012 and elected the seven U.S. representatives from the state of South Carolina, an increase of one seat as a result of reapportionment thanks to the continued strong growth found in South Carolina as reported in the 2010 United States census. The elections coincided with the elections of other federal and state offices, including a quadrennial presidential election. The people of South Carolina elected six Republicans and one Democrat to represent the state in the 113th United States Congress.

The State government of Arkansas is divided into three branches: executive, legislative and judicial. These consist of the state governor's office, a bicameral state legislature known as the Arkansas General Assembly, and a state court system. The Arkansas Constitution delineates the structure and function of the state government. Since 1963, Arkansas has had four seats in the U.S. House of Representatives. Like all other states, it has two seats in the U.S. Senate.

<span class="mw-page-title-main">2020 United States House of Representatives elections in South Carolina</span>

The 2020 United States House of Representatives elections in South Carolina were held on November 3, 2020, to elect the seven U.S. representatives from the state of South Carolina, one from each of the state's seven congressional districts. The elections coincided with the 2020 U.S. presidential election, as well as other elections to the House of Representatives, elections to the United States Senate and various state and local elections.

<span class="mw-page-title-main">2020 United States House of Representatives elections in North Carolina</span>

The 2020 United States House of Representatives elections in North Carolina were held on November 3, 2020, to elect the 13 U.S. representatives from the state of North Carolina, one from each of the state's 13 congressional districts. The elections coincided with the 2020 U.S. presidential election, as well as other elections to the House of Representatives, elections to the United States Senate and various state and local elections.

<span class="mw-page-title-main">2022 United States House of Representatives elections in Nevada</span>

The 2022 United States House of Representatives elections in Nevada were held on November 8, 2022, to elect the four U.S. representatives from the state of Nevada, one from each of the state's four congressional districts. The elections coincided with the Nevada gubernatorial election, as well as other elections to the U.S. House of Representatives, elections to the U.S. Senate, and various state and local elections.

<span class="mw-page-title-main">2022 United States House of Representatives elections in South Carolina</span>

The 2022 United States House of Representatives elections in South Carolina were held on November 8, 2022, to elect the seven U.S. representatives from the state of South Carolina, one from each of the state's seven congressional districts. The elections coincided with other elections to the House of Representatives, elections to the United States Senate and various state and local elections.

References

  1. 1 2 "My Congressional District". census.gov. U.S. Census Bureau Center for New Media and Promotion (CNMP).
  2. "2022 Cook PVI: District Map and List". Cook Political Report. Retrieved January 10, 2023.
  3. "Census 2010 shows Red states gaining congressional districts". Washington Post. Retrieved December 21, 2010.
  4. "Archived copy" (PDF). Archived from the original (PDF) on April 13, 2014. Retrieved May 4, 2014.{{cite web}}: CS1 maint: archived copy as title (link)
  5. "Election Statistics - US House of Representatives: History, Art & Archives". Karen Haas, Clerk of the United States House of Representatives. Retrieved February 23, 2013.
  6. The votes for the Democratic candidate includes votes cast for the candidate who also ran under the Working Families Party ticket
  7. "South Carolina Election Commission Official Results". West Virginia Secretary of State. November 4, 2014. Retrieved January 8, 2015.
  8. "2016 Statewide General Election official results". South Carolina State Election Commission. Retrieved December 5, 2016.
  9. Johnson, Cheryl L. (February 28, 2019). "Statistics of the Congressional Election of November 6, 2018". Clerk of the U.S. House of Representatives . Retrieved April 27, 2019.
  10. "2020 Statewide General Election Night Reporting - Results". South Carolina Election Commission. November 10, 2020. Retrieved November 11, 2020.
  11. "2022 Statewide General Election". www.enr-scvotes.org. November 11, 2022. Retrieved January 2, 2023.

34°03′N79°30′W / 34.05°N 79.50°W / 34.05; -79.50