The 2002 Thurrock Council election took place on 2 May 2002 to elect members of Thurrock Council in Essex, England. One third of the council was up for election and the Labour party stayed in overall control of the council. [1]
Thurrock Council is the local council for the borough of Thurrock in Essex, England. Since 1997, Thurrock has been a unitary authority, combining the functions of a non-metropolitan county with that of a non-metropolitan district. The other such authority in Essex is Southend-on-Sea. It is a member of the East of England Local Government Association.
Essex is a county in the south-east of England, north-east of London. One of the home counties, it borders Suffolk and Cambridgeshire to the north, Hertfordshire to the west, Kent across the estuary of the River Thames to the south, and London to the south-west. The county town is Chelmsford, the only city in the county. For government statistical purposes Essex is placed in the East of England region.
England is a country that is part of the United Kingdom. It shares land borders with Wales to the west and Scotland to the north-northwest. The Irish Sea lies west of England and the Celtic Sea lies to the southwest. England is separated from continental Europe by the North Sea to the east and the English Channel to the south. The country covers five-eighths of the island of Great Britain, which lies in the North Atlantic, and includes over 100 smaller islands, such as the Isles of Scilly and the Isle of Wight.
43 candidates stood in the election, with 16 of the 20 wards being contested. [2] Both Conservative and Labour parties stood in all 16 seats, along with 7 Liberal Democrats, 3 Independents and 1 Green Party candidate. [2]
The Conservative Party, officially the Conservative and Unionist Party, is a centre-right political party in the United Kingdom. Presently led by Theresa May, it has been the governing party since 2010. It presently has 314 Members of Parliament in the House of Commons, 249 members of the House of Lords, and 18 members of the European Parliament. It also has 31 Members of the Scottish Parliament, 12 members of the Welsh Assembly, eight members of the London Assembly and 9,008 local councillors. One of the major parties of UK politics, it has formed the government on 45 occasions, more than any other party.
The Labour Party is a centre-left political party in the United Kingdom which has been described as an alliance of social democrats, democratic socialists and trade unionists. The party's platform emphasises greater state intervention, social justice and strengthening workers' rights.
The Liberal Democrats are a liberal political party in the United Kingdom. They presently have 11 Members of Parliament in the House of Commons, 96 members of the House of Lords, and one member of the European Parliament. They also have five Members of the Scottish Parliament and a member each in the Welsh Assembly and London Assembly. The party reached the height of its influence in the early 2010s, forming a junior partner in a coalition government from 2010 to 2015. It is presently led by Vince Cable.
After the election, the composition of the council was
Party | Seats | Gains | Losses | Net gain/loss | Seats % | Votes % | Votes | +/− | |
---|---|---|---|---|---|---|---|---|---|
Labour | 13 | 1 | 1 | 0 | 81.3 | 48.6 | 8,379 | -6.3% | |
Conservative | 1 | 1 | 2 | -1 | 6.3 | 37.1 | 6,396 | -0.4% | |
Independent | 1 | 0 | 0 | 0 | 6.3 | 7.1 | 1,220 | +6.2% | |
Liberal Democrat | 1 | 1 | 0 | +1 | 6.3 | 7.0 | 1,210 | +1.2% | |
Green | 0 | 0 | 0 | 0 | 0 | 0.2 | 41 | +0.0% |
Party | Candidate | Votes | % | ± | |
---|---|---|---|---|---|
Conservative | Neil Pearce | 889 | 60.9 | +13.6 | |
Labour | Wahidur Rahman | 413 | 28.3 | -12.6 | |
Liberal Democrat | Mark Meechan | 97 | 6.6 | -1.7 | |
Green | Dean Hall | 41 | 2.8 | -0.8 | |
Independent | Pauline Campbell | 19 | 1.3 | +1.3 | |
Majority | 476 | 32.6 | +26.2 | ||
Turnout | 1,459 | 25.7 | |||
Conservative gain from Labour | Swing | ||||
Party | Candidate | Votes | % | ± | |
---|---|---|---|---|---|
Labour | David Hooper | 597 | 57.3 | -1.3 | |
Conservative | Jane Atkins | 306 | 29.4 | +3.7 | |
Liberal Democrat | John Biddall | 138 | 13.3 | -2.5 | |
Majority | 291 | 27.9 | -5.0 | ||
Turnout | 1,041 | 15.9 | |||
Labour hold | Swing |
Party | Candidate | Votes | % | ± | |
---|---|---|---|---|---|
Labour | Anthony Fish | 974 | 70.1 | -4.1 | |
Conservative | Yvonne Partridge | 416 | 29.9 | +4.1 | |
Majority | 558 | 40.2 | -8.2 | ||
Turnout | 1,390 | 19.7 | |||
Labour hold | Swing |
Party | Candidate | Votes | % | ± | |
---|---|---|---|---|---|
Liberal Democrat | Earnshaw Palmer | 470 | 40.6 | +15.5 | |
Conservative | Neil Rockliffe | 407 | 35.1 | -2.3 | |
Labour | Ian Duffield | 282 | 24.3 | -13.2 | |
Majority | 63 | 5.5 | |||
Turnout | 1,159 | 19.8 | |||
Liberal Democrat gain from Conservative | Swing | ||||
Party | Candidate | Votes | % | ± | |
---|---|---|---|---|---|
Labour | Nigel Barron | 399 | 52.3 | -9.7 | |
Conservative | Nicola Stokes | 230 | 30.1 | -7.9 | |
Liberal Democrat | James Thompson | 134 | 17.6 | +17.6 | |
Majority | 169 | 22.2 | -1.8 | ||
Turnout | 763 | 19.6 | |||
Labour hold | Swing |
Party | Candidate | Votes | % | ± | |
---|---|---|---|---|---|
Independent | Barry Palmer | 941 | 80.6 | +80.6 | |
Labour | Julian Norris | 117 | 10.0 | -54.7 | |
Conservative | Susan Harrison | 110 | 9.4 | -25.9 | |
Majority | 824 | 70.6 | |||
Turnout | 1,168 | 27.0 | |||
Independent hold | Swing |
Party | Candidate | Votes | % | ± | |
---|---|---|---|---|---|
Labour | John Kent | 484 | 51.1 | -11.5 | |
Conservative | Faye Rigby | 282 | 29.7 | -7.7 | |
Liberal Democrat | Brian Livermore | 182 | 19.2 | +19.2 | |
Majority | 202 | 11.4 | -13.8 | ||
Turnout | 948 | 14.7 | |||
Labour hold | Swing |
Party | Candidate | Votes | % | ± | |
---|---|---|---|---|---|
Labour | Yash Gupta | 740 | 57.1 | -4.3 | |
Conservative | Steven Mason | 557 | 42.9 | +4.3 | |
Majority | 183 | 14.2 | -8.6 | ||
Turnout | 1,297 | 20.7 | |||
Labour hold | Swing |
Party | Candidate | Votes | % | ± | |
---|---|---|---|---|---|
Labour | Michael Canavon | 751 | 61.1 | -4.5 | |
Conservative | Emma Woods | 479 | 38.9 | +4.5 | |
Majority | 272 | 22.2 | -9.0 | ||
Turnout | 1,230 | 18.3 | |||
Labour hold | Swing |
Party | Candidate | Votes | % | ± | |
---|---|---|---|---|---|
Labour | Eunice Southam | 521 | 52.5 | +3.5 | |
Conservative | John Vesey | 472 | 47.5 | +19.9 | |
Majority | 49 | 5.0 | -16.4 | ||
Turnout | 993 | 22.8 | |||
Labour hold | Swing |
Party | Candidate | Votes | % | ± | |
---|---|---|---|---|---|
Labour | Arthur Clarke | 405 | 53.2 | ||
Conservative | Barry Dorrington | 356 | 46.8 | ||
Majority | 49 | 6.4 | |||
Turnout | 761 | 20.2 | |||
Labour hold | Swing |
Party | Candidate | Votes | % | ± | |
---|---|---|---|---|---|
Labour | Allan McPherson | 719 | 44.9 | -1.1 | |
Conservative | Robert Barnes | 623 | 38.9 | +1.9 | |
Independent | Geoffrey Slocock | 260 | 16.2 | +8.8 | |
Majority | 96 | 6.0 | -3.0 | ||
Turnout | 1,602 | 27.1 | |||
Labour hold | Swing |
Party | Candidate | Votes | % | ± | |
---|---|---|---|---|---|
Labour | Anthony Sharp | 709 | 51.3 | -3.0 | |
Conservative | Melanie Aung-Htut | 674 | 48.7 | +12.0 | |
Majority | 35 | 2.6 | -15.0 | ||
Turnout | 1,383 | 24.0 | |||
Labour gain from Conservative | Swing | ||||
Party | Candidate | Votes | % | ± | |
---|---|---|---|---|---|
Labour | Malcolm Southam | 433 | 82.2 | +9.5 | |
Conservative | Jean Watts | 94 | 17.8 | +0.5 | |
Majority | 339 | 64.4 | +9.0 | ||
Turnout | 527 | 14.1 | |||
Labour hold | Swing |
Party | Candidate | Votes | % | ± | |
---|---|---|---|---|---|
Labour | Andrew Smith | 447 | 67.7 | +8.6 | |
Conservative | Maurren Pearce | 123 | 18.6 | -8.6 | |
Liberal Democrat | David Coward | 90 | 13.6 | -0.1 | |
Majority | 324 | 49.1 | +17.2 | ||
Turnout | 660 | 16.0 | |||
Labour hold | Swing |
Party | Candidate | Votes | % | ± | |
---|---|---|---|---|---|
Labour | Peter Harris | 388 | 44.9 | -11.9 | |
Conservative | Mark Harrison | 378 | 43.7 | +17.8 | |
Liberal Democrat | John Livermore | 99 | 11.4 | +1.3 | |
Majority | 10 | 1.2 | -29.7 | ||
Turnout | 865 | 14.4 | |||
Labour hold | Swing |
The 2006 Barnet Council election took place on 4 May 2006 to elect members of Barnet London Borough Council in London, England. The whole council was up for election and the Conservative party stayed in overall control of the council.
The 2007 Thurrock Council election took place on 3 May 2007 to elect members of Thurrock Council in Essex, England. One third of the council was up for election and the Conservative party lost overall control of the council to no overall control.
Elections to Hartlepool Borough Council in the ceremonial county of County Durham in England were held on 2 May 2002. One third of the council was up for election and the council stayed under no overall control. At the same time an election took place for a directly elected mayor, which was won by independent candidate Stuart Drummond.
The 2003 Worthing Borough Council election took place on 1 May 2003 to elect members of Worthing Borough Council in West Sussex, England. One third of the council was up for election and the Liberal Democrats lost overall control of the council to no overall control. Overall turnout was 28.61%.
The 2008 Solihull Metropolitan Borough Council election took place on 1 May 2008 to elect members of Solihull Metropolitan Borough Council in the West Midlands, England. One third of the council was up for election and the Conservative party gained overall control of the council from no overall control.
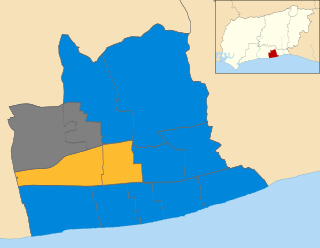
The 2007 Worthing Borough Council election took place on 3 May 2007 to elect members of Worthing Borough Council in West Sussex, England. One third of the council was up for election and the Conservative party stayed in overall control of the council.
The 2002 St Albans City and District Council election took place on 2 May 2002 to elect members of St Albans District Council in Hertfordshire, England. One third of the council was up for election and the council stayed under no overall control.
The 2007 St Albans City and District Council election took place on 3 May 2007 to elect members of St Albans District Council in Hertfordshire, England. One third of the council was up for election and the Liberal Democrats lost overall control of the council to no overall control.
The 2000 Burnley Borough Council election took place on 4 May 2000 to elect members of Burnley Borough Council in Lancashire, England. One third of the council was up for election and the Labour party lost overall control of the council to no overall control.
The 2008 Woking Council election took place on 1 May 2008 to elect members of Woking Borough Council in Surrey, England. One third of the council was up for election and the Conservative party stayed in overall control of the council.
The 2003 South Tyneside Metropolitan Borough Council election took place on 1 May 2003 to elect members of South Tyneside Metropolitan Borough Council in Tyne and Wear, England. One third of the council was up for election and the Labour party kept overall control of the council.
The 2010 Barnet Council election took place on 6 May 2010 to elect members of Barnet London Borough Council in London, England. The whole council was up for election and the Conservative party stayed in overall control of the council.
The 2010 Weymouth and Portland Borough Council election took place on 6 May 2010 to elect members of Weymouth and Portland Borough Council in Dorset, England. One third of the council was up for election and the council stayed under no overall control.
The 2002 Rushmoor Council election took place on 2 May 2002 to elect members of Rushmoor Borough Council in Hampshire, England. The whole council was up for election with boundary changes since the last election in 2000 reducing the number of seats by 3. The Conservative party stayed in overall control of the council.
The 2006 Solihull Metropolitan Borough Council election took place on 4 May 2006 to elect members of Solihull Metropolitan Borough Council in the West Midlands, England. One third of the council was up for election and the Conservative party stayed in overall control of the council.
The 2007 Solihull Metropolitan Borough Council election took place on 4 May 2007 to elect members of Solihull Metropolitan Borough Council in the West Midlands, England. One third of the council was up for election and the Conservative party lost overall control of the council to no overall control.
The 2002 Sunderland Council election took place on 2 May 2002 to elect members of Sunderland Metropolitan Borough Council in Tyne and Wear, England. One third of the council was up for election and the Labour party stayed in overall control of the council.
The 2002 Harrogate Council election took place on 2 May 2002 to elect members of Harrogate Borough Council in North Yorkshire, England. The whole council was up for election with boundary changes since the last election in 2000 reducing the number of seats by 5. The Liberal Democrats lost overall control of the council to no overall control.
The 2007 Maidstone Borough Council election took place on 3 May 2007 to elect members of Maidstone Borough Council in Kent, England. One third of the council was up for election and the council stayed under no overall control.
The 2007 Christchurch Borough Council election took place on 3 May 2007 to elect members of Christchurch Borough Council in Dorset, England. The whole council was up for election and the Conservative party stayed in overall control of the council.