The 2006 Tunbridge Wells Borough Council election took place on 4 May 2006 to elect members of Tunbridge Wells Borough Council in Kent, England. One third of the council was up for election and the Conservative party stayed in overall control of the council. [1]
Borough status in the United Kingdom is granted by royal charter to local government districts in England, Wales and Northern Ireland. The status is purely honorary, and does not give any additional powers to the council or inhabitants of the district. In Scotland, similarly chartered communities were known as royal burghs, although the status is no longer granted.
Kent is a county in South East England and one of the home counties. It borders Greater London to the north west, Surrey to the west and East Sussex to the south west. The county also shares borders with Essex along the estuary of the River Thames, and with the French department of Pas-de-Calais through the Channel Tunnel. The county town is Maidstone.
England is a country that is part of the United Kingdom. It shares land borders with Wales to the west and Scotland to the north-northwest. The Irish Sea lies west of England and the Celtic Sea lies to the southwest. England is separated from continental Europe by the North Sea to the east and the English Channel to the south. The country covers five-eighths of the island of Great Britain, which lies in the North Atlantic, and includes over 100 smaller islands, such as the Isles of Scilly and the Isle of Wight.
After the election, the composition of the council was
Party | Seats | Gains | Losses | Net gain/loss | Seats % | Votes % | Votes | +/− | |
---|---|---|---|---|---|---|---|---|---|
Conservative | 14 | 2 | 0 | +2 | 87.5 | 58.9 | 14,301 | +6.1% | |
Liberal Democrat | 2 | 0 | 2 | -2 | 12.5 | 31.6 | 7,668 | -1.5% | |
Labour | 0 | 0 | 0 | 0 | 0 | 5.6 | 1,370 | -2.3% | |
Green | 0 | 0 | 0 | 0 | 0 | 2.2 | 536 | -1.6% | |
UKIP | 0 | 0 | 0 | 0 | 0 | 1.7 | 422 | -0.4% |
Party | Candidate | Votes | % | ± | |
---|---|---|---|---|---|
Conservative | Peter Davies | 1,183 | 60.7 | +8.4 | |
Liberal Democrat | Winifred Honnywill | 603 | 30.9 | -3.2 | |
UKIP | Oliver Clement | 163 | 8.4 | -5.2 | |
Majority | 580 | 29.8 | +11.6 | ||
Turnout | 1,949 | 38.6 | -4.3 | ||
Conservative hold | Swing |
Party | Candidate | Votes | % | ± | |
---|---|---|---|---|---|
Conservative | Sally-Ann Slade | 1,096 | 79.1 | +17.4 | |
Liberal Democrat | John Billingham | 290 | 20.9 | -4.7 | |
Majority | 806 | 58.2 | +22.1 | ||
Turnout | 1,386 | 37.6 | -6.5 | ||
Conservative hold | Swing |
Party | Candidate | Votes | % | ± | |
---|---|---|---|---|---|
Liberal Democrat | Peter Crawford | 503 | 46.1 | +9.9 | |
Conservative | David Stanyer | 486 | 44.6 | -1.6 | |
UKIP | Theresa Theophanides | 101 | 9.3 | -0.6 | |
Majority | 17 | 1.5 | |||
Turnout | 1,090 | 37.6 | -3.4 | ||
Liberal Democrat hold | Swing |
Party | Candidate | Votes | % | ± | |
---|---|---|---|---|---|
Conservative | Leonard Price | 981 | 58.6 | +4.0 | |
Liberal Democrat | Paul Beard | 450 | 26.9 | +3.6 | |
Green | Brian Leslie | 244 | 14.6 | +3.9 | |
Majority | 531 | 31.7 | +0.4 | ||
Turnout | 1,675 | 34.9 | -2.4 | ||
Conservative hold | Swing |
Party | Candidate | Votes | % | ± | |
---|---|---|---|---|---|
Conservative | John Cunningham | 1,064 | 69.9 | +4.4 | |
Liberal Democrat | Keith Brown | 458 | 30.1 | +4.8 | |
Majority | 606 | 39.8 | -0.4 | ||
Turnout | 1,522 | 34.9 | -7.0 | ||
Conservative hold | Swing |
Party | Candidate | Votes | % | ± | |
---|---|---|---|---|---|
Conservative | David Marriott | 603 | 64.8 | +26.8 | |
Liberal Democrat | Lorraine Braam | 207 | 22.2 | -13.8 | |
Labour | Timothy Rich | 121 | 13.0 | -8.4 | |
Majority | 396 | 42.6 | +40.6 | ||
Turnout | 931 | 30.9 | +5.8 | ||
Conservative hold | Swing |
Party | Candidate | Votes | % | ± | |
---|---|---|---|---|---|
Conservative | Elizabeth Thomas | 525 | 60.6 | +3.4 | |
Labour | Raymond Moon | 183 | 21.1 | +4.3 | |
UKIP | Victor Webb | 158 | 18.2 | +18.2 | |
Majority | 342 | 39.5 | +8.3 | ||
Turnout | 866 | 30.1 | +7.2 | ||
Conservative hold | Swing |
Party | Candidate | Votes | % | ± | |
---|---|---|---|---|---|
Conservative | James Scholes | 1,156 | 68.6 | +2.3 | |
Liberal Democrat | Jane Johnson | 529 | 31.4 | -2.3 | |
Majority | 627 | 37.2 | +4.6 | ||
Turnout | 1,685 | 35.0 | -5.4 | ||
Conservative hold | Swing |
Party | Candidate | Votes | % | ± | |
---|---|---|---|---|---|
Conservative | Catherine Mayhew | 1,250 | 63.9 | +9.1 | |
Liberal Democrat | Peter Hillier | 707 | 36.1 | +5.1 | |
Majority | 543 | 27.8 | +4.0 | ||
Turnout | 1,957 | 38.2 | -4.2 | ||
Conservative hold | Swing |
Party | Candidate | Votes | % | ± | |
---|---|---|---|---|---|
Conservative | Michael Tompsett | 1,124 | 56.2 | -1.5 | |
Liberal Democrat | Thomas Symondson | 877 | 43.8 | +10.0 | |
Majority | 247 | 12.4 | -11.5 | ||
Turnout | 2,001 | 44.7 | +1.6 | ||
Conservative gain from Liberal Democrat | Swing | ||||
Party | Candidate | Votes | % | ± | |
---|---|---|---|---|---|
Liberal Democrat | David Neve | 776 | 65.5 | +5.2 | |
Conservative | Christopher Browne | 273 | 23.1 | -3.1 | |
Green | Richard Leslie | 135 | 11.4 | +11.4 | |
Majority | 503 | 42.4 | +8.3 | ||
Turnout | 1,184 | 35.6 | +1.6 | ||
Liberal Democrat hold | Swing |
Party | Candidate | Votes | % | ± | |
---|---|---|---|---|---|
Conservative | Christopher Woodward | 760 | 44.7 | +7.1 | |
Liberal Democrat | Lesley Herriot | 636 | 37.4 | -4.5 | |
Green | Phyllis Leslie | 157 | 9.2 | +1.8 | |
Labour | Keith Hamm | 146 | 8.6 | +0.0 | |
Majority | 124 | 7.3 | +3.0 | ||
Turnout | 1,699 | 35.5 | +0.2 | ||
Conservative gain from Liberal Democrat | Swing | ||||
Party | Candidate | Votes | % | ± | |
---|---|---|---|---|---|
Conservative | Edward Jolley | 754 | 53.7 | +0.3 | |
Liberal Democrat | Alan Bullion | 399 | 28.4 | +7.0 | |
Labour | Jemima Blackmore | 252 | 17.9 | -7.4 | |
Majority | 355 | 25.3 | -2.8 | ||
Turnout | 1,405 | 30.9 | -0.6 | ||
Conservative hold | Swing |
Party | Candidate | Votes | % | ± | |
---|---|---|---|---|---|
Conservative | Colin Bothwell | 849 | 49.4 | +10.6 | |
Labour | Dianne Hill | 561 | 32.7 | -4.5 | |
Liberal Democrat | Marguerita Morton | 308 | 17.9 | +2.1 | |
Majority | 188 | 16.7 | +15.1 | ||
Turnout | 1,718 | 33.7 | -0.5 | ||
Conservative hold | Swing |
Party | Candidate | Votes | % | ± | |
---|---|---|---|---|---|
Conservative | Michael Rusbridge | 797 | 57.8 | +11.4 | |
Liberal Democrat | Terence Driscoll | 474 | 34.4 | -14.0 | |
Labour | Gregory Lay | 107 | 7.8 | +7.8 | |
Majority | 323 | 23.4 | |||
Turnout | 1,378 | 45.1 | +7.1 | ||
Conservative hold | Swing |
Party | Candidate | Votes | % | ± | |
---|---|---|---|---|---|
Conservative | Melvyn Howell | 1,400 | 75.6 | +4.9 | |
Liberal Democrat | Ian Williams | 451 | 24.4 | -4.9 | |
Majority | 949 | 51.2 | +9.8 | ||
Turnout | 1,851 | 42.3 | -2.4 | ||
Conservative hold | Swing |
Royal Tunbridge Wells, previously just Tunbridge Wells, is a town in western Kent, England, 30 miles (48 km) south-east of central London, close to the border with East Sussex upon the northern edge of the High Weald, whose sandstone geology is exemplified by the rock formations at the Wellington Rocks and High Rocks.
One third of Tunbridge Wells Borough Council in Kent, England is elected each year, followed by one year without election. Since the last boundary changes in 2002, 48 councillors have been elected from 20 wards.
The 1998 Tunbridge Wells Borough Council election took place on 7 May 1998 to elect members of Tunbridge Wells Borough Council in Kent, England. One third of the council was up for election and the Conservative party gained overall control of the council from no overall control.
The 1999 Tunbridge Wells Borough Council election took place on 6 May 1999 to elect members of Tunbridge Wells Borough Council in Kent, England. One third of the council was up for election and the Conservative party stayed in overall control of the council.
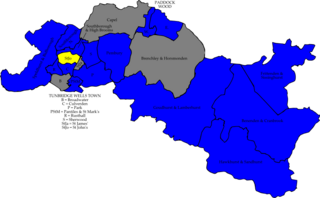
The 2000 Tunbridge Wells Borough Council election took place on 4 May 2000 to elect members of Tunbridge Wells Borough Council in Kent, England. One third of the council was up for election and the Conservative party stayed in overall control of the council.
The 2002 Tunbridge Wells Council election took place on 2 May 2002 to elect members of Tunbridge Wells Borough Council in Kent, England. The whole council was up for election with boundary changes since the last election in 2000. The Conservative party stayed in overall control of the council.
The 2003 Tunbridge Wells Borough Council election took place on 1 May 2003 to elect members of Tunbridge Wells Borough Council in Kent, England. One third of the council was up for election and the Conservative party stayed in overall control of the council.
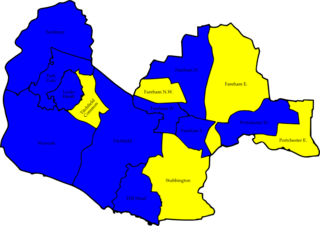
The 2004 Tunbridge Wells Borough Council election took place on 10 June 2004 to elect members of Tunbridge Wells Borough Council in Kent, England. One third of the council was up for election and the Conservative party stayed in overall control of the council.
The 2007 Tunbridge Wells Borough Council election took place on 3 May 2007 to elect members of Tunbridge Wells Borough Council in Kent, England. One third of the council was up for election and the Conservative party stayed in overall control of the council.
The 2006 Welwyn Hatfield District Council election took place on 4 May 2006 to elect members of Welwyn Hatfield District Council in Hertfordshire, England. One third of the council was up for election and the Conservative party stayed in overall control of the council.
The 2006 Southend-on-Sea Council election took place on 4 May 2006 to elect members of Southend-on-Sea Unitary Council in Essex, England. One third of the council was up for election and the Conservative party stayed in overall control of the council.
The 2006 Rushmoor Council election took place on 4 May 2006 to elect members of Rushmoor Borough Council in Hampshire, England. One third of the council was up for election and the Conservative party stayed in overall control of the council.
The 1999 Cheltenham Council election took place on 6 May 1999 to elect members of Cheltenham Borough Council in Gloucestershire, England. One third of the council was up for election and the Liberal Democrats lost overall control of the council to no overall control.
The 2000 Fareham Council election took place on 4 May 2000 to elect members of Fareham Borough Council in Hampshire, England. One third of the council was up for election and the Conservative party stayed in overall control of the council.
The 2006 Fareham Council election took place on 4 May 2006 to elect members of Fareham Borough Council in Hampshire, England. Half of the council was up for election and the Conservative party stayed in overall control of the council.
The 2008 Tunbridge Wells Borough Council election took place on 1 May 2008 to elect members of Tunbridge Wells Borough Council in Kent, England. One third of the council was up for election and the Conservative party stayed in overall control of the council.
The 2010 Tunbridge Wells Borough Council election took place on 6 May 2010 to elect members of Tunbridge Wells Borough Council in Kent, England. One third of the council was up for election and the Conservative party stayed in overall control of the council.
The 2006 Solihull Metropolitan Borough Council election took place on 4 May 2006 to elect members of Solihull Metropolitan Borough Council in the West Midlands, England. One third of the council was up for election and the Conservative party stayed in overall control of the council.
The 2006 Maidstone Borough Council election took place on 4 May 2006 to elect members of Maidstone Borough Council in Kent, England. One third of the council was up for election and the council stayed under no overall control.
Tunbridge Wells Borough Council is the local authority for the Borough of Tunbridge Wells.