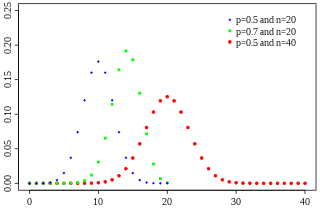
In probability theory and statistics, the binomial distribution with parameters n and p is the discrete probability distribution of the number of successes in a sequence of n independent experiments, each asking a yes–no question, and each with its own Boolean-valued outcome: success or failure. A single success/failure experiment is also called a Bernoulli trial or Bernoulli experiment, and a sequence of outcomes is called a Bernoulli process; for a single trial, i.e., n = 1, the binomial distribution is a Bernoulli distribution. The binomial distribution is the basis for the popular binomial test of statistical significance.

In probability theory and statistics, the cumulative distribution function (CDF) of a real-valued random variable , or just distribution function of , evaluated at , is the probability that will take a value less than or equal to .

In statistics, a normal distribution or Gaussian distribution is a type of continuous probability distribution for a real-valued random variable. The general form of its probability density function is

A random variable is a mathematical formalization of a quantity or object which depends on random events. The term 'random variable' can be misleading as it is not actually random or a variable, but rather it is a mapping or a function from possible outcomes in a sample space to a measurable space, often to the real numbers.
In probability theory, the central limit theorem (CLT) establishes that, in many situations, for independent and identically distributed random variables, the sampling distribution of the standardized sample mean tends towards the standard normal distribution even if the original variables themselves are not normally distributed.

In probability theory and statistics, the negative binomial distribution is a discrete probability distribution that models the number of failures in a sequence of independent and identically distributed Bernoulli trials before a specified (non-random) number of successes occurs. For example, we can define rolling a 6 on a dice as a success, and rolling any other number as a failure, and ask how many failure rolls will occur before we see the third success. In such a case, the probability distribution of the number of failures that appear will be a negative binomial distribution.

In probability theory and statistics, the geometric distribution is either one of two discrete probability distributions:

In mathematics and computer science, the floor function is the function that takes as input a real number x, and gives as output the greatest integer less than or equal to x, denoted ⌊x⌋ or floor(x). Similarly, the ceiling function maps x to the least integer greater than or equal to x, denoted ⌈x⌉ or ceil(x).
Golomb coding is a lossless data compression method using a family of data compression codes invented by Solomon W. Golomb in the 1960s. Alphabets following a geometric distribution will have a Golomb code as an optimal prefix code, making Golomb coding highly suitable for situations in which the occurrence of small values in the input stream is significantly more likely than large values.
In probability theory, Chebyshev's inequality guarantees that, for a wide class of probability distributions, no more than a certain fraction of values can be more than a certain distance from the mean. Specifically, no more than 1/k2 of the distribution's values can be k or more standard deviations away from the mean. The rule is often called Chebyshev's theorem, about the range of standard deviations around the mean, in statistics. The inequality has great utility because it can be applied to any probability distribution in which the mean and variance are defined. For example, it can be used to prove the weak law of large numbers.
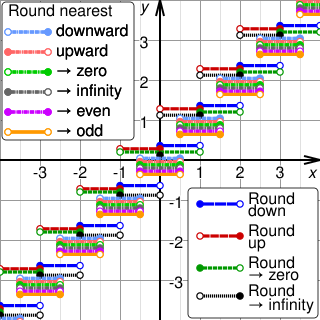
Rounding means replacing a number with an approximate value that has a shorter, simpler, or more explicit representation. For example, replacing $23.4476 with $23.45, the fraction 312/937 with 1/3, or the expression √2 with 1.414.

In probability theory and statistics, the Bernoulli distribution, named after Swiss mathematician Jacob Bernoulli, is the discrete probability distribution of a random variable which takes the value 1 with probability and the value 0 with probability . Less formally, it can be thought of as a model for the set of possible outcomes of any single experiment that asks a yes–no question. Such questions lead to outcomes that are boolean-valued: a single bit whose value is success/yes/true/one with probability p and failure/no/false/zero with probability q. It can be used to represent a coin toss where 1 and 0 would represent "heads" and "tails", respectively, and p would be the probability of the coin landing on heads. In particular, unfair coins would have
In mathematics, the moments of a function are certain quantitative measures related to the shape of the function's graph. If the function represents mass density, then the zeroth moment is the total mass, the first moment is the center of mass, and the second moment is the moment of inertia. If the function is a probability distribution, then the first moment is the expected value, the second central moment is the variance, the third standardized moment is the skewness, and the fourth standardized moment is the kurtosis. The mathematical concept is closely related to the concept of moment in physics.

The Skellam distribution is the discrete probability distribution of the difference of two statistically independent random variables and each Poisson-distributed with respective expected values and . It is useful in describing the statistics of the difference of two images with simple photon noise, as well as describing the point spread distribution in sports where all scored points are equal, such as baseball, hockey and soccer.

In probability theory and statistics, the continuous uniform distributions or rectangular distributions are a family of symmetric probability distributions. Such a distribution describes an experiment where there is an arbitrary outcome that lies between certain bounds. The bounds are defined by the parameters, and which are the minimum and maximum values. The interval can either be closed or open. Therefore, the distribution is often abbreviated where stands for uniform distribution. The difference between the bounds defines the interval length; all intervals of the same length on the distribution's support are equally probable. It is the maximum entropy probability distribution for a random variable under no constraint other than that it is contained in the distribution's support.

In statistics, an empirical distribution function is the distribution function associated with the empirical measure of a sample. This cumulative distribution function is a step function that jumps up by 1/n at each of the n data points. Its value at any specified value of the measured variable is the fraction of observations of the measured variable that are less than or equal to the specified value.

In probability theory and statistics, the beta-binomial distribution is a family of discrete probability distributions on a finite support of non-negative integers arising when the probability of success in each of a fixed or known number of Bernoulli trials is either unknown or random. The beta-binomial distribution is the binomial distribution in which the probability of success at each of n trials is not fixed but randomly drawn from a beta distribution. It is frequently used in Bayesian statistics, empirical Bayes methods and classical statistics to capture overdispersion in binomial type distributed data.

In probability theory and statistics, the Poisson distribution is a discrete probability distribution that expresses the probability of a given number of events occurring in a fixed interval of time or space if these events occur with a known constant mean rate and independently of the time since the last event. It is named after French mathematician Siméon Denis Poisson. The Poisson distribution can also be used for the number of events in other specified interval types such as distance, area, or volume.

In probability theory and statistics, the Hermite distribution, named after Charles Hermite, is a discrete probability distribution used to model count data with more than one parameter. This distribution is flexible in terms of its ability to allow a moderate over-dispersion in the data.
The Borel distribution is a discrete probability distribution, arising in contexts including branching processes and queueing theory. It is named after the French mathematician Émile Borel.


