Wellingborough and Rushden (UK Parliament constituency)

Last updated

Wellingborough and Rushden
County constituency
for the House of Commons
Wellingborough and Rushden (UK Parliament constituency)
Boundaries since 2024
East Midlands - Wellingborough and Rushden constituency.svg
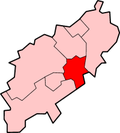
Boundary of Wellingborough and Rushden in the East Midlands
County Northamptonshire
Electorate 76,669 (2023) [1]
Major settlements Wellingborough, Rushden, Higham Ferrers, Irchester and Finedon
Current constituency
Created 1918 (as Wellingborough)
Member of Parliament Gen Kitchen (Labour)
Created from East Northamptonshire and North Northamptonshire

Wellingborough and Rushden is a constituency in Northamptonshire represented in the House of Commons of the UK Parliament. The seat is currently held by Labour MP Gen Kitchen, after the recall of MP Peter Bone in December 2023 which resulted in a by-election in February 2024.

Contents

Prior to the 2023 Periodic Review of Westminster constituencies, the constituency was known as Wellingborough up until the 2024 general election. [2]

History

This seat was created under the Representation of the People Act 1918.

Political history

Wellingborough's earliest years were left-leaning. Between 1964 and 2005, the seat kept on producing examples of bellwether results and rarely showed itself to be safe for more than one government term. Departing from this are two years where the result has defied the most common result nationwide, by leaning towards the Conservative Party, in 1974 (twice). Since 2010 it became a safe seat for the Conservatives until the 2024 by-election.

In the 2016 EU referendum, Wellingborough voted 62.4% leave (25,679 votes) to 37.6% remain (15,462 votes) [3]

Prominent frontbenchers

Sir Geoffrey Shakespeare was a Lloyd-Georgist National Liberal who served in junior ministerial roles through much of the Second World War, including briefly as the Secretary for Overseas Trade in 1940.

Boundaries

Historic (Wellingborough)

Wellingborough and Rushden (UK Parliament constituency)
Map of boundaries 2010-2024

1918–1950: The Borough of Higham Ferrers, the Urban Districts of Finedon, Irthlingborough, Raunds, Rushden, and Wellingborough, the Rural District of Wellingborough, and in the Rural District of Thrapston the parishes of Chelveston cum Caldecott, Hargrave, and Stanwick.

1950–1974: The Borough of Higham Ferrers, the Urban Districts of Irthlingborough, Raunds, Rushden, and Wellingborough, the Rural District of Wellingborough, and in the Rural District of Oundle and Thrapston the civil parishes of Chelveston cum Caldecott and Hargrave.

1974–1983: The Borough of Higham Ferrers, the Urban Districts of Irthlingborough, Oundle, Raunds, Rushden, and Wellingborough, and the Rural Districts of Oundle and Thrapston, and Wellingborough. [4]

1983–2010: The Borough of Wellingborough, and the District of East Northamptonshire wards of Higham Ferrers, Rushden East, Rushden North, Rushden South, and Rushden West.

2010–2021: The Borough of Wellingborough wards of Brickhill, Castle, Croyland, Finedon, Great Doddington and Wilby, Hemmingwell, Irchester, North, Queensway, Redwell East, Redwell West, South, Swanspool, and Wollaston, and the District of East Northamptonshire wards of Higham Ferrers, Rushden East, Rushden North, Rushden South, and Rushden West.

2021–2024: With effect from 1 April 2021, the Borough of Wellingborough and the District of East Northamptonshire were abolished and absorbed into the new unitary authority of North Northamptonshire. [5] From that date, the constituency comprised the District of North Northamptonshire wards of Brickhill and Queensway, Croyland and Swanspool; Earls Barton (part), Finedon, Hatton Park, Higham Ferrers, Irchester, Irthlingborough, Rushden Pemberton West and Rushden South.

Current (Wellingborough and Rushden)

Further to the 2023 Periodic Review of Westminster constituencies, which came into effect for the 2024 general election, the composition of the constituency is as follows (as they existed on 1 April 2021):

The parts of the Earls Barton ward were transferred to Daventry. In addition, parts of the Irchester ward were transferred to South Northamptonshire, whilst the parts of the Irthlingborough ward were transferred in from Corby.

The constituency is named after the towns of Wellingborough and Rushden. It also includes the small town of Higham Ferrers, which was itself a borough constituency also named Higham Ferrers until its abolition as one of the rotten boroughs in 1832.

Constituency profile

Strengths in local industries here or in neighbouring Northampton and Kettering include in printing, logistics and distribution, automotive (assembly and design), construction, food processing and advanced engineering sectors. Despite this, a decline in the traditional local industries such as quarrying, furniture making and textiles pushes workless claimants who were registered jobseekers in November 2012 higher than the national (and regional) average of 3.8%, at 4.5% of the population based on a statistical compilation by The Guardian . [7]

Members of Parliament

East Northamptonshire and North Northamptonshire prior to 1918

ElectionMember [8] Party
1918 Walter Smith Labour
1922 Geoffrey Shakespeare National Liberal
1923 William Cove Labour
1929 George Dallas Labour
1931 Archibald James Conservative
1945 George Lindgren Labour
1959 Michael Hamilton Conservative
1964 Harry Howarth Labour
1969 by-election Peter Fry Conservative
1997 Paul Stinchcombe Labour
2005 Peter Bone Conservative
2023 Independent [9]
2024 by-election Gen Kitchen Labour
Renamed as Wellingborough and Rushden
2024 Gen Kitchen Labour

Elections

Wellingborough & Rushden election results 1983-2024 Wellingborough & Rushden Election Results.png
Wellingborough & Rushden election results 1983-2024

Elections in the 2020s

General election 2024: Wellingborough and Rushden [10]
PartyCandidateVotes%±%
Labour Gen Kitchen 17,734 40.3 +12.0
Conservative David Goss12,24827.8−34.6
Reform UK Ben Habib 9,45621.5N/A
Green Paul Mannion2,7046.1+3.4
Liberal Democrats Christopher Townsend1,5703.6−3.1
SDP Jeremy Brittin2730.6N/A
Majority5,48612.5New
Turnout 43,98556.9Decrease2.svg4.7
Registered electors 77,559
Labour gain from Conservative Swing Increase2.svg23.3
2024 Wellingborough by-election [11]
PartyCandidateVotes%±%
Labour Gen Kitchen 13,844 45.9 +19.4
Conservative Helen Harrison7,40824.6−37.6
Reform UK Ben Habib 3,91913.0New
Liberal Democrats Ana Gunn1,4224.7−3.2
Independent Marion Turner-Hawes1,1153.7New
Green Will Morris1,0203.4−0.1
Independent Kevin Watts5331.8New
Britain First Alex Merola4771.6New
Monster Raving Loony Nick the Flying Brick2170.7New
Independent Andre Pyne-Bailey1720.6New
Independent Ankit Post-Mortem180.1New
Majority6,43621.3N/A
Turnout 30,14538.0−26.3
Registered electors 79,376
Labour gain from Conservative Swing +28.5

Elections in the 2010s

2019 general election: Wellingborough [12]
PartyCandidateVotes%±%
Conservative Peter Bone 32,277 62.2 +4.8
Labour Andrea Watts13,73726.5–7.5
Liberal Democrats Suzanna Austin4,0787.9+4.6
Green Marion Turner-Hawes1,8213.5+1.7
Majority18,54035.7+12.3
Turnout 51,91364.3–2.9
Conservative hold Swing +6.15
2017 general election: Wellingborough [13] [14]
PartyCandidateVotes%±%
Conservative Peter Bone 30,579 57.4 +5.3
Labour Andrea Watts18,11934.0+14.5
UKIP Alan Shipham1,8043.4–16.2
Liberal Democrats Chris Nelson1,7823.3–1.1
Green Jonathan Hornett9561.8–2.6
Majority12,46023.4–9.1
Turnout 53,24067.2+1.8
Conservative hold Swing –4.55
2015 general election: Wellingborough [15] [16]
PartyCandidateVotes%±%
Conservative Peter Bone 26,265 52.1 +3.9
UKIP Jonathan Munday [17] 9,86819.6+16.4
Labour Richard Garvie 19,83919.5–5.9
Liberal Democrats Chris Nelson2,2404.4–12.7
Green Marion-Turner-Hawes2,2184.4+3.5
Majority16,39732.5+9.7
Turnout 50,43065.4–1.8
Conservative hold Swing –6.3

1: After nominations were closed, Garvie was suspended from the Labour Party after he was convicted of fraud after buying £900 of train tickets with a closed bank account. [18] He still appeared on ballot papers as Labour.

2010 general election: Wellingborough [13] [14]
PartyCandidateVotes%±%
Conservative Peter Bone 24,918 48.2 +5.5
Labour Jayne Buckland13,13125.4–16.0
Liberal Democrats Kevin Barron8,84817.1+5.6
UKIP Adrian Haynes1,6363.2+0.9
BNP Rob Walker1,5963.1New
English Democrat Terry Spencer5301.0New
Green Jonathan Hornett4800.9New
TUSC Paul Crofts2490.5New
Independent Gary Donaldson2400.5New
Independent Marcus Lavin330.1New
Majority11,78722.8+21.5
Turnout 51,66167.2+1.4
Conservative hold Swing +10.8

Elections in the 2000s

2005 general election: Wellingborough [19]
PartyCandidateVotes%±%
Conservative Peter Bone 22,674 42.8 +0.6
Labour Paul Stinchcombe 21,98741.5–5.3
Liberal Democrats Richard Church6,14711.6+2.3
UKIP James Wrench1,2142.3+0.6
Veritas Nicholas Alex7491.4New
Socialist Labour Andy Dickson2340.4New
Majority6871.3N/A
Turnout 53,00566.5+2.4
Conservative gain from Labour Swing +2.9
2001 general election: Wellingborough [20]
PartyCandidateVotes%±%
Labour Paul Stinchcombe 23,867 46.8 +2.6
Conservative Peter Bone 21,51242.2–1.6
Liberal Democrats Peter Gaskell4,7639.3–0.1
UKIP Tony Ellwood8641.7−0.4
Majority2,3554.6+4.2
Turnout 51,00664.1–10.7
Labour hold Swing +2.1

Elections in the 1990s

1997 general election: Wellingborough [21]
PartyCandidateVotes%±%
Labour Paul Stinchcombe 24,854 44.2 +10.3
Conservative Peter Fry 24,66743.8–9.6
Liberal Democrats Peter Smith5,2799.4–3.4
UKIP Tony Ellwood1,1922.1New
Natural Law Annie Lorys2970.5New
Majority1870.4N/A
Turnout 56,28974.8–7.1
Labour gain from Conservative Swing +9.9
1992 general election: Wellingborough [22]
PartyCandidateVotes%±%
Conservative Peter Fry 32,302 53.4 +0.7
Labour Phil Sawford 20,48633.9+6.7
Liberal Democrats Julie Trevor7,71412.8–7.3
Majority11,81619.5–6.0
Turnout 60,50281.9
Conservative hold Swing –3.0

Elections in the 1980s

1987 general election: Wellingborough [23]
PartyCandidateVotes%±%
Conservative Peter Fry 29,038 52.7 +3.8
Labour James Currie14,96827.2+1.2
Liberal Leslie Stringer11,04720.1–4.6
Majority14,07025.5+2.6
Turnout 55,053
Conservative hold Swing +1.3
1983 general election: Wellingborough [24]
PartyCandidateVotes%±%
Conservative Peter Fry 25,715 48.9 –3.4
Labour John H. Mann13,65926.0–8.9
Liberal Leslie Stringer12,99424.7+12.9
Independent D.M.P. Garnett2280.4+0.1
Majority12,05622.9+5.5
Turnout 52,596
Conservative hold Swing +2.8

Elections in the 1970s

1979 general election: Wellingborough
PartyCandidateVotes%±%
Conservative Peter Fry 37,812 52.3 +9.5
Labour D.A. Forwood25,27834.9–5.3
Liberal L.E. Stringer8,50611.8–5.2
National Front S.F. Wright5290.7New
Independent D.M.P. Garnett2280.3New
Majority12,53417.4+14.8
Turnout 72,35381.25+1.6
Conservative hold Swing +7.4
October 1974 general election: Wellingborough
PartyCandidateVotes%±%
Conservative Peter Fry 29,078 42.8 +2.3
Labour John H. Mann27,32040.2+2.9
Liberal Penelope Jessel 11,50017.0–3.9
Majority1,7582.6–0.6
Turnout 67,89879.61–5.39
Conservative hold Swing –0.3
February 1974 general election: Wellingborough
PartyCandidateVotes%±%
Conservative Peter Fry 29,099 40.5 –11.7
Labour John H. Mann26,82937.3–10.5
Liberal Penelope Jessel 15,04920.9New
Ind. Conservative D.T. James8971.2New
Majority2,7203.2–1.3
Turnout 71,87485.00–1.34
Conservative hold Swing –0.6
1970 general election: Wellingborough
PartyCandidateVotes%±%
Conservative Peter Fry 27,459 52.2 +4.6
Labour John H. Mann25,10747.8–4.6
Majority2,3524.4N/A
Turnout 52,56681.34–5.12
Conservative hold Swing +4.6

Elections in the 1960s

1969 Wellingborough by-election
PartyCandidateVotes%±%
Conservative Peter Fry 22,548 54.4 +6.8
Labour John H. Mann16,49939.8–7.8
Independent M.P. Coney2,4215.8New
Majority6,04914.6N/A
Turnout 41,468
Conservative gain from Labour Swing +7.3
1966 general election: Wellingborough
PartyCandidateVotes%±%
Labour Harry Howarth 24,705 52.4 +10.1
Conservative John Lawson Leatham22,47247.6+5.4
Majority2,2334.8+4.7
Turnout 54,56686.46–0.6
Labour hold Swing
1964 general election: Wellingborough
PartyCandidateVotes%±%
Labour Harry Howarth 19,592 42.26 –7.17
Conservative Michael Hamilton 19,54542.16–8.51
Liberal Philip Arthur John Pettit7,22715.59New
Majority470.10N/A
Turnout 46,36487.11
Labour gain from Conservative Swing

Elections in the 1950s

1959 general election: Wellingborough
PartyCandidateVotes%±%
Conservative Michael Hamilton 22,964 50.67 +1.61
Labour George Lindgren 22,35849.33–1.61
Majority6061.34N/A
Turnout 45,32286.72
Conservative gain from Labour Swing +1.61
1955 general election: Wellingborough
PartyCandidateVotes%±%
Labour George Lindgren 22,745 51.04 –1.35
Conservative Arthur Jones 21,81948.96+1.35
Majority9262.08
Turnout 44,56486.01
Labour hold Swing –1.35
1951 general election: Wellingborough
PartyCandidateVotes%±%
Labour George Lindgren 24,113 52.39 +5.29
Conservative F Richard Parsons21,91247.61+19.15
Majority2,2014.78
Turnout 46,02588.38
Labour hold Swing
1950 general election: Wellingborough
PartyCandidateVotes%±%
Labour George Lindgren 21,640 47.10 –10.61
Conservative Jaspar Carlisle Sayer13,07528.46–13.83
Liberal Edwin Malindine 11,22724.44New
Majority8,56518.64
Turnout 45,94289.51
Labour hold Swing

Elections in the 1940s

1945 general election: Wellingborough
PartyCandidateVotes%±%
Labour George Lindgren 22,416 57.71
Conservative Archibald James 16,42642.29
Majority5,99015.42N/A
Turnout 38,84274.39
Labour gain from Conservative Swing

Elections in the 1930s

1935 general election: Wellingborough
PartyCandidateVotes%±%
Conservative Archibald James 18,085 50.52
Labour George Dallas 17,71349.48
Majority3721.04
Turnout 35,79877.26
Conservative hold Swing
1931 general election: Wellingborough
PartyCandidateVotes%±%
Conservative Archibald James 22,127 61.02
Labour George Dallas 14,13738.98
Majority7,99022.04N/A
Turnout 36,26481.24
Conservative gain from Labour Swing

Elections in the 1920s

G. Dallas George Dallas politician 1875-1961.jpg
G. Dallas
1929 general election: Wellingborough [25]
PartyCandidateVotes%±%
Labour George Dallas 15,300 42.2 +2.2
Liberal Richard Pattinson Winfrey11,25531.0+2.2
Unionist Archibald James 9,70326.8–4.4
Majority4,04511.2+2.4
Turnout 36,25883.3–0.7
Registered electors 43,548
Labour hold Swing +0.0
1924 general election: Wellingborough [25]
PartyCandidateVotes%±%
Labour William Cove 11,381 40.0 2.1
Unionist Ralph A Raphael8,90031.2+5.8
Liberal Humphrey Mackworth Paul8,22328.8–3.7
Majority2,4818.8–0.8
Turnout 28,50484.0+4.1
Registered electors 33,934
Labour hold Swing –4.0
1923 general election: Wellingborough [25]
PartyCandidateVotes%±%
Labour William Cove 11,175 42.1 –0.3
Liberal Geoffrey Shakespeare 8,63832.5–25.1
Unionist Robert Massy-Dawson Sanders6,74725.4New
Majority2,5379.6N/A
Turnout 26,56079.9+0.5
Registered electors 33,226
Labour gain from Liberal Swing +12.4
1922 general election: Wellingborough [25]
PartyCandidateVotes%±%
National Liberal Geoffrey Shakespeare 14,995 57.6 +10.1
Labour Walter Smith 11,05742.4–8.1
Majority3,93815.2N/A
Turnout 26,05279.4+17.5
Registered electors 32,820
National Liberal gain from Labour Swing N/A

Elections in the 1910s

1918 general election: Wellingborough [25]
PartyCandidateVotes%±%
Labour Walter Smith 10,290 52.5
C Liberal Milner Gray 9,31347.5
Majority9775.0
Turnout 19,60361.9
Registered electors 31,669
Labour win (new seat)
Cindicates candidate endorsed by the coalition government.

See also

References

  1. "The 2023 Review of Parliamentary Constituency Boundaries in England – Volume two: Constituency names, designations and composition – East Midlands". Boundary Commission for England. Retrieved 3 July 2024.
  2. "The 2023 Review of Parliamentary Constituency Boundaries in England – Volume one: Report – East Midlands | Boundary Commission for England". boundarycommissionforengland.independent.gov.uk. Retrieved 25 July 2023.
  3. "EU Referendum local results – W". BBC News.
  4. "The Parliamentary Constituencies (Daventry, Wellingborough and Northampton) Order 1973", legislation.gov.uk , The National Archives, SI 1973/604, retrieved 26 February 2023
  5. "The Northamptonshire (Structural Changes) Order 2020".
  6. "The Parliamentary Constituencies Order 2023". Schedule 1 Part 1 East Midlands.
  7. Unemployment claimants by constituency The Guardian
  8. Leigh Rayment's Historical List of MPs – Constituencies beginning with "W" (part 2)
  9. Allegretti, Aubrey (17 October 2023). "Peter Bone loses Tory whip after bullying and harassment finding". The Guardian. Retrieved 17 October 2023.
  10. "Wellingborough and Rushden - General election results 2024". BBC News. Retrieved 26 July 2024.
  11. "Wellingborough Parliamentary by-election". BBC News. 16 February 2024..
  12. "Wellingborough Parliamentary constituency". BBC News. BBC. Archived from the original on 21 December 2023. Retrieved 22 November 2019.
  13. 1 2 "Election Data 2010". Electoral Calculus. Archived from the original on 26 July 2013. Retrieved 17 October 2015.
  14. 1 2 Wellingborough BBC News | Election 2010
  15. "Election Data 2015". Electoral Calculus. Archived from the original on 17 October 2015. Retrieved 17 October 2015.
  16. "Election 2015:Wellingborough Parliamentary constituency". BBC News. Retrieved 13 May 2015.
  17. "UK Polling Report".
  18. Gosling, Francesca. "Labour's candidate for Wellingborough and Rushden Richard Garvie suspended after conviction for fraud". Nothampton Chronicle & Echo.
  19. "Election Data 2005". Electoral Calculus. Archived from the original on 15 October 2011. Retrieved 18 October 2015.
  20. "Election Data 2001". Electoral Calculus. Archived from the original on 15 October 2011. Retrieved 18 October 2015.
  21. "Election Data 1997". Electoral Calculus. Archived from the original on 15 October 2011. Retrieved 18 October 2015.
  22. "Election Data 1992". Electoral Calculus. Archived from the original on 15 October 2011. Retrieved 18 October 2015.
  23. "Election Data 1987". Electoral Calculus. Archived from the original on 15 October 2011. Retrieved 18 October 2015.
  24. "Election Data 1983". Electoral Calculus. Archived from the original on 15 October 2011. Retrieved 18 October 2015.
  25. 1 2 3 4 5 Craig, F. W. S. (1983). British parliamentary election results 1918-1949 (3 ed.). Chichester: Parliamentary Research Services. ISBN   0-900178-06-X.

Sources

52°18′N0°42′W / 52.30°N 0.70°W / 52.30; -0.70