1972 United States Senate election in Oregon

Last updated

1972 United States Senate election in Oregon
Flag of Oregon.svg
  1966 November 7, 1972 1978  
  Mark Hatfield - 1967 (cropped).jpg Wayne Morse.jpg
Nominee Mark Hatfield Wayne Morse
Party Republican Democratic
Popular vote494,671425,036
Percentage53.72%46.16%

1972 United States Senate election in Oregon results map by county.svg
County results
Hatfield:     50-60%     60-70%
Morse:      50–60%

U.S. senator before election

Mark Hatfield
Republican

Elected U.S. Senator

Mark Hatfield
Republican

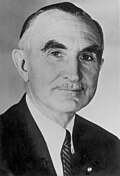
The 1972 United States Senate election in Oregon took place on November 7, 1972. Incumbent Republican Senator Mark Hatfield was re-elected to a second term in office, defeating Democrat Wayne Morse.

Contents

Primary elections

Primary elections were held on May 23, 1972.

Republican primary

Candidates

Results

Republican primary results [4] [5] [6]
PartyCandidateVotes%
Republican Mark Hatfield (incumbent) 171,594 61.16%
Republican Lynn Engdahl63,85922.76%
Republican Kenneth A. Brown30,82610.99%
Republican John E. Smets13,3974.78%
Write-inAll others9130.33%
Total votes280,589 100.00%

Democratic primary

Candidates

Results

Results by county (Democratic primary):

Wayne Morse
.mw-parser-output .legend{page-break-inside:avoid;break-inside:avoid-column}.mw-parser-output .legend-color{display:inline-block;min-width:1.25em;height:1.25em;line-height:1.25;margin:1px 0;text-align:center;border:1px solid black;background-color:transparent;color:black}.mw-parser-output .legend-text{}
50-55%
45-50%
40-45%
35-40%
Robert Duncan
45-50%
35-40% 1972 Oregon U.S. Senate election results map by county, Democratic primary.svg
Results by county (Democratic primary):
Wayne Morse
  •   50–55%
      45–50%
      40–45%
      35–40%
Robert Duncan
  •   45–50%
      35–40%
Democratic primary results [4] [5] [7]
PartyCandidateVotes%
Democratic Wayne Morse 173,147 43.70%
Democratic Robert B. Duncan 130,84533.03%
Democratic Don S. Willner74,06018.69%
Democratic Ralph Wiser17,7294.48%
Write-inAll others4230.11%
Total votes396,204 100.00%

General election

Campaign

According to the New York Times, the election provided "a choice between two well-known personalities, not issues". [8] Morse, who had supported Hatfield's 1966 campaign, was famously opposed to the Vietnam War, as was Hatfield. Thus, the election was ultimately between two well-known anti-war liberals. Hatfield won a fairly comfortable 54-46 victory, winning all but 3 counties.

Results

1972 United States Senate election in Oregon [9] [10] [11] [12]
PartyCandidateVotes%±%
Republican Mark Hatfield (Incumbent) 494,671 53.72
Democratic Wayne Morse 425,03646.16
NoneWrite-Ins1,1260.12
Majority 69,6357.56
Turnout 920,833
Republican hold Swing {{{swing}}}

See also

References

  1. "Record number of candidates file for election". Albany Democrat-Herald. Albany, Oregon. March 15, 1972. p. 1. Retrieved July 16, 2021.
  2. "Gov. McCall of Oregon Won't Oppose Hatfield". New York Times. New York, NY. March 8, 1972. p. 86. Retrieved July 16, 2021.
  3. 1 2 "Morse will oppose Hatfield". The Capital Journal. Salem, Oregon. May 24, 1972. p. 1. Retrieved July 16, 2021.
  4. 1 2 Congressional Quarterly 1998, p. 147.
  5. 1 2 America Votes 10, p. 312.
  6. "OR US Senate, 1972 - R Primary". Our Campaigns. Retrieved July 16, 2021.
  7. "OR US Senate, 1972 - D Primary". Our Campaigns. Retrieved July 16, 2021.
  8. "THE 1972 CAMPAIGN". The New York Times. October 2, 1972.
  9. Congressional Quarterly 1998, p. 95.
  10. America Votes 10, p. 307.
  11. "OR US Senate, 1972". Our Campaigns. Retrieved July 16, 2021.
  12. Clerk of the United States House of Representatives. "Statistics of the Presidential and Congressional Election of November 7, 1972" (PDF). United States Government Printing Office . Retrieved April 4, 2015 via Clerk.house.gov.

Bibliography