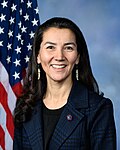
Alaska's at-large congressional district | |
---|---|
Representative | |
Area | 665,384.04 [1] sq mi (1,723,336.8 km2) |
Distribution |
|
Population (2023) | 733,406 [3] |
Median household income | $86,631 [4] |
Ethnicity |
|
Cook PVI | R+8 [5] |
Since becoming a U.S. state in 1959, Alaska has been entitled to one member in the United States House of Representatives. The representative is elected at-large, because the state has only one congressional district, encompassing its entire territory. By area, Alaska's congressional district is the largest congressional district in the United States and the third-largest electoral district represented by a single member in the world. It is exceeded by the Yakutsk district in Russia and Nunavut in Canada.
On August 31, 2022, Democrat Mary Peltola defeated Republican former governor Sarah Palin in the special election to replace Don Young, who died on March 18 of the same year and was the longest serving Republican in the history of the House and was the most notable person to represent the district. Peltola became the first Democrat elected to the House of Representatives from Alaska since 1972, and the first Alaska Native in history to be elected to the United States House of Representatives.
As of 2024, the state comprises the most Republican-leaning congressional district to be represented by a Democrat. It has a partisan lean of R+8. [5]
The district was created when Alaska achieved statehood on January 3, 1959. Given the growth of population across the nation, Alaska is still entitled to only one seat in the House of Representatives.
Voter registration as of January 3, 2021 [6] | |||||
---|---|---|---|---|---|
Party | Total voters | Percentage | |||
Unaffiliated | 338,931 | 56.52% | |||
Republican | 149,173 | 24.87% | |||
Democratic | 81,355 | 13.57% | |||
Alaskan Independence | 19,109 | 3.19% | |||
Minor parties | 11,136 | 1.85% | |||
Total | 599,704 | 100% |
Because Alaska has always had only one congressional district, these are the same as the presidential election results for the state.
Year | Office | Results |
---|---|---|
1960 | President | Richard Nixon 51% – John F. Kennedy 49% |
1964 | President | Lyndon B. Johnson 66% – Barry Goldwater 34% |
1968 | President | Richard Nixon 45% – Hubert Humphrey 43% |
1972 | President | Richard Nixon 58% – George McGovern 35% |
1976 | President | Gerald Ford 58% – Jimmy Carter 36% |
1980 | President | Ronald Reagan 54% – Jimmy Carter 26% |
1984 | President | Ronald Reagan 67% – Walter Mondale 30% |
1988 | President | George H. W. Bush 60% – Michael Dukakis 36% |
1992 | President | George H. W. Bush 39% – Bill Clinton 30% |
1996 | President | Bob Dole 51% – Bill Clinton 33% |
2000 | President | George W. Bush 59% – Al Gore 28% |
2004 | President | George W. Bush 61% – John Kerry 36% |
2008 | President | John McCain 59% – Barack Obama 38% |
2012 | President | Mitt Romney 55% – Barack Obama 41% |
2016 | President | Donald Trump 51% – Hillary Clinton 37% |
2020 | President | Donald Trump 53% – Joe Biden 43% |
2024 | President | Donald Trump 55% – Kamala Harris 41% |
Year | Republican | Democratic | Green | Libertarian | Others | Write-in [7] | ||||||||||||||||||
---|---|---|---|---|---|---|---|---|---|---|---|---|---|---|---|---|---|---|---|---|---|---|---|---|
Candidate | Votes | Pct | Candidate | Votes | Pct | Candidate | Votes | Pct | Candidate | Votes | Pct | Candidate | Votes | Pct | Votes | Pct | ||||||||
1958 | Henry A. Benson | 20,699 | 42.5% | Ralph Rivers | 27,948 | 57.5% | ||||||||||||||||||
1960 | R. L. Rettig | 25,517 | 43.2% | Ralph Rivers (Incumbent) | 33,546 | 56.8% | ||||||||||||||||||
1962 | Lowell Thomas Jr. | 26,638 | 44% | Ralph Rivers (Incumbent) | 33,953 | 56% | ||||||||||||||||||
1964 | Lowell Thomas Jr. | 32,556 | 48.5% | Ralph Rivers (Incumbent) | 34,590 | 51.5% | ||||||||||||||||||
1966 | Howard W. Pollock | 34,040 | 51.6% | Ralph Rivers (Incumbent) | 31,867 | 48.4% | ||||||||||||||||||
1968 | Howard W. Pollock (Incumbent) | 43,577 | 54.2% | Nick Begich | 36,785 | 45.8% | ||||||||||||||||||
1970 | Frank Murkowski | 35,947 | 44.9% | Nick Begich | 44,137 | 55.1% | ||||||||||||||||||
1972 | Don Young | 41,750 | 43.8% | Nick Begich (Incumbent) | 53,651 | 56.2% | ||||||||||||||||||
1973 | Don Young | 35,044 | 51.4% | Emil Notti | 33,123 | 48.6% | ||||||||||||||||||
1974 | Don Young (Incumbent) | 51,641 | 53.8% | William L. Hensley | 44,280 | 46.2% | ||||||||||||||||||
1976 | Don Young (Incumbent) | 83,722 | 70.8% | Eben Hopson | 34,194 | 28.9% | 292 | 0.2% | ||||||||||||||||
1978 | Don Young (Incumbent) | 68,811 | 55.4% | Patrick Rodey | 55,176 | 44.4% | 200 | 0.2% | ||||||||||||||||
1980 | Don Young (Incumbent) | 114,089 | 73.8% | Kevin Parnell | 39,922 | 25.8% | 607 | 0.4% | ||||||||||||||||
1982 | Don Young (Incumbent) | 128,274 | 70.8% | Dave Carlson | 52,011 | 28.7% | 799 | 0.4% | ||||||||||||||||
1984 | Don Young (Incumbent) | 113,582 | 55% | Pegge Begich | 86,052 | 41.7% | Betty Breck (I) | 6,508 | 3.2% | 295 | 0.1% | |||||||||||||
1986 | Don Young (Incumbent) | 101,799 | 56.5% | Pegge Begich | 74,053 | 41.1% | Betty Breck | 4,182 | 2.3% | 243 | 0.1% | |||||||||||||
1988 | Don Young (Incumbent) | 120,595 | 62.5% | Peter Gruenstein | 71,881 | 37.3% | 479 | 0.2% | ||||||||||||||||
1990 | Don Young (Incumbent) | 99,003 | 51.7% | John S. Devens | 91,677 | 47.8% | 967 | 0.5% | ||||||||||||||||
1992 | Don Young (Incumbent) | 111,849 | 46.8% | John S. Devens | 102,378 | 42.8% | Mike Milligan | 9,529 | 4% | Michael States (AI) | 15,049 | 6.3% | 311 | 0.1% | ||||||||||
1994 | Don Young (Incumbent) | 118,537 | 56.9% | Tony Smith | 68,172 | 32.7% | Joni Whitmore | 21,277 | 10.2% | 254 | 0.1% | |||||||||||||
1996 | Don Young (Incumbent) | 138,834 | 59.4% | Georgianna Lincoln | 85,114 | 36.4% | John J. G. Grames | 4,513 | 1.9% | William J. Nemec II (AI) | 5,017 | 2.1% | 222 | 0.1% | ||||||||||
1998 | Don Young (Incumbent) | 139,676 | 62.6% | Jim Duncan | 77,232 | 34.6% | John J. G. Grames | 5,923 | 2.7% | 469 | 0.2% | |||||||||||||
2000 | Don Young (Incumbent) | 190,862 | 69.6% | Clifford Mark Greene | 45,372 | 16.5% | Anna C. Young | 22,440 | 8.2% | Leonard J. Karpinski | 4,802 | 1.8% | Jim Dore (AI) | 10,085 | 3.7% | 832 | 0.3% | |||||||
2002 | Don Young (Incumbent) | 169,685 | 74.5% | Clifford Mark Greene | 39,357 | 17.3% | Russell deForest | 14,435 | 6.3% | Rob Clift | 3,797 | 1.7% | 291 | 0.1% | ||||||||||
2004 | Don Young (Incumbent) | 213,216 | 71.1% | Thomas M. Higgins | 67,074 | 22.4% | Timothy A. Feller | 11,434 | 3.8% | Alvin A. Anders | 7,157 | 2.4% | 1,115 | 0.4% | ||||||||||
2006 | Don Young (Incumbent) | 132,743 | 56.6% | Diane E. Benson | 93,879 | 40% | Eva Ince | 1,819 | 0.8% | Alexander Crawford | 4,029 | 1.7% | William Ratigan | 1,615 | 0.7% | 560 | 0.2% | |||||||
2008 | Don Young (Incumbent) | 158,939 | 50.1% | Ethan Berkowitz | 142,560 | 45% | Don Wright | 14,274 | 4.5% | 1,205 | 0.4% | |||||||||||||
2010 | Don Young (Incumbent) | 175,384 | 69% | Harry Crawford | 77,606 | 30.5% | 1,345 | 0.5% | ||||||||||||||||
Year | Republican | Democratic | Green | Libertarian | Others | Write-in |
Source: "Election Statistics". Office of the Clerk of the House of Representatives. Archived from the original on July 30, 2008. Retrieved August 8, 2008.
Party | Candidate | Votes | % | ±% | |
---|---|---|---|---|---|
Republican | Don Young (incumbent) | 185,296 | 63.94 | −5.02 | |
Democratic | Sharon Cissna | 82,927 | 28.62 | −1.89 | |
Libertarian | Jim McDermott | 15,028 | 5.19 | +5.19 | |
Independent | Ted Gianoutsos | 5,589 | 1.93 | +1.93 | |
Independent | Write-in votes | 964 | 0.33 | −0.20 | |
Republican hold | Swing | ||||
Turnout | 289,804 |
Party | Candidate | Votes | % | ±% | |
---|---|---|---|---|---|
Republican | Don Young (incumbent) | 142,260 | 50.95 | −12.99 | |
Democratic | Forrest Dunbar | 114,317 | 40.94 | +12.32 | |
Libertarian | Jim McDermott | 21,373 | 7.65 | +2.46 | |
Independent | Write-in votes | 1,269 | 0.45 | +0.12 | |
Republican hold | Swing | ||||
Turnout | 279,219 |
Party | Candidate | Votes | % | ±% | |
---|---|---|---|---|---|
Republican | Don Young (incumbent) | 155,088 | 50.32 | −0.63 | |
Democratic | Steve Lindbeck | 111,019 | 36.02 | −4.92 | |
Libertarian | Jim McDermott | 31,770 | 10.31 | +2.66 | |
Independent | Bernie Souphanavong | 9,093 | 2.95 | +2.95 | |
Independent | Write-in votes | 1,228 | 0.40 | −0.05 | |
Republican hold | Swing | ||||
Turnout | 308,198 |
Party | Candidate | Votes | % | ±% | |
---|---|---|---|---|---|
Republican | Don Young (incumbent) | 149,779 | 53.08 | +2.76% | |
Independent | Alyse S. Galvin [a] | 131,199 | 46.50 | +10.48% | |
Write-in | 1,188 | 0.42 | +0.02% | ||
Total votes | 282,166 | 100 | N/A |
Party | Candidate | Votes | % | ±% | |
---|---|---|---|---|---|
Republican | Don Young (incumbent) | 192,126 | 54.40 | +1.32% | |
Independent | Alyse S. Galvin [a] | 159,856 | 45.26 | −1.24% | |
Write-in | 1,183 | 0.34 | −0.08% | ||
Total votes | 353,165 | 100 | N/A |
Party | Candidate | Round 1 | Round 2 | |||||
---|---|---|---|---|---|---|---|---|
Votes | % | Transfer | Votes | % | ||||
Democratic | Mary Peltola | 74,807 | 39.66% | +16,399 | 91,206 | 51.47% | ||
Republican | Sarah Palin | 58,328 | 30.93% | +27,659 | 85,987 | 48.53% | ||
Republican | Nick Begich III | 52,504 | 27.84% | -52,504 | Eliminated | |||
Write-in | 2,971 | 1.58% | -2,971 | Eliminated | ||||
Total votes | 188,610 | 100.00% | 177,193 | 94.29% | ||||
Inactive ballots | 0 | 0.00% | +10,726 | 10,726 | 5.71% | |||
Democratic gain from Republican |
Party | Candidate | Round 1 | Round 2 | Round 3 | |||||||
---|---|---|---|---|---|---|---|---|---|---|---|
Votes | % | Transfer | Votes | % | Transfer | Votes | % | ||||
Democratic | Mary Peltola (incumbent) | 128,329 | 48.68% | +1,038 | 129,433 | 49.20% | +7,460 | 136,893 | 54.94% | ||
Republican | Sarah Palin | 67,732 | 25.74% | +1,064 | 69,242 | 26.32% | +43,013 | 112,255 | 45.06% | ||
Republican | Nick Begich III | 61,431 | 23.34% | +1,988 | 64,392 | 24.48% | -64,392 | Eliminated | |||
Libertarian | Chris Bye | 4,560 | 1.73% | -4,560 | Eliminated | ||||||
Write-in | 1,096 | 0.42% | -1,096 | Eliminated | |||||||
Total votes | 263,148 | 100.00% | 263,067 | 100.00% | 249,148 | 100.00% | |||||
Inactive ballots | 2,193 | 0.83% | +906 | 3,097 | 1.16% | +14,765 | 17,016 | 5.55% | |||
Democratic hold |
Texas's 13th congressional district is a congressional district in the U.S. state of Texas that includes most of the Texas Panhandle, parts of Texoma and northwestern parts of North Texas. The principal cities in the district are Amarillo, Gainesville and Wichita Falls. It winds across the Panhandle into the South Plains, then runs east across the Red River Valley. Covering over 40,000 square miles (100,000 km2), it is the 19th-largest district by area in the nation, the 14th-largest that does not cover an entire state, as well as the second-largest in Texas behind the 23rd congressional district. After the 2020 census was completed, the 13th district was heavily redrawn to incorporate Denton, an increasingly Democratic-leaning suburb of the Dallas-Fort Worth metroplex which had previously anchored the 26th district. With a Cook Partisan Voting Index rating of R+26, it is one of the most Republican districts in Texas.
Texas's 17th congressional district of the United States House of Representatives includes a strip of Central Texas and Deep East Texas stretching from Nacogdoches to Waco and Round Rock, including former President George W. Bush's McLennan County ranch. The district is currently represented by Republican Pete Sessions.
South Carolina's 2nd congressional district is in central and southwestern South Carolina. The district spans from Columbia to the South Carolina side of the Augusta, Georgia metropolitan area.
Maryland's 6th congressional district elects a representative to the United States House of Representatives from the northwest part of the state. The district comprises all of Garrett, Allegany, Frederick, and Washington counties as well as a portion of Montgomery County. David Trone (D) is its current representative.
New Jersey's 2nd congressional district, based in Southern New Jersey, is represented by Republican Jeff Van Drew. He was first elected as a Democrat in 2018, but announced on December 19, 2019, that he would be switching parties. The district, which is New Jersey's largest geographically, is a Republican-leaning seat that has shifted to the right since the late 2010s.
Louisiana's 2nd congressional district contains nearly all of the city of New Orleans and stretches west and north to Baton Rouge. The district is currently represented by Democrat Troy Carter. With a Cook Partisan Voting Index rating of D+25, it is the only Democratic district in Louisiana.
Tennessee's 1st congressional district is the congressional district of northeast Tennessee, including all of Carter, Cocke, Greene, Hamblen, Hancock, Hawkins, Johnson, Sullivan, Unicoi, Washington, and Sevier counties and parts of Jefferson County. It is largely coextensive with the Tennessee portion of the Tri-Cities region of northeast Tennessee and southwest Virginia. With a Cook Partisan Voting Index rating of R+30, it is the most Republican district in Tennessee.
Tennessee's 9th congressional district is a congressional district in West Tennessee. It has been represented by Democrat Steve Cohen since 2007.
New York's 15th congressional district for the United States House of Representatives is located in New York City, State of New York. The district has been represented by Democrat Ritchie Torres since 2021. It is the poorest congressional district in the United States.
South Carolina's 3rd congressional district is a congressional district in western South Carolina bordering both Georgia and North Carolina. It includes all of Abbeville, Anderson, Edgefield, Greenwood, Laurens, McCormick, Oconee, Pickens, and Saluda counties and portions of Greenville and Newberry counties. The district is mostly rural, but much of the economy revolves around the manufacturing centers of Anderson and Greenwood. With a Cook Partisan Voting Index rating of R+21, it is the most Republican district in South Carolina.
South Carolina's 5th congressional district is a congressional district in northern South Carolina bordering North Carolina. The district includes all of Cherokee, Chester, Fairfield, Kershaw, Lancaster, Lee, Union and York counties and parts of Newberry, Spartanburg and Sumter counties. The bulk of its population lives on the South Carolina side of the Charlotte metropolitan area, including the rapidly growing cities of Rock Hill, Fort Mill, and Lake Wylie. Outside the Charlotte suburbs, the district is mostly rural and agricultural. The district borders were contracted from some of the easternmost counties in the 2012 redistricting.
South Carolina's 6th congressional district is in central and eastern South Carolina. It includes all of Allendale, Bamberg, Calhoun, Clarendon, Hampton, and Williamsburg counties and parts of Charleston, Colleton, Dorchester, Florence, Jasper, Orangeburg, Richland and Sumter counties. With a Cook Partisan Voting Index rating of D+14, it is the only Democratic district in South Carolina.
South Carolina's 7th congressional district is a congressional district for the United States House of Representatives in South Carolina, established in 2011 following apportionment of another seat to the state in the redistricting cycle following the 2010 census. It is located in the Pee Dee region, and includes all of Chesterfield, Darlington, Dillon, Georgetown, Horry, Marion, and Marlboro Counties and most of Florence County. The district is represented by Republican Russell Fry who was elected in 2022 and took office on January 3, 2023.
Arkansas's 3rd congressional district is a congressional district in the U.S. state of Arkansas. The district covers Northwest Arkansas and takes in Fort Smith, Fayetteville, Springdale, and Bentonville.
Virginia's 10th congressional district is a U.S. congressional district in the Commonwealth of Virginia. It is represented by Democrat Jennifer Wexton, who was first elected in 2018.
Missouri's 1st congressional district is in the eastern portion of the state. It includes all of St. Louis City and much of northern St. Louis County, including the cities of Maryland Heights, University City, Ferguson and Florissant. With a Cook Partisan Voting Index rating of D+27, it is the most Democratic district in Missouri. Roughly half of the district's population is African American.
Oklahoma's 2nd congressional district is one of five United States congressional districts in Oklahoma and covers approximately one-fourth of the state in the east. The district borders Arkansas, Kansas, Missouri, and Texas and includes a total of 24 counties. With a Cook Partisan Voting Index rating of R+29, it is the most Republican district in Oklahoma, a state with an all-Republican congressional delegation.
Georgia's 7th congressional district is a congressional district in the U.S. state of Georgia. It is currently represented by Democrat Lucy McBath.
The November 2022 United States House of Representatives election in Alaska was held on Tuesday, November 8, to elect a member of the United States House of Representatives to represent the state of Alaska. Democratic incumbent Mary Peltola won reelection to a full term in office, defeating Republicans Sarah Palin and Nick Begich III and Libertarian Chris Bye in the runoff count.
The 2022 Alaska at-large congressional district special election was held on August 16 to fill the seat left vacant after the death of Republican incumbent Don Young. Mary Peltola was elected in a 3-way race against former governor Sarah Palin and Nick Begich III in the election, becoming the first Alaska Native and woman to represent Alaska in the House.