This article needs more links to other articles to help integrate it into the encyclopedia . (May 2015) (Learn how and when to remove this template message) |
The 2015 Ashford Borough Council election took place on 7 May 2015 to elect members of Ashford Borough Council in England. [1] This was on the same day as other local elections.
Ashford Borough Council is the local authority for the Borough of Ashford in Kent.
Party | Seats | Gains | Losses | Net gain/loss | Seats % | Votes % | Votes | +/− | |
---|---|---|---|---|---|---|---|---|---|
Conservative | 34 | 4 | 0 | +4 | 79 | 52 | 38739 | ||
Labour | 4 | 1 | 2 | -1 | 9 | 20 | 14835 | ||
Ashford Independent | 3 | 0 | 3 | -3 | 7 | 6 | 4149 | ||
UKIP | 1 | 1 | 0 | +1 | 2 | 10 | 7506 | ||
Liberal Democrat | 1 | 0 | 1 | -1 | 2 | 3 | 2318 | ||
Greens | 0 | 0 | 0 | 0 | 0 | 7 | 4875 | ||
Independent | 0 | 0 | 0 | 0 | 0 | 3 | 2175 | ||
Party | Candidate | Votes | % | ± | |
---|---|---|---|---|---|
Labour | Kate Hooker | 725 | 55 | +18.7 | |
Conservative | Paul Hardisty | 592 | 44.9 | +17.3 | |
Majority | 133 | 10 | +9.8 | ||
Turnout | 664 | 53.5 | +19.2 | ||
Labour hold | Swing | ||||
Party | Candidate | Votes | % | ± | |
---|---|---|---|---|---|
Labour | Jill Britcher | 817 | 21.1 | ||
UKIP | Beverly Joan Murphy | 812 | 20.9 | ||
Conservative | Richard Harry Bunting | 715 | 18.4 | ||
Labour | Dylan Alexander Jones | 452 | 16.6 | ||
Green | Maria Ann Pizzey | 195 | 5 | ||
Independent | Selina Kathleen Remedios | 126 | 3.2 | ||
Conservative | Janet Elizabeth Rymer-Jones | 423 | 10.9 | ||
Green | Aniko Szocs | 135 | 3.4 | ||
Turnout | 3868 | 55.94 | +22.1 | ||
Labour hold | Swing | ||||
UKIP gain from Labour | Swing | ||||
Party | Candidate | Votes | % | ± | |
---|---|---|---|---|---|
Conservative | Neil Bell | 1057 | 72.9 | -7.5 | |
Green | Guy Pullen | 391 | 27 | +27 | |
Majority | 666 | 45 | -15.8 | ||
Turnout | 1448 | 71.4 | +23.3 | ||
Conservative hold | Swing | ||||
Party | Candidate | Votes | % | ± | |
---|---|---|---|---|---|
Labour | Kaprasad Chhantyal | 392 | 33.5 | +18.2 | |
Conservative | Luke Powell | 778 | 66.4 | +15.7 | |
Majority | 386 | 32.9 | +8.1 | ||
Turnout | 1170 | 61.1 | +16.9 | ||
Conservative hold | Swing | ||||
Party | Candidate | Votes | % | ± | |
---|---|---|---|---|---|
Conservative | Len Bunn | 465 | 29.3 | +3.9 | |
Ashford Independent | Winston Russel Michael | 895 | 56.5 | +17.6 | |
Liberal Democrat | Len Micklewright | 64 | 4 | -31.6 | |
Labour | Ryan Bulley | 158 | 9.9 | +9.9 | |
Majority | 430 | 27.1 | +23.8 | ||
Turnout | 1582 | 65.5 | +21.6 | ||
Ashford Independent hold | Swing | ||||
Party | Candidate | Votes | % | ± | |
---|---|---|---|---|---|
Conservative | Andrew John Buchanan | 693 | 55.7 | +18.9 | |
Labour | Alexander Ward | 549 | 44.2 | +44.2 | |
Majority | 144 | 11.5 | +9.3 | ||
Turnout | 1242 | 65.2 | +23.3 | ||
Conservative hold | Swing | ||||
Party | Candidate | Votes | % | ± | |
---|---|---|---|---|---|
UKIP | Peter Allen | 380 | 27.2 | +27.2 | |
Conservative | Gerry Clarkson | 714 | 51.1 | -17 | |
Liberal Democrat | Shirley Anne Davis | 303 | 21.6 | -10.3 | |
Majority | 334 | 23.9 | -12.4 | ||
Turnout | 1397 | 68.7 | +19.2 | ||
Conservative hold | Swing | ||||
Party | Candidate | Votes | % | ± | |
---|---|---|---|---|---|
Conservative | Stephen Dehnel | 932 | 61.5 | +4.7 | |
Labour | Cleo Lines | 291 | 19.2 | +19.2 | |
Green | Marilyn Sansom | 290 | 19.1 | +3.2 | |
Majority | 641 | 29.5 | 0 | ||
Turnout | 1513 | 75.5 | +23 | ||
Conservative hold | Swing | ||||
Party | Candidate | Votes | % | ± | |
---|---|---|---|---|---|
Conservative | Larry William Krause | 893 | 67.4 | +18.4 | |
Green | Tom Medhurst | 431 | 32.5 | +20.4 | |
Majority | 462 | 34.8 | +15.9 | ||
Turnout | 1324 | 67.7 | +15.2 | ||
Conservative hold | Swing | ||||
Party | Candidate | Votes | % | ± | |
---|---|---|---|---|---|
UKIP | Dave Botting | 653 | 11.1 | ||
UKIP | Jenny Botting | 612 | 10.4 | ||
Conservative | Peter Feacey | 1436 | 24.5 | ||
Ashford Independent | Kenneth George Edward Frohnsdorff | 155 | 2.6 | ||
Liberal Democrat | Adrian John Gee-Turner | 312 | 5.3 | ||
Conservative | Bernard Heyes | 1292 | 22 | ||
Labour | Alexander Oluwole Jaiyesimi | 570 | 9.7 | ||
Green | Jake Adam Pentland | 334 | 5.7 | ||
Labour | Chandrawati Rai | 490 | 8.3 | ||
Turnout | 5854 | 65.6 | +26 | ||
Conservative hold | Swing | ||||
Party | Candidate | Votes | % | ± | |
---|---|---|---|---|---|
Conservative | Jessamy Edmee Blanford | 782 | 43.6 | +1.4 | |
Ashford Independent | John Hugh Durrant | 336 | 18.7 | -21.2 | |
UKIP | Matt Peach | 358 | 19.9 | +19.9 | |
Labour | Waheed Qureshi | 315 | 17.5 | -0.4 | |
Majority | 424 | 23.6 | +21.3 | ||
Turnout | 1791 | 66.5 | +28.2 | ||
Conservative hold | Swing | ||||
Party | Candidate | Votes | % | ± | |
---|---|---|---|---|---|
Ashford Independent | Jane Davey | 391 | 29.1 | -15.3 | |
Green | Charmaine Elizabeth Perrin | 135 | 10 | +10 | |
Dawa Wangdi Sherpa | 221 | 16.4 | +16.4 | ||
Conservative | Gerald White | 593 | 44.2 | +7.4 | |
Majority | 202 | 15 | +7.3 | ||
Turnout | 1340 | 71.4 | +26.7 | ||
Conservative gain from Ashford Independent | |||||
Party | Candidate | Votes | % | ± | |
---|---|---|---|---|---|
Conservative | Mick Burgess | 983 | 62 | +62 | |
Green | David Ledger | 213 | 13.4 | +13.4 | |
UKIP | Kate Manning | 389 | 24.5 | +24.5 | |
Majority | 594 | 37.4 | +37.4 | ||
Turnout | 1585 | 72.3 | +72.3 | ||
Conservative hold | Swing | ||||
Party | Candidate | Votes | % | ± | |
---|---|---|---|---|---|
Liberal Democrat | Ken Blanshard | 133 | 9.3 | +9.3 | |
UKIP | Pat Purnell | 212 | 14.9 | +14.9 | |
Conservative | Philip John Frederick Sims | 684 | 48.2 | +5.1 | |
Ashford Independent | Derek William Standing | 213 | 15 | -30.7 | |
Labour | Andrew Stevenson | 177 | 12.4 | +1.3 | |
Majority | 471 | 33.1 | +30.5 | ||
Turnout | 1419 | 76 | 22 | ||
Conservative hold | Swing | ||||
Party | Candidate | Votes | % | ± | |
---|---|---|---|---|---|
UKIP | Bev Gregory | 321 | 21 | +21 | |
Liberal Democrat | Clare Hardwick | 128 | 8.3 | -11 | |
Conservative | Marion Martin | 747 | 48.9 | -1.1 | |
Labour | Grace Emily O'Driscoll | 331 | 21.6 | +7.9 | |
Majority | 416 | 27.2 | -3.5 | ||
Turnout | 1419 | 69 | +22.8 | ||
Conservative hold | Swing | ||||
Party | Candidate | Votes | % | ± | |
---|---|---|---|---|---|
Labour | Gordon Miller | 506 | 44 | +13.5 | |
Conservative | Jenny Webb | 643 | 55.9 | +28.4 | |
Majority | 137 | 11.9 | +8.9 | ||
Turnout | 1149 | 57.7 | +20.4 | ||
Conservative gain from Labour | Swing | ||||
Party | Candidate | Votes | % | ± | |
---|---|---|---|---|---|
Conservative | Jeremy Paul Adby | 1019 | 22.5 | ||
Green | Steve Robert Campkin | 406 | 8.9 | ||
Liberal Democrat | George Koowaree | 1147 | 25.4 | ||
Labour | Dhan Ragu | 565 | 12.5 | ||
Independent | Andrew Martin William Mortimer | 436 | 9.6 | ||
Labour | Elizabeth Mylonogianni | 623 | 13.8 | ||
Conservative | Ian Andrew Price | 317 | 7 | ||
Turnout | 4513 | 68.6 | +21.9 | ||
Liberal Democrat hold | Swing | ||||
Conservative gain from Ashford Independent | |||||
Party | Candidate | Votes | % | ± | |
---|---|---|---|---|---|
Labour | Sean Davidson | 328 | 19.5 | -2.1 | |
Conservative | Tina Heyes | 821 | 48.8 | -5.6 | |
Independent | John Holland | 193 | 11.4 | +11.4 | |
UKIP | Jim Lucy | 337 | 20 | +20 | |
Majority | 484 | 28.8 | -4.1 | ||
Turnout | 1679 | 67 | +26 | ||
Conservative hold | Swing | ||||
Party | Candidate | Votes | % | ± | |
---|---|---|---|---|---|
Labour | Amy Mitchell | 436 | 34.1 | +7.5 | |
Conservative | Jim Wedgbury | 839 | 65.8 | -7.6 | |
Majority | 403 | 31.6 | -15.2 | ||
Turnout | 1275 | 61.7 | +29.2 | ||
Conservative hold | Swing | ||||
Party | Candidate | Votes | % | ± | |
---|---|---|---|---|---|
Conservative | Mike Bennett | Uncontested | N/A | 0 | |
Conservative hold | Swing | ||||
Party | Candidate | Votes | % | ± | |
---|---|---|---|---|---|
Labour | Giri Arulampalam | 453 | 8.3 | ||
Ashford Independent | Sue Davison | 645 | 11.9 | ||
Conservative | William Thomas Howard | 2000 | 36.9 | ||
Conservative | Jane Martin | 1832 | 33.8 | ||
Labour | Rebecca Rutter | 479 | 8.8 | ||
Turnout | 5418 | 75.79 | 23 | ||
Conservative hold | Swing | ||||
Party | Candidate | Votes | % | ± | |
---|---|---|---|---|---|
Conservative | William Barrett | 646 | 42.9 | -3.8 | |
Ashford Independent | Sarah Angela Heaton Dacre | 226 | 15 | -0.2 | |
Labour | Sally Ann Gathern | 331 | 22 | +22 | |
UKIP | Mike Withycombe | 300 | 19.9 | +19.9 | |
Majority | 315 | 20.9 | +2.9 | ||
Turnout | 1503 | 63.2 | +25.7 | ||
Conservative hold | Swing | ||||
Party | Candidate | Votes | % | ± | |
---|---|---|---|---|---|
Green | Joanna Baker | 96 | 6.5 | +6.5 | |
Labour | Martin Chandler | 303 | 20.5 | +2.3 | |
Conservative | Sara-Jane Martin | 297 | 20.1 | +2.1 | |
Independent | David Owen Smith | 520 | 35.2 | -28.6 | |
UKIP | Mike Sykes | 248 | 16.8 | +16.8 | |
Majority | 217 | 14.7 | -30.9 | ||
Turnout | 1474 | 57.2 | +11.6 | ||
Independent hold | Swing | ||||
Party | Candidate | Votes | % | ± | |
---|---|---|---|---|---|
Conservative | John Link | 893 | 75.5 | +4.4 | |
Green | Matthew Stanley | 291 | 24.6 | +3.4 | |
Majority | 600 | 50.7 | +1 | ||
Turnout | 1182 | 63.8 | +16.9 | ||
Conservative hold | Swing | ||||
Party | Candidate | Votes | % | ± | |
---|---|---|---|---|---|
UKIP | Eddy Barrows | 245 | 25.2 | +25.2 | |
Labour | Brendan Chilton | 482 | 49.6 | -3.9 | |
Conservative | James Charles King | 185 | 19 | +19 | |
Green | Thom Pizzey | 59 | 6 | +6 | |
Majority | 337 | 34.7 | +22.3 | ||
Turnout | 971 | 45.6 | +17.1 | ||
Labour hold | Swing | ||||
Party | Candidate | Votes | % | ± | |
---|---|---|---|---|---|
Labour | Euan Fergus Anckorn | 739 | 18.6 | ||
Conservative | Graham Galpin | 1298 | 32.6 | ||
Green | Peter David Morgan | 478 | 12 | ||
Labour | Charles Suddards | 594 | 14.9 | ||
Conservative | Chris Waters | 863 | 14.9 | ||
Turnout | 3972 | 63.7 | +22.3 | ||
Conservative hold | Swing | ||||
Party | Candidate | Votes | % | ± | |
---|---|---|---|---|---|
Liberal Democrat | Steve Bowen | 160 | 11.2 | +11.2 | |
Conservative | Paul Clokie | 827 | 58.1 | +8 | |
Ashford Independent | Roy Anthony Isworth | 248 | 17.4 | +17.4 | |
Labour | David Joh Ward | 186 | 13 | +1.1 | |
Majority | 579 | 40.7 | +14.6 | ||
Turnout | 1421 | 77.4 | +65.5 | ||
Conservative hold | Swing | ||||
Party | Candidate | Votes | % | ± | |
---|---|---|---|---|---|
UKIP | Lynn Brodlie | 270 | 19.3 | +19.3 | |
Labour | Demi Chilton | 179 | 12.8 | +12.8 | |
Conservative | Callum Knowles | 946 | 67.8 | +9 | |
Majority | 676 | 48.4 | +31.1 | ||
Turnout | 1359 | 70.9 | +22.3 | ||
Conservative hold | Swing | ||||
Party | Candidate | Votes | % | ± | |
---|---|---|---|---|---|
Conservative | Harold Apps | 674 | 16.7 | ||
UKIP | Neil Burgess | 640 | 15.8 | ||
UKIP | Elaine Evans | 479 | 11.8 | ||
Labour | Dara Farrell | 721 | 17.8 | ||
Labour | Caroline Jean Harris | 636 | 15.7 | ||
Conservative | Shafi Khan | 549 | 13.6 | ||
Green | Claire Madeleine | 332 | 8.2 | ||
Turnout | 4031 | 57.1 | +20.2 | ||
Labour gain from Liberal Democrat | Swing | ||||
Conservative hold | Swing | ||||
Party | Candidate | Votes | % | ± | |
---|---|---|---|---|---|
Ashford Independent | Tony Francis | 389 | 25.2 | +12.9 | |
Labour | Sue Riley-Nevers | 379 | 24.6 | +3.5 | |
Conservative | Neil James Shorter | 772 | 50.1 | +12.4 | |
Majority | 383 | 40.7 | +32 | ||
Turnout | 1540 | 62.1 | +25.8 | ||
Conservative hold | Swing | ||||
Party | Candidate | Votes | % | ± | |
---|---|---|---|---|---|
Conservative | Clair Louise Bell | 1660 | 33 | ||
Independent | Keith William Brannan | 679 | 13.5 | ||
Labour | Dion Chilton | 288 | 5.7 | ||
Labour | June Graham | 264 | 5.2 | ||
UKIP | Martin Oldaker | 791 | 15.7 | ||
Conservative | Alan Michael Pickering | 1347 | 26.7 | ||
Turnout | 5029 | 72.22 | |||
Conservative hold | Swing | ||||
Party | Candidate | Votes | % | ± | |
---|---|---|---|---|---|
Conservative | Paul William Bartlett | 1140 | 74.6 | ||
Green | Geoff Meaden | 388 | 25.3 | ||
Majority | 752 | 49.2 | |||
Turnout | 1528 | 70.6 | |||
Conservative hold | Swing | ||||
Party | Candidate | Votes | % | ± | |
---|---|---|---|---|---|
Conservative | Geraldine Averil Dyer | 968 | 65.7 | ||
UKIP | Mark H D Hudson | 333 | 22.2 | ||
Green | Hilary Jones | 194 | 12.9 | ||
Majority | 1162 | 77.7 | |||
Turnout | 1495 | 76.6 | |||
Conservative hold | Swing | ||||
Party | Candidate | Votes | % | ± | |
---|---|---|---|---|---|
Conservative | Brad Bradford | 1969 | 36 | ||
Conservative | Aline Kathleen Hicks | 2053 | 37.5 | ||
Labour | Viven Wheatley | 587 | 10.7 | ||
Green | Liz Wright | 507 | 9.2 | ||
Labour | Arthur Young | 347 | 6.3 | ||
Turnout | 5463 | 73.47 | |||
Conservative gain from Ashford Independent | |||||
Conservative hold | Swing | ||||
Party | Candidate | Votes | % | ± | |
---|---|---|---|---|---|
Labour | Jayne Chilton | 142 | 10.2 | ||
Liberal Democrat | Stuart James Dove | 71 | 5.1 | ||
Conservative | Alex Howard | 402 | 28.8 | ||
UKIP | Alan William Edward Newill | 126 | 9 | ||
Ashford Independents | Noel Ovenden | 651 | 46.7 | ||
Majority | 249 | 17.8 | |||
Turnout | 1392 | 74.9 | |||
Ashford Independent hold | Swing | ||||
Ashford is a town in the county of Kent, England. It lies on the River Great Stour at the south edge of the North Downs, about 61 miles (98 km) southeast of central London and 15.3 miles (24.6 km) northwest of Folkestone by road. In the 2011 census, it had a population of 74,204. The name comes from the Old English æscet, indicating a ford near a clump of ash trees. It has been a market town since the Middle Ages, and a regular market continues to be held.
Spelthorne is a local government district and borough in Surrey, England. It contains the towns and villages of Ashford, Laleham, Shepperton, Staines-upon-Thames, Stanwell and Sunbury-on-Thames. It is the northernmost local government district in Surrey.
Rother is a local government district in East Sussex, England. The district is named after the River Rother which flows within its boundaries.
The Borough of Ashford is a local government district with borough status in Kent, England. It borders five other Kent districts, as well as East Sussex to the south-west. Ashford Borough Council's main offices are in the town of Ashford. The borough was formed on 1 April 1974, by the merger of the then Borough of Tenterden with Ashford urban district as well as the Rural Districts of East Ashford, West Ashford and Tenterden. Covering 58,000 hectares, it is the largest district by area in Kent.
Ashford is a town and suburb of London almost entirely in the Surrey borough of Spelthorne, but with a small part in the London Borough of Hounslow, England. Mostly residential, Ashford is 13 1⁄2 miles (22 km) WSW of Charing Cross, London, forms part of the London commuter belt, with a minor stop on the Waterloo to Reading Line and has a long commercial high street. It is centred 2 1⁄2 miles (4 km) south of London Heathrow Airport, to which a portion of its economy relates, including business premises relating to aviation and the distribution of air freight – the main cargo depot being next to an adjoining village, Stanwell.
Kent County Council is a county council that governs most of the county of Kent in England. It is the upper tier of elected local government, below which are 12 district councils, and around 300 town and parish councils. The county council has 84 elected councillors. The chief executive and chief officers are responsible for the day-to-day running of the council. Paul Carter is the leader of the council. Kent County Council is currently controlled by the Conservative Party and the official opposition is the Liberal Democrats with 7 seats. It is one of the largest local authorities in England in terms of population served and the largest local authority of its type.
Ashford is a constituency created in 1885 represented in the House of Commons of the UK Parliament since 1997 by Damian Green, a Conservative, who served as First Secretary of State between 11 June and 20 December 2017.
Ashford Borough Council in Kent, England is elected every four years. Since the last boundary changes in 2003, 43 councillors have been elected from 35 wards.
Harriet Bronwen Yeo is a British trade unionist, a former Treasurer and President of Transport Salaried Staffs' Association (TSSA), and a UKIP politician who stood unsuccessfully for parliament in Folkestone and Hythe at the 2015 general election.
The 1999 Ashford Borough Council election took place on 6 May 1999 to elect members of Ashford Borough Council in Kent, England. The whole council was up for election and the council stayed under no overall control.
Elections to Ashford Borough Council were held on 1 May 2003. The whole council was up for election with boundary changes since the last election in 1999 reducing the number of seats by 6. The Conservative party gained control of the council from no overall control.
Elections to Ashford Borough Council were held on 3 May 2007. The whole council was up for election and the Conservative party held on to overall control of the council.
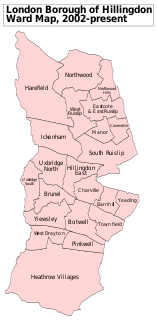
Hillingdon Council in London, England is elected every four years. Since the 2002 boundary changes the council is composed of 65 councillors.
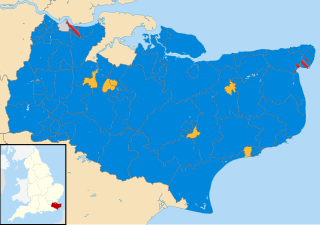
The Kent County Council election, 2013 was an election to all 84 seats on Kent County Council held on 2 May as part of the United Kingdom local elections, 2009. 84 councillors were elected from 72 electoral divisions, which returned either one or two county councillors each by first-past-the-post voting for a four-year term of office. The electoral divisions were the same as those used at the previous election in 2005. No elections were held in Medway, which is a unitary authority outside the area covered by the County Council.
Spelthorne Borough Council in Surrey, England is elected every four years. Since the last boundary changes in 2003, 39 councillors are elected from 13 wards.
Wandsworth London Borough Council in London, England, is elected every four years. Since the last boundary changes in 2002, 60 councillors have been elected from 20 wards.
The 2011 Ashford Borough Council election took place on 5 May 2011 to elect members of Ashford Borough Council in Kent, England. The whole council was up for election and the Conservative party stayed in overall control of the council.
The Kent County Council election, 2013 was an election to all 84 seats on Kent County Council held on Thursday 2 May as part of the United Kingdom local elections, 2013. 84 councillors were elected from 72 electoral divisions, which returned either one or two county councillors each by first-past-the-post voting for a four-year term of office. The electoral divisions were the same as those used at the previous election in 2009. No elections were held in Medway, which is a unitary authority outside the area covered by the County Council. The election saw the Conservative Party narrowly retain overall control of the council.
Elections to Reading Borough Council took place on 7 May 2015 to elect approximately one third of the members of Reading Borough Council in England to coincide with other local elections, an election which was held simultaneously with the 2015 General Election, resulting in higher turnout than the previous election. The election resulted in no change in terms of the political make-up of the Council will each political party holding their respective seats.