Elections to Brentwood Borough Council were held on 3 May 2007. One third of the council was up for election.
After the election, the composition of the council was
Party | Seats | Gains | Losses | Net gain/loss | Seats % | Votes % | Votes | +/− | |
---|---|---|---|---|---|---|---|---|---|
Conservative | 8 | 2 | 0 | +2 | 66.6 | 54.0 | 9,707 | -5.2 | |
Liberal Democrat | 3 | 0 | 2 | -2 | 16.6 | 32.7 | 5,869 | +3.6 | |
Labour | 1 | 0 | 0 | 0 | 8.3 | 8.3 | 1,499 | -0.4 | |
Independent | 0 | 0 | 0 | 0 | 0 | 2.8 | 504 | +2.8 | |
UKIP | 0 | 0 | 0 | 0 | 0 | 2.2 | 392 | -0.9 | |
The swing was 4.4% from the Conservatives to the Liberal Democrats.
An electoral swing analysis shows the extent of change in voter support, typically from one election to another, expressed as a positive or negative percentage. A multi-party swing is an indicator of a change in the electorate's preference between candidates or parties. A swing can be calculated for the electorate as a whole, for a given electoral district or for a particular demographic.
The Conservative Party, officially the Conservative and Unionist Party, is a centre-right political party in the United Kingdom. Presently led by Theresa May, it has been the governing party since 2010. It presently has 314 Members of Parliament in the House of Commons, 249 members of the House of Lords, and 18 members of the European Parliament. It also has 31 Members of the Scottish Parliament, 12 members of the Welsh Assembly, eight members of the London Assembly and 9,008 local councillors. One of the major parties of UK politics, it has formed the government on 45 occasions, more than any other party.
The Liberal Democrats are a liberal political party in the United Kingdom. They presently have 11 Members of Parliament in the House of Commons, 96 members of the House of Lords, and one member of the European Parliament. They also have five Members of the Scottish Parliament and a member each in the Welsh Assembly and London Assembly. The party reached the height of its influence in the early 2010s, forming a junior partner in a coalition government from 2010 to 2015. It is presently led by Vince Cable.
Party | Candidate | Votes | % | ± | |
---|---|---|---|---|---|
Liberal Democrat | Reg Straw | 866 | 48.6 | +10.4 | |
Conservative | Cheralyn Lewis | 764 | 42.9 | -7.8 | |
Labour | Julie Morrissey | 151 | 8.5 | -2.6 | |
Majority | 102 | 5.7 | -6.7 | ||
Turnout | 1,811 | 40.1 | -5.1 | ||
Liberal Democrat hold | Swing | -6.7 | |||
Party | Candidate | Votes | % | ± | |
---|---|---|---|---|---|
Labour | Mike Le-Surf | 608 | 41.4 | +0.7 | |
Conservative | Tony Williams | 597 | 40.7 | +1.6 | |
Liberal Democrat | Shirley Howe | 262 | 17.9 | -2.4 | |
Majority | 11 | 0.7 | -0.9 | ||
Turnout | 1,467 | 37.6 | -5.8 | ||
Labour hold | Swing | -0.9 | |||
Party | Candidate | Votes | % | ± | |
---|---|---|---|---|---|
Liberal Democrat | Karen Chilvers | 866 | 52.0 | +8.0 | |
Conservative | Michael Golding | 722 | 43.4 | -0.8 | |
Labour | Peter Mayo | 77 | 4.6 | -0.8 | |
Majority | 144 | 8.6 | +2.1 | ||
Turnout | 1,665 | 38.7 | -4.9 | ||
Liberal Democrat hold | Swing | +2.1 | |||
Party | Candidate | Votes | % | ± | |
---|---|---|---|---|---|
Conservative | Keith Sparling | 868 | 50.3 | +1.9 | |
Liberal Democrat | Colin Brown | 579 | 33.6 | -3.1 | |
UKIP | Yvonne Maguire | 204 | 11.8 | 0.4 | |
Labour | Barrie Wickerson | 74 | 4.3 | 0.8 | |
Majority | 289 | 16.8 | -20.2 | ||
Turnout | 1,725 | 37.55 | -6.7 | ||
Conservative gain from Liberal Democrat | Swing | +27.5 | |||
Party | Candidate | Votes | % | ± | |
---|---|---|---|---|---|
Conservative | Gordon MacLellan | 854 | 76.5 | -11.8 | |
Liberal Democrat | Ross Carter | 193 | 17.3 | +11.7 | |
Labour | Robert Gow | 69 | 6.2 | 0.1 | |
Majority | 661 | 59.2 | -22.9 | ||
Turnout | 1,116 | 39.2 | -8.8 | ||
Conservative hold | Swing | +2.4 | |||
Party | Candidate | Votes | % | ± | |
---|---|---|---|---|---|
Conservative | Christopher Hossack | 584 | 63.0 | +3.4 | |
Liberal Democrat | Caron Davis | 257 | 27.7 | -6.8 | |
Labour | Richard Enever | 86 | 9.3 | +3.4 | |
Majority | 327 | 35.3 | 10.2 | ||
Turnout | 927 | 32.94 | -8.9 | ||
Conservative hold | Swing | +5.7 | |||
Party | Candidate | Votes | % | ± | |
---|---|---|---|---|---|
Conservative | Dudley Payne | 552 | 47.6 | -12.7 | |
Independent | Graham Soames | 504 | 43.5 | +43.5 | |
Labour | Charles Bisson | 103 | 8.9 | 0.1 | |
Majority | 48 | 4.1 | -25.1 | ||
Turnout | 1,159 | 37.94 | -9.1 | ||
Conservative hold | Swing | -28.3 | |||
Party | Candidate | Votes | % | ± | |
---|---|---|---|---|---|
Conservative | Noelle Hones | 1,102 | 52.8 | -12.1 | |
Liberal Democrat | Christopher Dale | 717 | 34.4 | +15.5 | |
UKIP | Janette Gulleford | 188 | 9.0 | -0.2 | |
Labour | Jane Winter | 80 | 3.8 | -3.1 | |
Majority | 385 | 18.4 | -37.3 | ||
Turnout | 2,087 | 44.84 | -1.0 | ||
Conservative hold | Swing | -5.4 | |||
Party | Candidate | Votes | % | ± | |
---|---|---|---|---|---|
Liberal Democrat | Mathew Aspinell | 1,010 | 57.8 | +5.5 | |
Conservative | Paula Sparling | 670 | 38.4 | +2.0 | |
Labour | Michele Wigram | 66 | 3.8 | -7.1 | |
Majority | 340 | 19.5 | 14.6 | ||
Turnout | 1,746 | 39.1 | -4.3 | ||
Liberal Democrat hold | Swing | +1.8 | |||
Party | Candidate | Votes | % | ± | |
---|---|---|---|---|---|
Conservative | Phil Baker | 1,254 | 77.7 | +0.7 | |
Liberal Democrat | Anne Long | 281 | 17.4 | -0.1 | |
Labour | Ian Wands | 79 | 4.9 | -0.6 | |
Majority | 973 | 60.3 | 0.8 | ||
Turnout | 1,361 | 39.4 | -6.1 | ||
Conservative hold | Swing | +13.3 | |||
Party | Candidate | Votes | % | ± | |
---|---|---|---|---|---|
Conservative | Madeline Henwood | 828 | 71.2 | +9.8 | |
Liberal Democrat | Alan Davies | 269 | 23.1 | -8.8 | |
Labour | Paul Skingley | 66 | 5.7 | -1.0 | |
Majority | 559 | 48.1 | 18.6 | ||
Turnout | 1,163 | 39.56 | -6.5 | ||
Conservative hold | Swing | +18.6 | |||
Party | Candidate | Votes | % | ± | |
---|---|---|---|---|---|
Conservative | William Lloyd | 882 | 50.6 | -1.8 | |
Liberal Democrat | Jill Hubbard | 771 | 44.2 | +8.3 | |
Labour | Richard Margrave | 91 | 5.2 | -4.3 | |
Majority | 111 | 6.4 | -10.0 | ||
Turnout | 1,744 | 41.0 | -4.3 | ||
Conservative gain from Liberal Democrat | Swing | +3.4 | |||
Ward | Party | Incumbent Elected | Incumbent | Standing again? |
---|---|---|---|---|
Brentwood North | Liberal Democrats | 2003 | Reginald Straw | Re-elected |
Brentwood South | Labour | 2003 | David Hann | No |
Brentwood West | Liberal Democrats | 2003 | Allan Wheatley | No |
Brizes & Doddinghurst | Liberal Democrats | 2003 | Colin Brown | Yes |
Herongate, Ingrave & West Horndon | Conservative | 2003 | Gordon MacLellan | Re-elected |
Hutton East | Conservative | 2003 | Christopher Hossack | Re-elected |
Hutton North | Conservative | 2003 | Dudley Payne | Re-elected |
Ingatestone, Fryerning & Mountnessing | Conservative | 2003 | Sarah Courage | No |
Pilgrims Hatch | Liberal Democrats | 2003 | Charles Myers | No |
Shenfield | Conservative | 2003 | Philip Baker | Re-elected |
Tipps Cross | Conservative | 2003 | Madeline Henwood | Re-elected |
Warley | Liberal Democrats | 2003 | Jill Hubbard | Yes |
Elections to Brentwood Borough Council were held on 10 June 2004. One third of the council was up for election, all seats last being elected in 2002 following boundary changes. The Conservative Party took control of the council.
Elections to Brentwood Borough Council was held on 4 May 2006. One third of the council were up for election. The Conservative Party retained control the council.
Elections to Brentwood Borough Council were held on 1 May 2003. One third of the council was up for election, all seats last being elected in 2002 following boundary changes. Twelve years of Liberal Democrat control ended with the council passing into no overall control.
Elections to Brentwood Borough Council were held on 1 May 2008. One third of the council was up for election and the Conservative Party kept overall control of the council.
The 2010 Brentwood council election took place on 6 May 2010 to elect members of Brentwood District Council in Essex, England as part of the 2010 United Kingdom local elections. One third of the council was up for election with the council previously having a majority for the Conservative party. The Conservative Party lost two seats to the Liberal Democrats in Brentwood North and Brentwood West respectively.
As a result of the 2009 structural changes to local government in England, the former Wiltshire County Council and the four districts within its geographical area were replaced by the new Wiltshire Council, which is a unitary authority covering the same area, with elections continuing to be held every four years, beginning in June 2009. Previously, Wiltshire County Council had been elected between 1889 and 2005, initially every three years, later every four years.
Elections to Brentwood Council were held on 7 May 1998. One third of the council was up for election and the Liberal Democrat party kept overall control of the council.
Elections to Brentwood Council were held on 6 May 1999. One third of the council was up for election and the Liberal Democrat party kept overall control of the council.
Elections to Brentwood Council were held on 4 May 2000. One third of the council was up for election and the Liberal Democrat party kept overall control of the council.
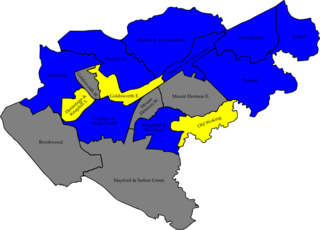
The 2007 Woking Council election took place on 3 May 2007 to elect members of Woking Borough Council in Surrey, England. One third of the council was up for election and the Conservative party gained overall control of the council from no overall control.
The 2004 Southend-on-Sea Council election took place on 10 June 2004 to elect members of Southend-on-Sea Unitary Council in Essex, England. One third of the council was up for election and the Conservative party stayed in overall control of the council.
The 1999 Pendle Borough Council election took place on 6 May 1999 to elect members of Pendle Borough Council in Lancashire, England. One third of the council was up for election and the Liberal Democrats lost overall control of the council to no overall control.
The 2007 Pendle Borough Council election took place on 3 May 2007 to elect members of Pendle Borough Council in Lancashire, England. One third of the council was up for election and the Liberal Democrats stayed in overall control of the council.
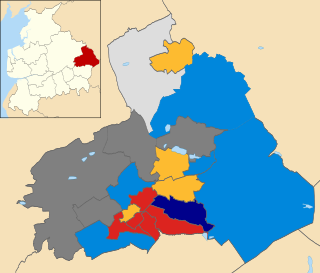
The 2008 Pendle Borough Council election took place on 1 May 2008 to elect members of Pendle Borough Council in Lancashire, England. One third of the council was up for election and the Liberal Democrats lost overall control of the council to no overall control.
The 2006 Maidstone Borough Council election took place on 4 May 2006 to elect members of Maidstone Borough Council in Kent, England. One third of the council was up for election and the council stayed under no overall control.
The 2012 St Albans City and District Council election took place on 3 May 2012 to elect members of St Albans District Council in Hertfordshire, England. One third of the council was up for election and the council stayed under no overall control.
The 2008 Colchester Borough Council election took place on 1 May 2008 to elect members of Colchester Borough Council in Essex, England. One third of the council was up for election and the Conservative party lost overall control of the council to no overall control.
The 2012 Pendle Borough Council election took place on 3 May 2012 to elect members of Pendle Borough Council in Lancashire, England. One third of the council was up for election and the council stayed under no overall control.
The 2007 Huntingdonshire District Council election took place on 3 May 2007 to elect members of Huntingdonshire District Council in Cambridgeshire, England. One third of the council was up for election and the Conservative party stayed in overall control of the council.
The 2010 Swale Borough Council election took place on 6 May 2010 to elect members of Swale Borough Council in Kent, England. One third of the council was up for election and the Conservative party stayed in overall control of the council.