Kanchipuram district

Last updated

Kanchipuram District
Chitlapakkam lake.jpg
Waters of Chembarambakkam Lake Chennai limit
Kanchipuram district
Location in Tamil Nadu
Coordinates: 12°49′N79°43′E / 12.82°N 79.71°E / 12.82; 79.71
Country Flag of India.svg India
State TamilNadu Logo.svg Tamil Nadu
Established1 July 1997
Founded by M. Karunanidhi
Headquarters Kanchipuram
Taluks Kancheepuram, Sriperumbudur, Uthiramerur, Walajabad, Kundrathur
Government
   District Collector Kalaiselvi Mohan I.A.S
Area
  Total
1,655.94 km2 (639.36 sq mi)
Population
 (2011)
  Total
1,166,401 [1]
  Estimate 
(2020)
2,468,391 [2]
Languages
  OfficialTamil
Time zone UTC+5:30 (IST)
PIN
631 501
Telephone code044
ISO 3166 code ?
Vehicle registration TN-21, TN-87
Nominal GDP(2022-23)92,456.43 crore (US$11.76 billion) [3]
Coastline87.2 kilometres (54.2 mi)
Largest Metro Kanchipuram
Sex ratio M-50.6%/F-49.4% /
Literacy75.34%
Legislature typeelected
Legislature Strength3
Lok Sabha constituencyKancheepuram (SC), Sriperumbudur
Precipitation 1,213 millimetres (47.8 in)
Avg. summer temperature36.6 °C (97.9 °F)
Avg. winter temperature19.8 °C (67.6 °F)
Website kancheepuram.nic.in

Kanchipuram District is one of the 38 districts in the state of Tamil Nadu in India. The area comprising the present day Kancheepuram district was earlier a part of Chingleput district. The original Chingleput district was split in 1997 into form the present day Kanchipuram and Tiruvallur districts. [4]

Contents

On 18 July 2019, Chengalpattu district was carved out of Kanchipuram district, with suburbs from Chengalpet towards Chennai under the district headquarters in Chengalpet. The separation came into effect from 29 November which was done by former Chief Minister Mr. Edappadi K Palaniswami. [5]

Geography

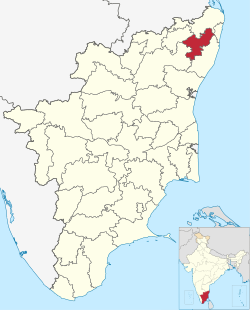
Kanchipuram district is situated on the North Eastern part of Tamil Nadu. It is bounded by Chengalpattu district in the East, Chennai district in the northeast, Ranipet and Tiruvannamalai districts in the west and Thiruvallur district in the north. It lies between 11° 00' to 12° 00' latitudes and 77° 28' to 78° 50' longitudes. The district has a total geographical area of 4,43,210 hectares.

The table below shows the maximum and minimum temperatures experienced in the district during different seasons.

SummerWinter
Max.38.5 °C (101.3 °F)27.7 °C (81.9 °F)
Min.29.1 °C (84.4 °F)19.0 °C (66.2 °F)

Northeast and Southwest monsoon are the major donors, with 54% and 36% contribution each to the total annual rainfall. During normal monsoon, the district receives a rainfall of 1200 mm.

The Palar river is the most important river running through the district. Through most of the year it remains dry, attributed to the construction of dams across the river in Andhra Pradesh. There are only a few hills of considerable elevation in the district. The southern part of Maduranthakam taluk contains small hills. The total forest area in the district is 23,586 hectares.

Climate

Climate data for Chennai (Nungambakkam; rainfall from Chennai Airport) 1991–2020, extremes 1901–2012
MonthJanFebMarAprMayJunJulAugSepOctNovDecYear
Record high °C (°F)34.4
(93.9)
36.7
(98.1)
40.6
(105.1)
42.8
(109.0)
45.0
(113.0)
43.3
(109.9)
41.1
(106.0)
40.0
(104.0)
38.9
(102.0)
39.4
(102.9)
35.4
(95.7)
33.0
(91.4)
45.0
(113.0)
Mean daily maximum °C (°F)29.3
(84.7)
30.9
(87.6)
32.9
(91.2)
34.5
(94.1)
37.1
(98.8)
37.0
(98.6)
35.3
(95.5)
34.7
(94.5)
34.2
(93.6)
32.1
(89.8)
29.9
(85.8)
28.9
(84.0)
33.1
(91.6)
Daily mean °C (°F)25.4
(77.7)
26.7
(80.1)
28.7
(83.7)
31.0
(87.8)
33.0
(91.4)
32.3
(90.1)
31.0
(87.8)
30.3
(86.5)
29.8
(85.6)
28.5
(83.3)
26.7
(80.1)
25.6
(78.1)
29.1
(84.4)
Mean daily minimum °C (°F)21.2
(70.2)
22.2
(72.0)
24.2
(75.6)
26.6
(79.9)
28.0
(82.4)
27.5
(81.5)
26.4
(79.5)
25.9
(78.6)
25.6
(78.1)
24.6
(76.3)
23.1
(73.6)
21.9
(71.4)
24.8
(76.6)
Record low °C (°F)13.9
(57.0)
15.0
(59.0)
16.7
(62.1)
20.0
(68.0)
21.1
(70.0)
20.6
(69.1)
21.0
(69.8)
20.5
(68.9)
20.6
(69.1)
16.7
(62.1)
15.0
(59.0)
13.9
(57.0)
13.9
(57.0)
Average rainfall mm (inches)20.0
(0.79)
4.7
(0.19)
3.4
(0.13)
17.5
(0.69)
49.7
(1.96)
75.4
(2.97)
113.1
(4.45)
141.4
(5.57)
143.9
(5.67)
278.3
(10.96)
377.3
(14.85)
183.7
(7.23)
1,408.4
(55.45)
Average rainy days1.40.60.21.01.84.56.78.87.410.611.55.760.2
Average relative humidity (%) (at 17:30 IST)67666770686365667176767169
Mean monthly sunshine hours 232.5240.1291.4294.0300.7234.0142.6189.1195.0257.3261.0210.82,848.5
Mean daily sunshine hours 7.58.59.49.89.77.84.66.16.58.38.76.87.8
Average ultraviolet index 7778888776777
Source 1: India Meteorological Department [6] [7] [8] [9]
Source 2: Tokyo Climate Center (mean temperatures 1991–2020) [10]

Administrative divisions

Revenue divisions and taluks

Kancheepuram District consists of two revenue divisions and five taluks: [11]

Municipal corporation

Municipalities

Proposed municipalities

Town panchayats

Proposed town panchayats

Panchayat unions / blocks

Demographics

Historical population
YearPop.±% p.a.
1901708,782    
1911759,794+0.70%
1921798,408+0.50%
1931871,546+0.88%
1941956,996+0.94%
19511,030,559+0.74%
19611,167,491+1.26%
19711,499,744+2.54%
19811,898,021+2.38%
19912,415,010+2.44%
20012,877,468+1.77%
20113,998,252+3.34%
source: [12]

According to 2011 census, Kancheepuram district had a population of 3,998,252 with a sex-ratio of 986 females for every 1,000 males, much above the national average of 929. [13] A total of 431,574 were under the age of six, constituting 220,341 males and 211,233 females. Scheduled Castes and Scheduled Tribes accounted for 23.71% and 1.03% of the population respectively. The average literacy of the district was 75.37%, compared to the national average of 72.99%. [13] The district had a total of 1,006,245 households. There were a total of 1,673,814 workers, comprising 74,761 cultivators, 162,494 main agricultural labourers, 41,149 in house hold industries, 1,088,974 other workers, 306,436 marginal workers, 14,582 marginal cultivators, 110,020 marginal agricultural labourers, 13,583 marginal workers in household industries and 168,251 other marginal workers. [14]

Politics

Source: [15] [16]
DistrictNo.ConstituencyNamePartyAllianceRemarks
Kanchipuram 29 Sriperumbudur (SC) K. Selvaperunthagai Indian National Congress SPA
Kanchipuram 36 Uthiramerur K. Sundar Dravida Munnetra Kazhagam SPA
37 Kancheepuram C. V. M. P. Ezhilarasan Dravida Munnetra Kazhagam SPA

Economy

Hyundai's manufacturing plant at Irungattukottai, near Sriperumbudur HyundaiChennai.JPG
Hyundai's manufacturing plant at Irungattukottai, near Sriperumbudur

Agriculture is the main occupation of the people with 47% of the population engaged in it. Paddy is the major crop cultivated in this district. Groundnuts, sugarcane, cereals, millet and pulses are the other major crops cultivated. 76.50 metric tonnes lands[ clarification needed ] are cultivated in fuel wood and 8.039 tonnes in cashew. Palar river along with tanks and wells are the main sources of irrigation in this district.[ citation needed ]

More than 70 percent of the 163 notified areas (megalithic sites) in the state of Tamil Nadu are in Kancheepuram district, including those at Erumaiyur, Nandampakkam, Sirukalathur, Sikarayapuram, Ayyancheri, Kilambakkam and Nanmangalam. [17]

See also

References

  1. https://kancheepuram.nic.in/ [ bare URL ]
  2. "Kancheepuram | District | GeoIQ".
  3. "District Income estimates".
  4. "History". Kancheepuram District. Retrieved 12 July 2020.
  5. "Palaniswami inaugurates Chengalpattu district". The Hindu. 30 November 2019.
  6. "Station: Chennai (Nungambakkam) Climatological Table 1981–2010" (PDF). Climatological Normals 1981–2010. India Meteorological Department. January 2015. pp. 185–186. Archived from the original (PDF) on 5 February 2020. Retrieved 2 March 2020.
  7. "Extremes of Temperature & Rainfall for Indian Stations (Up to 2012)" (PDF). India Meteorological Department. December 2016. p. M192. Archived from the original (PDF) on 5 February 2020. Retrieved 2 March 2020.
  8. "Table 3 Monthly mean duration of Sun Shine (hours) at different locations in India" (PDF). Daily Normals of Global & Diffuse Radiation (1971–2000). India Meteorological Department. December 2016. p. M-3. Archived from the original (PDF) on 5 February 2020. Retrieved 2 March 2020.
  9. "Chennai Climatological Table 1981–2010". India Meteorological Department. Retrieved 2 March 2020.
  10. "Normals Data: Chennai/Minambakkam – India Latitude: 13.00°N Longitude: 80.18°E Height: 14 (m)". Japan Meteorological Agency. Retrieved 1 December 2022.
  11. "Tamil Nadu Government Portal". www.tn.gov.in. Retrieved 7 May 2020.
  12. Decadal Variation In Population Since 1901
  13. 1 2 "Census Info 2011 Final population totals". Office of The Registrar General and Census Commissioner, Ministry of Home Affairs, Government of India. 2013. Retrieved 26 January 2014.
  14. "Census Info 2011 Final population totals - Kancheepuram district". Office of The Registrar General and Census Commissioner, Ministry of Home Affairs, Government of India. 2013. Retrieved 26 January 2014.
  15. "Tamil Nadu Election Results 2021: Here's full list of winners". CNBCTV18. 3 May 2021. Retrieved 22 December 2023.
  16. "Tamil Nadu Election Results 2021: Full list of winners". www.indiatvnews.com. 2 May 2021. Retrieved 22 December 2023.
  17. Madhavan, D. (20 December 2012). "National Institute of Siddha modifies expansion plan". The Hindu. Chennai. Retrieved 23 December 2012.