Median household income in Australia and New Zealand

Last updated

Median total household weekly income in Australia divided geographically by statistical local area, as of the 2011 census Australian Census 2011 demographic map - Australia by SLA - BCP field 0115 Median total household income weekly.svg
Median total household weekly income in Australia divided geographically by statistical local area, as of the 2011 census
Australian total gross income per capita ABS-5220.0-AustralianNationalAccounts-StateAccounts-HouseholdIncomeAccountPerCapitaAustralia-CurrentPrices-TotalGrossIncomePerCapita-A2335031A.svg
Australian total gross income per capita

Median household income is commonly used to measure the relative prosperity of populations in different geographical locations. It divides households into two equal segments with the first half of households earning less than the median household income and the other half earning more.

Contents

New Zealand and Australia are gradually being economically integrated through a process known as "Closer Economic Relations (CER)". Their citizens are free to travel, live and work in either country. Information about their relative median household incomes is of interest, especially for those considering migration.

The latest release shows that the median gross household income in 2013–2014 was $80,704, and the average of all households was $107,276. [1]

Median household income in NZ 2004–2008

Median weekly household income in New Zealand increased at a rate of about 3.5% a year from 2004 to 2008. In June 2004 it was (NZ)$992, [2] June 2005 was $1,040, [3] June 2006 was $1,129, [4] June 2007 was $1,203, [5] June 2008 was $1,271. [6]

Median household income in NZ 2009–2011

Median weekly household income in New Zealand fell slightly or stagnated from 2009 to 2010 during the "great recession" period. In June 2009 it was $1,234 [7] and June 2010 it was $1,236. [8] In 2011 household incomes recovered to beyond the high of 2008 again – median weekly household incomes increased again to $1,289. [9]

Median household income in 2007–2008

Income data for each state (or territory) has been converted to U.S. dollars using purchasing power parity for private and public consumption. [10] This is done because it provides a more accurate and stable assessment of the true value of citizens' incomes in diverse countries.

LocationPopulationMedian household income (local currency)Median household income (PPP US$)
Australia19,855,328$66,820[ citation needed ]$43,960
New South Wales 6,549,177$66,820$43,960
Victoria 4,932,422$66,872$43,994
Queensland 3,904,532$68,276$44,918
Western Australia 1,959,084$72,800$47,894
South Australia 1,514,377$55,848$36,742
Australian Capital Territory 324,034$91,624$60,278
Northern Territory 192,898$86,788$57,097
Tasmania 476,481$50,705
New Zealand4,100,000$67,028 [11] (Average, not median)$44,985

Main source: Australian Bureau of Statistics, Household Income and Income Distribution, Australia 2007–08 . [12] Note : The NZ figure is Average Household Income and not Median Household Income. No source for Median Income found. The figure for NZ Median Household Income is likely to be slightly less. Note: GDP per capita cannot be used to predict median household income (See median household income).

Median household income in 2011–2012

There were no significant changes in income between 2009–10 and 2011–12. [13]

LocationPopulationMedian household income (local currency) [14] [15] Median household income (PPP US$)
AustraliaA$47,736
Australian Capital Territory
Northern Territory
Western Australia
Queensland
Victoria
New South Wales
South Australia
Tasmania
New Zealand

Median gross household income in 2013–2014

The median gross household income in 2013–2014 was $80,704. [1]

Median gross household income in 2017–2018

The median gross household income in 2017-2018 is A$1,701 per week or A$88,695 per year. As of 30 June 2018 (end of fiscal year), one Australia dollar is equivalent of 0.7406 U.S. dollar. Using this exchange rate, the median gross household income in Australia is US$65,687 in 2017–18. [16]

See also

Related Research Articles

<span class="mw-page-title-main">Ballard County, Kentucky</span> County in Kentucky, United States

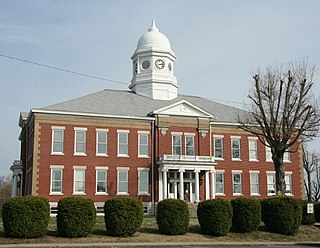
Ballard County is a county located in the west portion of the U.S. state of Kentucky. As of the 2020 census, the population was 7,728. Its county seat is Wickliffe and its largest city is LaCenter. The county was created by the Kentucky State Legislature in 1842 and is named for Captain Bland Ballard, a soldier, statesman, and member of the Kentucky General Assembly. Ballard County is part of the Paducah, KY-IL Metropolitan Statistical Area.

<span class="mw-page-title-main">Woodland, Alabama</span> Town in Alabama, United States

Woodland is a town in Randolph County, Alabama, United States. At the 2010 census the population was 184, down from 192 in 2000. It incorporated in 1967.

<span class="mw-page-title-main">Walnut, California</span> City in California, United States

Walnut is a city in the eastern part of Los Angeles County in the U.S. state of California. According to the 2010 census, the city had a population of 29,172, and the population was estimated to be 29,685 in 2019.

<span class="mw-page-title-main">Sharpes, Florida</span> Census-designated place in Florida

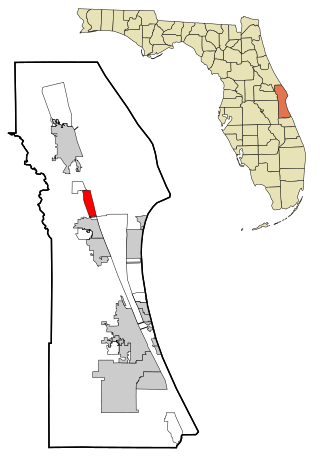
Sharpes is a census-designated place (CDP) in Brevard County, Florida. The population was 3,115 at the 2020 United States census, down from 3,411 at the 2010 United States Census. It is part of the Palm Bay–Melbourne–Titusville, Florida Metropolitan Statistical Area.

<span class="mw-page-title-main">Maysville, Georgia</span> Town in Georgia, United States

Maysville is a town in Banks and Jackson counties in the U.S. state of Georgia. The population was 1,798 at the 2010 census, up from 1,247 at the 2000 census.

<span class="mw-page-title-main">Cedar Point, Illinois</span> Village in Illinois, United States

Cedar Point is a village in LaSalle County, Illinois, United States. The population was 266 at the 2020 census, down from 277 at the 2010 census. It is part of the Ottawa Micropolitan Statistical Area. North of town was the Cedar Point Mine, which operated from 1906 to 1924.

<span class="mw-page-title-main">Victoria, Minnesota</span> City in Minnesota, United States

Victoria is a city in Carver County, Minnesota, United States. The population was 10,546 at the 2020 census.

<span class="mw-page-title-main">Millbury, Ohio</span> Village in Ohio, United States

Millbury is a village in Wood County, Ohio, United States. The population was 1,193 at the 2020 census.

<span class="mw-page-title-main">Malin, Oregon</span> City in Oregon, United States

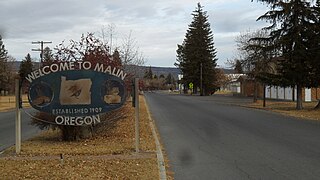
Malin is a city in Klamath County, Oregon, United States. The population was 805 at the 2010 census.

<span class="mw-page-title-main">Claysville, Pennsylvania</span> Borough in Pennsylvania, United States

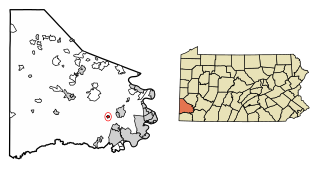
Claysville is a borough in Washington County, Pennsylvania, United States and part of the Pittsburgh metropolitan area since 1950. The population was 728 at the 2020 census. Claysville Elementary School, part of the McGuffey School District is located in Claysville. It is the birthplace of Benjamin Franklin Jones of the Jones and Laughlin Steel Company.

<span class="mw-page-title-main">Cokeburg, Pennsylvania</span> Borough in Pennsylvania, United States

Cokeburg is a borough in Washington County, Pennsylvania, United States and part of the Pittsburgh metropolitan area since 1950. Founded in 1902, the population was 626 at the 2020 census.

<span class="mw-page-title-main">Hill Country Village, Texas</span> City in Texas, United States

Hill Country Village is a city in Bexar County, Texas, United States. The population was 942 at the 2020 census. It is a very affluent enclave city, home to old money families. It is part of the San Antonio Metropolitan Statistical Area. It is the 7th wealthiest location in Texas by per capita income.

<span class="mw-page-title-main">The Hills, Texas</span> Type B General Law City in Texas, United States

The Hills is a village in Travis County, Texas, United States. The population was 2,613 at the 2020 census, making it the largest village in Texas. It is a suburb of Austin.

<span class="mw-page-title-main">Alexandrina Council</span> Local government area in South Australia

Alexandrina Council is a local government area in the Fleurieu and Kangaroo Island region of South Australia. The Alexandrina Council was formed on 1 July 1997 by the amalgamation of the District Council of Port Elliot and Goolwa, the District Council of Strathalbyn and a portion of the District Council of Willunga. The council is divided into five wards: Nangkita Kuitpo, Angas Bremer, Port Elliot Middleton, Strathalbyn and Goolwa Hindmarsh Island.

<span class="mw-page-title-main">Personal income in the United States</span>

Personal income is an individual's total earnings from wages, investment interest, and other sources. The Bureau of Labor Statistics reported a median weekly personal income of $1,139 for full-time workers in the United States in Q1 2024. For the year 2022, the U.S. Census Bureau estimates that the median annual earnings for all workers was $47,960; and more specifically estimates that median annual earnings for those who worked full-time, year round, was $60,070.

Gardenside is a neighborhood in southwestern Lexington, Kentucky, United States. Its boundaries are a combination of Darien Drive, Traveler Road, Appomattox Drive, and Alexandria Drive to the west, Wolf Run Creek to the north, Beacon Hill Drive to the east, and Lane Allen Road to the south.

<span class="mw-page-title-main">Poverty in New Zealand</span> Overview of poverty in New Zealand

Poverty in New Zealand deals with the incidence of relative poverty in New Zealand and its measurement. Between 1982 and 2011, New Zealand's gross domestic product grew by 35%. Almost half of that increase went to a small group who were already the richest in the country. During this period, the average income of the top 10% of earners in New Zealand almost doubled going from $56,300 to $100,200. The average income of the poorest tenth increased by only 13% from $9,700 to $11,000. Figures from 2016 show that about 15% of the population lives in poverty, compared to 9% in the 1980s, and 22% in 2004.

<span class="mw-page-title-main">Economic inequality in New Zealand</span> Overview of the economic inequality in New Zealand

Economic inequality in New Zealand is one of the social issues present in the country.

<span class="mw-page-title-main">Economy of the Australian Capital Territory</span>

The economy of the Australian Capital Territory (ACT) is the fastest-growing, sixth biggest economy of Australia as of the end of the 2017-18 financial year. Since the introduction of its self-government status in 1989, and with few exceptions in 1992, 1996, and 2014, the ACT economy has exhibited positive growth at a 1991-2018 average of 3.17 percent per year. A vast majority of the economy is concentrated in Canberra, the capital city of Australia, and is composed primarily (about 75%) by service industries, particularly those related to the administration of federal and local government. Construction also contributes to an important part of the economy, boosted by large government-funded projects and an active residential market. In contrast to other Australian states and territories, primary sectors such as agriculture, forestry, and mining, represent a very small proportion of the economy (±1%). A negative balance of trade has characterised the ACT economy since 2012-13, with small goods trade and a growing service export industry comprised mainly by education and public administration services.

References

  1. 1 2 "Australia's rich are getting richer. Everyone else is stagnating". The Guardian. 10 September 2015. ISSN   0261-3077 . Retrieved 9 March 2016.
  2. "New Zealand Income Survey (June 2004 quarter)". Archived from the original on 30 January 2016. Retrieved 16 May 2016.
  3. "Archived copy" (PDF). Archived from the original (PDF) on 23 February 2013. Retrieved 16 May 2016.{{cite web}}: CS1 maint: archived copy as title (link)
  4. "Archived copy" (PDF). Archived from the original (PDF) on 22 February 2013. Retrieved 16 May 2016.{{cite web}}: CS1 maint: archived copy as title (link)
  5. "Archived copy" (PDF). Archived from the original (PDF) on 22 February 2013. Retrieved 16 May 2016.{{cite web}}: CS1 maint: archived copy as title (link)
  6. "Archived copy" (PDF). Archived from the original (PDF) on 22 February 2013. Retrieved 16 May 2016.{{cite web}}: CS1 maint: archived copy as title (link)
  7. "New Zealand Income Survey: June 2010 quarter". www.stats.govt.nz.
  8. "Archived copy" (PDF). Archived from the original (PDF) on 22 February 2013. Retrieved 16 May 2016.{{cite web}}: CS1 maint: archived copy as title (link)
  9. "Archived copy" (PDF). Archived from the original (PDF) on 5 July 2017. Retrieved 16 May 2016.{{cite web}}: CS1 maint: archived copy as title (link)
  10. PPPs and exchange rates
  11. "June 2011 Income Survey". Statistics New Zealand. 1 June 2011. Retrieved 10 December 2011.
  12. "Household Income and Income Distribution, Australia, 2007–08". 20 August 2009. Retrieved 8 September 2009.
  13. "Household Income and Income Distribution, Australia, 2011–12 - Summary of Findings". Australian Bureau of Statistics. Retrieved 9 April 2015.
  14. "Household Income and Income Distribution, Australia, 2011–12" (PDF). Australian Bureau of Statistics. Retrieved 9 April 2015.
  15. "New Zealand Income Survey: June 2012 quarter". Statistics New Zealand. Retrieved 9 April 2015.
  16. Statistics, c=AU; o=Commonwealth of Australia; ou=Australian Bureau of (12 July 2019). "Main Features - Key Findings". www.abs.gov.au. Retrieved 13 August 2020.{{cite web}}: CS1 maint: multiple names: authors list (link)