This article's factual accuracy may be compromised due to out-of-date information. Please help update this article to reflect recent events or newly available information.(March 2024)
Energy consumption is dominated by oil and other fossil fules,[1] however, recently, due to the increasing effects of global warming and human-induced climate change on the global environment, there has been a shift towards renewable energy such as solar power and wind power both in Australia and abroad.[2][3] In 2022, renewable energy accounted for 39.4% of the total amount of electricity generated in Australia.[4]
Overview
Infographic showing Australian energy production, consumption, imports, and exports by fuel type and industry
In 2009, Australia had the highest per capita CO2 emissions in the world. At that time, Maplecroft's CO2 Energy Emissions Index (CEEI) showed that Australia releases 20.58 tons of CO2 per person per year, more than any other country.[6] However, emissions have since been reduced. From 1990 to 2017, emissions per capita fell by one-third, with most of that drop occurring in the more recent years. Additionally, the emissions intensity of the economy fell by 58.4 percent during the same time period. These are the lowest values in 27 years.[7]
In 2003, coal-fired plants produced 58.4% of the total capacity, followed by hydropower (19.1%, of which 17% is pumped storage), natural gas (13.5%), liquid/gas fossil fuel-switching plants (5.4%), oil products (2.9%), wind power (0.4%), biomass (0.2%) and solar (0.1%).[8]
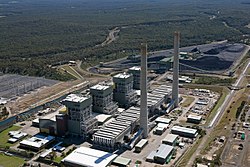
The total generating capacity from all sources in 2008-9 was approximately 51 gigawatts (68,000,000hp) with average capacity utilisation of 52%. Coal-fired plants constituted a majority of generating capacity which in 2008-9 was 29.4 gigawatts (39,400,000hp). In 2008–9, a total of 143.2 terawatt-hours (516PJ) of electricity was produced from black coal and 56.9 terawatt-hours (205PJ) from brown coal. Depending on the cost of coal at the power station, the long-run marginal cost of coal-based electricity at power stations in eastern Australia is between 7 and 8 cents per kWh, which is around $79 per MWh. In 2009, Australia was the fourth-highest coal producer in the world, producing 335 megatonnes (Mt) of anthracite (black coal) and 64 Mt of lignite (brown coal).[9] Australia was the biggest anthracite exporter, with 31% of global exports (262 Mt out of 836 Mt total). Lignite is not exported. 78% of its 2009 anthracite production was exported (262 Mt out of 335 Mt total). In this respect, Australia is an exception to most anthracite exporters. Australia's global anthracite export share was 14% of all production (836 Mt out of 5,990 Mt total).[10]
In 2021, Australia was the world's fifth-largest hard coal producer, following China, India, the United States, and Indonesia. Coal remained important to Australia's energy sector, representing 64% of domestic energy production, 32% of the Total Energy Supply (TES), and 53% of electricity generation. Moreover, Australia had the second-highest usage of coal in energy production and electricity generation among International Energy Agency (IEA) countries. Between 2010 and 2020, the share of coal in energy production dropped from 76% to 65%, in TES from 40% to 30%, and in electricity generation from 71% to 55%.[11]
In 2020, Australia operated 91 hard coal and three lignite mines, with over 200 coal deposits. Most hard coal mines were in Queensland (67%) and New South Wales (30%), while lignite mines were mainly in Victoria's Gippsland Basin, notably the Latrobe Valley.[11]
Natural gas
Proportion of national total of natural gas reserves, 2008Natural-gas pipeline in Western Australia, 2004
Australia's natural-gas reserves are an estimated 3,921 billion cubic metres (bcm), of which 20% are considered commercially proven (783 bcm). The gas basins with the largest recoverable reserves are the Carnarvon and Browse basins in Western Australia; the Bonaparte Basin in the Northern Territory; the Gippsland and Otway basins in Victoria and the Cooper-Eromanga basin in South Australia and Queensland. In 2014–2015 Australia produced 66 bcm of natural gas, of which approximately 80% was produced in Western Australia and Queensland regions.[12] Australia also produces LNG; LNG exports in 2004 were 7.9 Mt (10.7 bcm), 6% of world LNG trade.[13] Australia also has large deposits of coal seam methane (CSM), most of which are located in the anthracite deposits of Queensland and New South Wales.[13]
In 2021, natural gas was a major component of Australia's energy sector, accounting for 29% of energy production, 28% of the total energy supply (TES), 19% of electricity generation, and 17% of total final consumption (TFC). By sector, natural gas use was highest in electricity and heat generation at 33.9%, followed by the industrial sector at 23.3%. Residential buildings accounted for 10.8% of natural gas consumption, while the service sector and transport sector had smaller shares at 2.9% and 1.3%, respectively.[11]
Oil
Australia's oil production peaked in 2000, after gradually increasing since 1980.[18] Net oil imports rose from 7% of total consumption in 2000 to 39% in 2006. Decreasing domestic oil production is the result of the decline of oil-producing basins and few new fields going online.[18]
In 2021, oil comprises 52% of the Total Final Consumption (TFC) and 32% of the Total Energy Supply (TES). It contributes to 4% of domestic energy production and 1.8% of electricity generation. Oil consumption in 2020 was 892.3 thousand barrels per day (kb/d), with domestic transport consuming 65.4% of this amount. Industry, including non-energy consumption, accounted for 22.4%, international bunkering for 9.1%, buildings for 2.4%, and electricity and heat generation for 0.4%.[11]
Australia's oil shale resources are estimated at 58 billion barrels, or 4,531 million tonnes of shale oil. The deposits are located in the eastern and southern states, with the greatest feasibility in the eastern Queensland deposits. Between 1862 and 1952, Australia mined four million tonnes of oil shale. The mining stopped when government support ceased. Since the 1970s, oil companies have been exploring possible reserves. From 2000 to 2004, the Stuart Oil Shale Project near Gladstone, Queensland produced over 1.5million barrels of oil. The facility, in operable condition, is on care and maintenance and its operator (Queensland Energy Resources) is conducting research and design studies for the next phase of its oil-shale operations.[19] A campaign by environmentalists opposed to the exploitation of oil-shale reserves may also have been a factor in its closure.[20]
As of 2021, Australia no longer engages in the commercial production of oil shale.[11]
Biomass
Biomass power plants use crops and other vegetative by-products to produce power similar to the way coal-fired power plants work. Another product of biomass is extracting ethanol from sugar mill by-products. The GGAP subsidies for biomass include ethanol extraction with funds of $7.4M and petrol/ethanol fuel with funds of $8.8 million. The total $16.2M subsidy is considered a renewable energy source subsidy.[citation needed]
Biodiesel
Biodiesel is an alternative to fossil fuel diesel that can be used in cars and other internal combustion engine vehicles. It is produced from vegetable or animal fats and is the only other type of fuel that can run in current unmodified vehicle engines.
Subsidies given to ethanol oils totaled $15 million in 2003–2004, $44 million in 2004–2005, $76 million in 2005–2006 and $99 million in 2006–2007. The cost for establishing these subsidies were $1 million in 2005–2006 and $41 million in 2006–2007.[21]
However, with the introduction of the Fuel Tax Bill, grants and subsidies for using biodiesel have been cut leaving the public to continue using diesel instead.[22] The grants were cut by up to 50% by 2010–2014. Previously the grants given to users of ethanol-based biofuels were $0.38 per litre, which were reduced to $0.19 in 2010–2014.[23][24]
There are vast deep-seated granite systems, mainly in central Australia, that have high temperatures at depth and these are being drilled by 19 companies across Australia in 141 areas. They are spending A$654 million on exploration programs. South Australia has been described as "Australia's hot rock haven" and this emissions-free and renewable energy form could provide an estimated 6.8% of Australia's baseload power needs by 2030. According to an estimate by the Centre for International Economics, Australia has enough geothermal energy to contribute electricity for 450 years.[25]
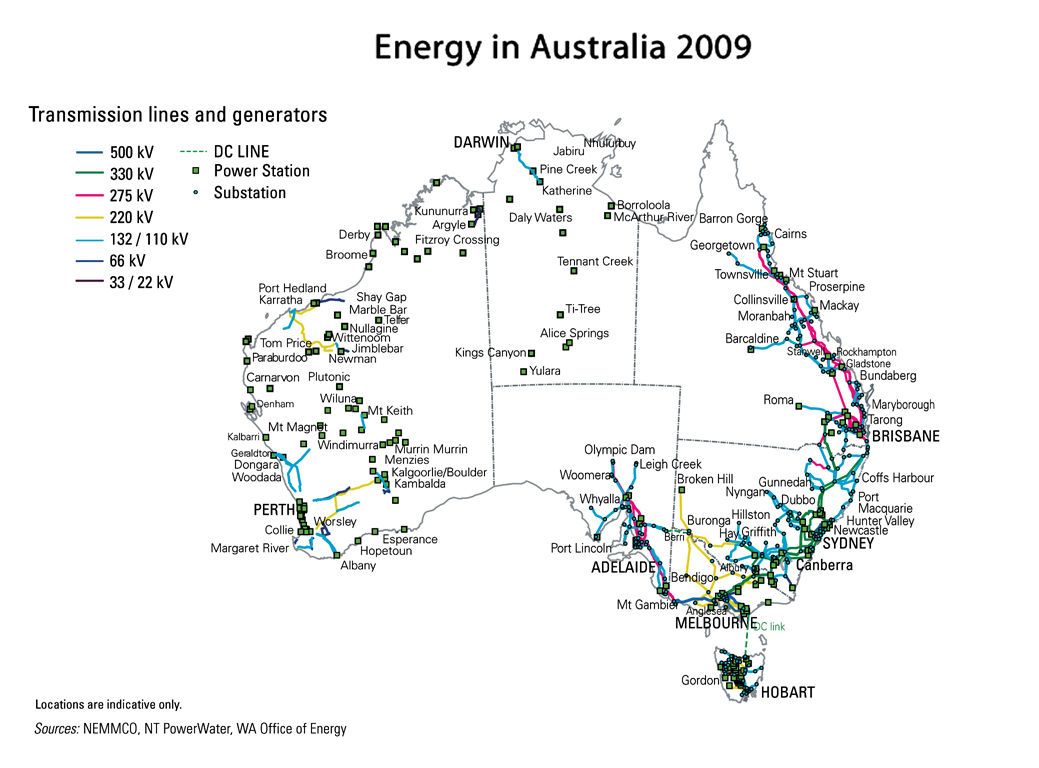
Since 2005, wind power and rooftop solar have led to an increasing share of renewable energy in total electricity generation.[28] Due to its large size and the location of its population, Australia lacks a single grid.[29]
Australian electricity generation, by fuel type (in GWh)[5]
Fin. Year
Black Coal
Natural Gas
Brown Coal
Oil
Other
Fossil Fuels
Solar
Wind
Hydro
Bio Energy
Renew- ables
2009-10
51.5% (124,478)
15.0% (36,223)
23.2% (55,968)
1.1% (2,691)
1.0% (2,496)
91.8%
0.1% (278)
2.0% (4,798)
5.2% (12,522)
0.9% (2,113)
8.2%
2010-11
46.3% (116,949)
19.4% (48,996)
21.9% (55,298)
1.2% (3,094)
1.1% (2,716)
89.9%
0.3% (850)
2.3% (5,807)
6.7% (16,807)
0.8% (2,102)
10.1%
2011-12
47.4% (120,302)
19.3% (48,892)
21.7% (55,060)
1.2% (3,070)
1.0% (2,500)
90.6%
0.6% (1,489)
2.4% (6,113)
5.5% (14,083)
0.9% (2,343)
9.4%
2012-13
44.8% (111,491)
20.5% (51,053)
19.1% (47,555)
1.8% (4,464)
0.8% (1,945)
86.9%
1.5% (3,817)
2.9% (7,328)
7.3% (18,270)
1.3% (3,151)
13.1%
2013-14
42.6% (105,772.4)
21.9% (54,393.9)
18.6% (46,076.2)
2.0% (5,012.4)
-
85.1%
2.0% (4,857.5)
4.1% (10,252.0)
7.4% (18,421.0)
1.4% (3,511.3)
14.9%
2014-15
42.7% (107,639)
20.8% (52,463)
20.2% (50,970)
2.7% (6,799)
-
86.3%
2.4% (5,968)
4.5% (11,467)
5.3% (13,445)
1.4% (3,608)
13.7%
2015-16
44.4% (114,295)
19.6% (50,536)
19.0% (48,796)
2.2% (5,656)
-
85.2%
2.7% (6,838)
4.7% (12,199)
6.0% (15,318)
1.5% (3,790)
14.8%
2016-17
45.8% (118,272)
19.6% (50,460)
16.9% (43,558)
1.9% (4,904)
-
84.3%
3.1% (8,072)
4.9% (12,597)
6.3% (16,285)
1.4% (3,501)
15.7%
2017-18
46.6% (121,702)
20.6% (53,882)
13.8% (36,008)
1.9% (4,904)
-
82.9%
3.8% (9,930)
5.8% (15,174)
6.1% (16,021)
1.3% (3,518)
17.1%
2018-19
45.4% (119,845)
20.0% (52,775)
13.1% (34,460)
1.9% (4,923)
-
80.3%
5.6% (14,849)
6.7% (17,712)
6.0% (15,967)
1.3% (3,496)
19.7%
2019-20
42.2% (111,873)
20.8% (55,216)
12.7% (33,649)
1.7% (4,509)
-
77.4%
7.9% (21,033)
7.7% (20,396)
5.7% (15,150)
1.3% (3,352)
22.6%
2020-21
40.0% (106,251)
18.7% (49,783)
12.8% (34,060)
1.8% (4,662)
-
73.3%
10.4% (27,717)
9.2% (24,535)
5.7% (15,200)
1.3% (3,346)
26.7%
2021-22
37.2% (101,076.2)
18.1% (49,280.2)
12.0% (32,515.6)
1.7% (4,664.0)
-
69.1%
12.8% (34,686.7)
10.7% (29,107.8)
6.3% (17,010.9)
1.2% (3,190.3)
30.9%
2022-23
35.0% (96,173.9)
17.8% (48,865.2)
11.5% (31,459.1)
1.8% (4,864.4)
-
66.1%
15.3% (41,968.5)
11.4% (31,384.9)
6.1% (16,666.1)
1.1% (3,092.8)
33.9%
2023-24
34.5% (96,9405.3)
17.3% (48,489.1)
11.5% (32,137.1)
1.7% (4,822.0)
-
65.0%
17.4% (48,600.2)
11.1% (30,992.0)
5.3% (14,960.1)
1.2% (3,301.9)
35.0%
Australian Electricity Generation by Type FY 2023-2024
As of 2011, electricity producers in Australia were not building gas-fired power stations,[30] while the four major banks were unwilling to make loans for coal-fired power stations, according to EnergyAustralia (formerly TRUenergy).[31] In 2014, an oversupply of generation was expected to persist until 2024.[32] However, a report published in 2017 by the Australian Energy Market Operator projected that energy supply in 2018 and 2019 is expected to meet demands, with a risk of supply falling short at peak demand times.[33]
From 2003 to 2013 real electric prices for households increased by an average of 72%. Much of this increase in price has been attributed to over-investment in increasing distribution networks and capacity. Further price increases are predicted to be moderate over the next few years (2017 on) due to changes in the regulation of transmission and distribution networks as well as increased competition in electricity wholesale markets as supply and demand merge.[34]
In 2021, Australia generated a total of 265 Terawatt-hours (TWh) of electricity. The breakdown of the electricity generation mix was as follows: coal at 52.9%, natural gas at 18.8%, solar at 10.5%, wind at 9.3%, hydro at 5.6%, oil at 1.8%, and bioenergy and waste at 1.3%. Electricity consumption for the year was 239 TWh, with the industry sector consuming 43%, residential buildings and service sector buildings each contributing 27% to the total consumption, and the transport sector accounting for 3%.[11] The increase in solar power has expanded the duck curve, and 4.5 TWh of solar and wind power was curtailed in 2024.[35] The large increase in battery capacity complements variations for incumbent generators, but also occasionally set a high market price for electricity.[36][37] A $7.2 billion four-year virtual power plant program was introduced in July 2025. It may yield 6 GWh of house batteries, and 4.7 GWh had been added by January 2026.[38][39]
Renewable energy has potential in Australia, and the Climate Change Authority is reviewing the 20-percent Renewable Energy Target (RET). The production of 50 megawatts of wind power (power for nearly 21,000 homes annually) creates about 50 construction jobs and five staff positions.[41][42] In recent years, wind and solar power have been the fastest growing source of energy in Australia.[43]Geothermal energy is also growing, but at the present time, it only accounts for a small portion of energy in Australia.
Energy efficiency
Lower energy use could save A$25billion, or A$840 per electricity customer, according to EnergyAustralia.[44]
Australian total emissions in 2007 were 396 million tonnes of CO2. That year, the country was among the top polluter nations of the world per capita. Australian per-capita emissions of carbon dioxide in 2007 were 18.8 tons of CO2, compared to the EU average of 7.9 tons. The change in emissions from 1990 to 2007 was +52.5 percent, compared to the EU's -3.3 percent.[45] The per-capita carbon footprint in Australia was rated 12th in the world by PNAS in 2011.[46]
Due to climate change, Australia is expected to experience harsher extreme weather events, mainly bush-fires and floods during summer.[47] Rising sea levels are of particular concern for Australia, because most of the population lives on the coast (around 85%).[48]
Employment
Total employment in the electricity-supply industry (thousands of people) since 1984Proportion of adult population employed in the electricity, gas, water, and waste services industries by statistical local area, as of the 2011 census
When analysing employment data, the Australian Bureau of Statistics classifies the electricity and gas supply industry as part of the Electricity, Gas, Water and Waste Services Division.[49] That division is the smallest industry in Australia in terms of employment.[50]
In November 2017, the number of people employed in electricity supply, which includes electricity generation, transmission and distribution, was 64,200 (47,700 males, 16,600 females).[51] The number of people employed in gas supply was 11,200 (9,000 males, 2,200 females).[51] The total number of persons employed in electricity and gas supply industries was 75,400.[51] This represents about 0.67 percent of all employed persons in Australia.[a]
In 2016, the major occupations in this division were truck drivers (9,900), electricians (7,700), electrical distribution trades workers (5,400), and electrical engineers (4,400).[52][a]
Employment in renewable energy activities
In 2015–16, annual directfull-time equivalent employment in renewable energy in Australia was estimated at 11,150. Employment in renewables peaked in 2011–12, probably due to the employment of construction workers to build renewable energy facilities. However, it decreased by 36 percent in 2014–15, and by a further 16 percent in 2015–16. The decline is attributed to a decrease in the number of roof-top solar photovoltaic systems being installed on houses. Once construction of renewable energy facilities is completed, and only ongoing maintenance is required, employment falls quite significantly.[53]
For most Australian states and territories the major contributor to employment in renewable energy is solar power. Employment in roof-top solar photovoltaic systems, including solar hot water systems, comprised half of all employment in renewable energy in 2015–16. Employment in large scale solar and wind power is driven primarily by installation activity, rather than ongoing operation and maintenance.[53]
In Western Australia, 93 percent of all jobs in renewable energy are in solar power. The proportion of employment in biomass is significantly greater in Queensland (42 percent), where the sugar industry makes great use of sugar cane to generate electricity for sugar milling and to feed into the grid. Most jobs in Tasmania's renewable energy industry are in hydropower (87 percent).[53]
Jobs in the renewable energy industry are forecast to grow substantially by 2030, driven by growth in electricity demand and new renewable energy capacity.[54]:16 Conversely, jobs associated with coal-fired power stations are forecast to decline as those plants age and close. Such job losses would disproportionately affect some regional areas, such as the Latrobe Valley in Victoria, Newcastle and the Hunter Valley in New South Wales, Gladstone and Rockhampton in Queensland, and Collie in Western Australia. However, it is expected that the number of jobs created in renewable energy will far exceed the number of jobs lost in coal-based generation.[54]:35
↑Energy, Department of the Environment and (26 July 2017). "Department of the Environment and Energy". Department of the Environment and Energy. Retrieved 7 September 2017.
This page is based on this Wikipedia article Text is available under the CC BY-SA 4.0 license; additional terms may apply. Images, videos and audio are available under their respective licenses.


