The Russell Group is a self-selected association of twenty-four publicresearch universities in the United Kingdom. The group is headquartered in Cambridge and was established in 1994 to represent its members' interests, principally to government and Parliament. It was incorporated in 2007.[3] Its members are often perceived as being the UK's best universities, which has been widely disputed.[4]
As of 2017,[update] Russell Group members receive over three-quarters of all university research grant and contract income in the United Kingdom.[5] Russell Group members award 60% of all doctorates gained in the United Kingdom.[5] In the 2021 Research Excellence Framework, Russell Group universities accounted for 65% of all world-leading (4*) research conducted in the UK, and 91% of the Russell Group's research was judged to be world-leading (4*) or internationally excellent (3*).[6] In the 2023 Teaching Excellence and Student Outcomes Framework (TEF), of the 20 English Russell Group universities which were assessed, 7 hold gold awards (35%) and 13 silver (65%). This compares to proportions across 128 higher education institutions of which 29% hold gold, 62% silver, and 9% bronze.[7] Their graduates hold 61% of all UK jobs that require a university degree, despite being only 17% of all higher education graduates.[8][9]
The Russell Group is named after the location of the first informal meetings of the Group, which took place at the Hotel Russell in Russell Square, London.[10]
History
The Russell Group of universities was formed in 1994 by 17 British research universities – Birmingham, Bristol, Cambridge, Edinburgh, Glasgow, Imperial College London, Leeds, Liverpool, London School of Economics, Manchester, Newcastle, Nottingham, Oxford, Sheffield, Southampton, University College London and Warwick, who originally met at Hotel Russell shortly before meetings of the Committee of Vice-Chancellors and Principals (now Universities UK) in nearby Tavistock Square, close to the University of London buildings and, particularly, Senate House.[10][11] With the exception of Warwick (established in the 1960s), the founder members of the group were all universities or university colleges prior to World War I, including most of Britain's ancient universities and "redbrick universities". In 1998, Cardiff University and King's College London joined the group.[12]
In March 2001, the Russell Group decided against selecting a preferred option for the future funding of higher education, stating that endowments, a graduate contribution, increased public funding and top-up fees should all remain options.[13] In December 2005, it was announced that the Russell Group would be appointing its first full-time director-general as a result of a planned expansion of its operations, including commissioning and conducting its own policy research.[14] In November 2006, Queen's University Belfast was admitted as the twentieth member of the group.[15] In the same month Wendy Piatt, the then deputy director in the Prime Minister's strategy unit, was announced as the group's new Director General and chief executive.[15]
In March 2012, it was announced that four universities – Durham, Exeter, Queen Mary University of London; and York – would become members of the Russell Group in August of the same year.[10] All of the new members had previously been members of the 1994 Group of British universities.[10]
In January 2013, it was announced that the Russell Group would establish an academic board to advise the English exams watchdog Ofqual on the content of A-Levels.[16] In 2019, the group launched the website "Informed Choices" to advise school children on which A-level subject choices were useful for various degree courses, replacing an earlier teachers' guide of the same name from 2011 that had identified a list of "facilitating subjects'.[17][18]
The Russell Group states that "its aim is to help ensure that our universities have the optimum conditions in which to flourish and continue to make social, economic and cultural impacts through their world-leading research and teaching".[3]
It works towards this by lobbying the UK government and parliament; commissioning reports and research; creating a forum in which its member institutions can discuss issues of common concern; and identify opportunities for them to work together.
Leadership
The Russell Group is led by Chief Executive Tim Bradshaw and chaired by Chris Day, Vice-Chancellor of the University of Newcastle.[2]
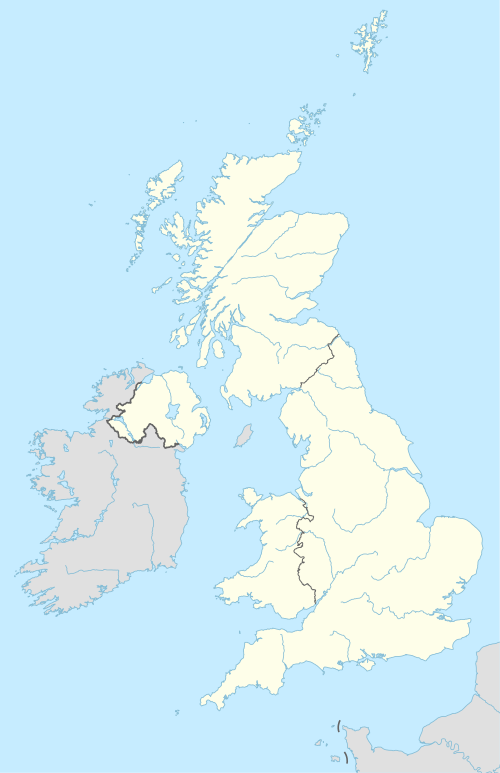
The Russell Group currently has twenty-four members,[11] of which twenty are from England, two from Scotland, and one from each of Wales and Northern Ireland. Of the English members, five are from Greater London; three from the Yorkshire and the Humber region; two from each of the North East, North West, West Midlands, South West and South East regions; and one from each of the East Midlands and East regions. Four Russell Group members are constituent colleges of the University of London and a fifth London institution, Imperial College London, was part of the University of London until 2007.
The table below gives the members of the group, along with when they joined, their student and staff numbers, and their latest Teaching Excellence Framework overall rating (non-English universities were not assessed).
Notes: ‡ Member institution of the University of London, awarding its own degrees * Achieved 'Gold' rating in all three categories of the assessment † Achieved overall 'Silver' rating with one category rated 'Bronze'
Status
Research
In 2022/23, following the 2021 Research Excellence Framework (REF), the English universities of the Russell Group saw their share of recurring research funding from Research England drop by 2.71 percentage points from the 2021/22 funding (based on the previous 2014 REF) to 68.21 per cent, although most institutions saw a rise in actual funding levels due to an overall increase in funding. The top 19 English institutions in terms of funding continued to all be from the Russell Group, with the top 20 being rounded off, as before, by Lancaster. The LSE was, as in previous REF rounds, the exception, ranking 31st in terms of funding (down from 23rd in 2021/11) and seeing a nine per cent fall (£1.7million) in its allocation.[22]
In 2015/16, following the 2014 REF, the 19 English universities with HEFCE research funding allocations (excluding transitional funding) in excess of £20million were all members of the Russell Group. The only English Russell Group institution to receive an allocation below £20million was the LSE (£18.6million), which ranked 22nd behind the Universities of Leicester and Lancaster (both on £19million).[23]
In 2010/11, 19 of the 20 UK universities with the highest income from research grants and contracts were members of the Russell Group.[24] In terms of total research funding allocations from the Higher Education Funding Council for England (HEFCE) in 2007/8, the top 15 universities were all Russell Group institutions.[25]LSE was 21st, due to its focus on less costly social sciences research. Queen's University Belfast, Cardiff, Glasgow and Edinburgh, were not included in this table, as they are not English institutions. The Russell Group institutions received 82% of the total HEFCE research funding allocation.[25]
The research funding figures depend on factors other than the quality of research, in particular there are variations due to institutional size and subject spread (e.g. science, technology and medicine tend to attract more money).
In 2008, 18 of the then 20 members were positioned in the top 20 of Research Fortnight's Research Assessment Exercise 'Power' Table. The other two places were occupied by Durham University and Queen Mary University of London, which were not then Russell Group members but have since joined. The two Russell Group institutions outside the top 20 were QUB (21st) and the LSE (27th), while the other two universities to have since joined were York (22nd) and Exeter (25th).[26] In the equivalent table for the 2014 Research Excellence Framework, the 24 Russell Group members occupied the top 24 positions, with the University of Lancaster in 25th being the highest-ranked non-Russell Group university.[27]
In 2023, all eight UK universities in the ARWU top 100, seventeen of the eighteen in the QS top 100 (the other place being occupied by the University of St Andrews), and all ten in the THE top 100 are members of the Russell Group. The Russell Group provides seven of the top ten in the Complete, Guardian, and Times/Sunday Times.
All but two of the universities in the Russell Group are part of the Sutton Trust's group of 30 highly selective universities, the Sutton 30 (the absent members being Queen Mary University of London and Queen's University Belfast).[34] The Sutton 13 group of the 13 most highly selective universities only includes one non-Russell Group member, the University of St Andrews.[35]
The top 10 by average UCAS points of new undergraduate students in 2021–22 included three non-Russell Group universities: St Andrews (1st: 212 points), Strathclyde (2nd: 210 points), and Aberdeen (joint 10th with Durham: 185 points).[36] The top 10 by lowest offer rate to new undergraduate students in 2024-25 included three non-Russell Group universities: St Andrews (4th; 30.0%), St George's (7th; 42.0%) and University of the Arts London (10th; 48.4%). The average offer rate, including conditional and unconditional offers, across 'higher tariff' UK institutions (as defined by UCAS) was 63.3% in 2024.[37]
Notes: a The average UCAS tariff achieved by new undergraduate students entering the university in 2021–22. This is based on qualifications achieved, for example A-levels: A* = 56, A = 48, B = 40 UCAS points; IBO Certificate in Higher Level: H7 = 56, H6 = 48, H5 = 32.[38] b The average offer rate for June deadline undergraduate applicants (all ages) in 2024.
Finances
The Russell Group accounted for 49.1% of the income of the higher education sector in the UK in 2013–14, having risen from 44.7% of the total in 2001–02. Over the same period the total income of Russell Group universities rose by 69.9% in real terms, compared to a sector average of 54.4%.[39] Russell Group universities are also seen as "particularly creditworthy" due to their membership of the group, allowing them to borrow money at low interest rates.[40]
The total annual income for Russell Group members for 2023/24 was £25.31 billion (2020/21 – £20.30 billion) of which £5.67 billion (2020/21 – £4.77 billion) was from research grants and contracts, with an operating surplus of £6.50 billion (2020/21 – £1.15 billion). Russell Group universities hold a total endowment value of £6.66 billion excluding colleges (2020/21 – £6.18 billion) and net assets of £41.08 billion (2020/21 – £31.52 billion). The table below is a record of each Russell Group member's financial data for the 2023/24 financial year.
In a statement made in 2014 to the Higher Education Policy Institute, David Watson of the University of Oxford suggested that the Russell Group's claim to represent 24 'leading universities' was "a real stretch". In the context of the Russell Group's reputation in the sector, he continued: "particularly dangerous, I think, is the bottom half of the Russell Group...The problem with the Russell Group is that it represents neither the sector as a whole [nor], in many cases, the best of the sector". Performance in research intensity showed that there were dozens of other UK universities "above the bottom Russellers".[65]
A Durham University academic, Vikki Boliver, published a report in 2015 claiming that the prestigious position of the Russell Group was not based on evidence, but rather successful marketing. Only the universities of Oxford and Cambridge were significantly more elite than the majority of "old" universities when a grouping analysis was performed using data on academic selectivity, research activity, teaching quality, socio-economic exclusivity and economic resources. The other 22 members of the Russell Group sit in a second tier of universities along with 17 other "old" universities (Aberdeen, Bath*, Dundee, East Anglia*, Goldsmiths*, Heriot-Watt, Kent, Lancaster*, Leicester*, Loughborough*, Reading*, Royal Holloway*, St Andrews*, SOAS*, Strathclyde, Surrey* and Sussex*), mostly comprising former members of the defunct 1994 Group (shown by asterisks). Another 13 "old" universities and 54 "new" universities made up a third tier, with a fourth tier of 19 "new" universities. Within each tier, the differences between the institutions were less significant than the differences between the tiers.[66][67] This reflected an earlier result from 2010 that, when the "Golden Triangle" universities (defined in the study as Oxford, Cambridge, Imperial, LSE, and UCL) were omitted, the remaining (then) members of the Russell Group were outperformed by the (then) members of the 1994 Group.[68]
Ant Bagshaw from the Wonkhe think-tank has criticised the use of Russell Group membership as a proxy for selectivity in official Department for Education reports and statistics, as better measures of selectivity are available from UCAS data. He states that the idea that "Russell Group membership is synonymous with 'best'" is "persistent, but unverified". He also notes that this may lead to less scrutiny of the performance of non-Russell Group selective universities with respect to widening participation and improving access.[69]
Protectionism
The Institute of Economic Affairs has argued that the Russell Group acts out of protectionist interests. It is claimed that this will "restrict competition, discourage innovation and encourage inefficiency, thereby depriving students of lower prices and/or greater choice".[70]
Sustainability
The twenty-four universities in the Russell Group are responsible for around half of the Scope 1 and 2 carbon emissions of the UK university sector.[71][bettersourceneeded] The Group as a whole has been criticised for an inconsistent and inadequate response to the need to identify emissions and take reduction measures.[72] An Environmental Sustainability Network was announced by the Russell Group in December 2019;[73] as of November 2021 no outcomes from this had been announced.
Widening access
Analysis by the Labour Party in 2018 found that the number of students from disadvantaged areas has only increased by one percentage point since 2010.[74]
In 2015, Durham academic Vikki Bolívar published a paper, Lies, damned lies, and statistics on widening access to Russell Group universities, criticising the statistical analysis in the Russell Group publication Opening Doors. This had said that "real progress has been made over the last few years" in widening access, but Bolívar highlighted four areas where the statistics used to justify this claim were misleading. She also pointed out that there was "a growing body of statistical research evidence which indicates that one important barrier to widening access at Russell Group universities is that applicants from less advantaged social backgrounds are less likely to be offered places at these universities than comparably qualified applicants from more advantaged social groups" that had not been mentioned in the Russell Group report.[75]
UCAS statistics on offers to applicants from low/high participation neighbourhoods (2022)[76]
a – difference between the actual offer rate and the offer rate expected if predicted grades and subject choice were the only factors b – indicates significantly higher (+), significantly lower (-) or no significant difference from expected rate (blank)
1 2 "About". Russell Group. Archived from the original on 30 October 2021. Retrieved 29 October 2018.
↑ Blackmore, Paul (29 March 2016). "Universities vie for the metric that cannot be measured: prestige". The Guardian. Archived from the original on 30 March 2023. Retrieved 16 January 2023. The Russell Group has successfully stage-managed the position that it is seen as comprising the best universities. Some are and some aren't, but by and large this is nonsense. However, parents increasingly say they want their child to go to one. Pre-92 head.
1 2 "Profile"(PDF). Russell Group. June 2017. pp.6–7. Archived(PDF) from the original on 12 January 2024. Retrieved 29 October 2018.
↑ Camilla Turner (23 May 2019). "Bright teenagers risk having university plans 'scuppered' by bad A-levels advice, Russell Group warns". Daily Telegraph.
↑ "Informed choices"(PDF). Russell Group. Archived(PDF) from the original on 7 March 2023. Retrieved 22 March 2023.
↑ Zoë Corbyn (25 March 2010). "Data disprove case for distributing research funds on historical basis". Times Higher Education. Archived from the original on 10 March 2016. Retrieved 20 February 2016. The analysis, due to be published on 25 March, uses citation data to show that when the five "golden-triangle" institutions – the universities of Oxford and Cambridge, Imperial College London, University College London and the London School of Economics – are removed from the Russell Group of large research-intensive universities, the 1994 Group of smaller research-led universities outperforms it.
This page is based on this Wikipedia article Text is available under the CC BY-SA 4.0 license; additional terms may apply. Images, videos and audio are available under their respective licenses.