| |||||||||||||||||||||||||
All 54 seats to Sutton London Borough Council 28 seats needed for a majority | |||||||||||||||||||||||||
---|---|---|---|---|---|---|---|---|---|---|---|---|---|---|---|---|---|---|---|---|---|---|---|---|---|
| |||||||||||||||||||||||||
Map of the results of the 2018 Sutton council election. Conservatives in blue, Liberal Democrats in yellow and Independents in grey. | |||||||||||||||||||||||||
|
The 2018 Sutton Council election took place on 3 May 2018 to elect members of Sutton Council in London. [1] This was on the same day as other local elections.
The Liberal Democrats retained control winning 33 seats (−12) with the Conservatives winning 18 seats (+9) and independent candidates winning 3 seats from the Liberal Democrats in Beddington North. [1] [2]
Party | Seats | Gains | Losses | Net gain/loss | Seats % | Votes % | Votes | +/− | |
---|---|---|---|---|---|---|---|---|---|
Liberal Democrat | 33 | 1 | 13 | -12 | 61.1 | 38.8 | 69,320 | -4.2 | |
Conservative | 18 | 10 | 1 | +9 | 33.3 | 36.3 | 64,945 | +6.5 | |
Labour | 0 | 0 | 0 | 0 | 17.8 | 31,753 | +3.2 | ||
Green | 0 | 0 | 0 | 0 | 2.5 | 4,478 | -0.5 | ||
Independent | 3 | 3 | 0 | +3 | 5.6 | 2.3 | 4,128 | +2.2 | |
UKIP | 0 | 0 | 0 | 0 | 2.3 | 4,083 | -6.0 | ||
Christian Peoples | 0 | 0 | 0 | 0 | 0.0 | 69 | -0.1 | ||
National Front | 0 | 0 | 0 | 0 | 0.0 | 49 | n/a |
Party | Candidate | Votes | % | ± | |
---|---|---|---|---|---|
Independent | Nick Mattey * | 1,285 | 36.3 | ||
Independent | Tim Foster | 1,047 | 29.6 | ||
Independent | Jillian Green | 948 | 26.8 | ||
Conservative | Malcolm Brown | 911 | 25.7 | ||
Liberal Democrat | Pat Ali* | 837 | 23.7 | ||
Labour | Sarah Gwynn | 829 | 23.4 | ||
Conservative | Alison Huneke | 829 | 23.4 | ||
Conservative | Andy Williams | 784 | 22.2 | ||
Labour | John Key | 725 | 20.5 | ||
Liberal Democrat | Brendan Hudson | 713 | 20.1 | ||
Labour | Charlie Mansell | 663 | 18.7 | ||
Liberal Democrat | Nighat Piracha* | 660 | 18.6 | ||
Green | Shasha Khan | 208 | 5.9 | ||
UKIP | Hannah Hamilton | 106 | 3.0 | ||
UKIP | Kingsley Hamilton | 94 | 2.7 | ||
Rejected ballots | 4 | ||||
Turnout | 3,543 | 43.85 | |||
Independent gain from Liberal Democrat | Swing | ||||
Party | Candidate | Votes | % | ± | |
---|---|---|---|---|---|
Liberal Democrat | Edward Joyce* | 1,450 | 44.8 | ||
Liberal Democrat | Manuel Abellan* | 1,445 | 44.6 | ||
Liberal Democrat | Mo Saqib | 1,403 | 43.3 | ||
Conservative | Neil Garratt* | 1,334 | 41.2 | ||
Conservative | Ann Page | 1,239 | 38.2 | ||
Conservative | Jim Simms | 1,226 | 37.8 | ||
Labour | Christine Cullen | 492 | 15.2 | ||
Labour | Arnaldo Savignani | 421 | 13.0 | ||
Labour | Alan Tate | 380 | 11.7 | ||
UKIP | Peter Smith | 134 | 4.1 | ||
UKIP | David Usher | 107 | 3.3 | ||
UKIP | Terence Smith | 105 | 3.2 | ||
Rejected ballots | 8 | ||||
Turnout | 3,248 | 38.42 | |||
Liberal Democrat hold | Swing | ||||
Liberal Democrat gain from Conservative | Swing | ||||
Liberal Democrat hold | Swing |
Party | Candidate | Votes | % | ± | |
---|---|---|---|---|---|
Conservative | David Hicks* | 2,001 | 61.1 | ||
Conservative | Patrick McManus* | 1,900 | 58.0 | ||
Conservative | Jane Pascoe* | 1,836 | 56.0 | ||
Liberal Democrat | Dean Juster | 956 | 29.2 | ||
Liberal Democrat | Alex Vicente-Machado | 786 | 24.0 | ||
Liberal Democrat | Abdullah Okuyucu | 748 | 22.8 | ||
Labour | Gale Blears | 595 | 18.2 | ||
Labour | Margaret Sinclair | 524 | 16.0 | ||
Labour | Marian Wingrove | 503 | 15.3 | ||
Rejected ballots | 10 | ||||
Turnout | 3,287 | 41.39 | |||
Conservative hold | Swing | ||||
Conservative hold | Swing |
Party | Candidate | Votes | % | ± | |
---|---|---|---|---|---|
Liberal Democrat | Jill Whitehead* | 1,673 | 45.3 | ||
Liberal Democrat | Chris Williams | 1,646 | 44.5 | ||
Liberal Democrat | Jake Short | 1,576 | 42.6 | ||
Conservative | Lynne Fletcher | 1,384 | 37.4 | ||
Conservative | Matthew Drew | 1,302 | 35.2 | ||
Conservative | Ethan Smith | 1,289 | 34.9 | ||
Labour Co-op | Marilynne Burbage | 459 | 12.4 | ||
Labour Co-op | Margaret Onians | 441 | 11.9 | ||
Labour Co-op | Tony Thorpe | 430 | 11.6 | ||
Green | Karin Andrews | 334 | 9.0 | ||
Green | Bob Steel | 255 | 6.9 | ||
Green | Gay McDonagh | 238 | 6.4 | ||
Christian Peoples | Ashley Keith | 69 | 1.9 | ||
Rejected ballots | 4 | ||||
Turnout | 3,701 | 45.32 | |||
Liberal Democrat hold | Swing | ||||
Liberal Democrat hold | Swing |
Party | Candidate | Votes | % | ± | |
---|---|---|---|---|---|
Liberal Democrat | Amy Haldane* | 1,809 | 47.9 | ||
Conservative | Moira Butt* | 1,767 | 46.8 | ||
Conservative | Tim Crowley* | 1,747 | 46.3 | ||
Conservative | Melissa Pearce | 1,596 | 42.3 | ||
Liberal Democrat | Gordon Roxburgh | 1,544 | 40.9 | ||
Liberal Democrat | Jason Reynolds | 1,524 | 40.4 | ||
Labour | John Clay | 376 | 10.0 | ||
Labour | Anas Khan | 343 | 9.1 | ||
Labour | Christine Savignani | 340 | 9.0 | ||
Green | Ross Hemingway | 295 | 7.8 | ||
Rejected ballots | 6 | ||||
Turnout | 3,782 | 48.37 | |||
Liberal Democrat hold | Swing | ||||
Conservative hold | Swing | ||||
Conservative hold | Swing |
Party | Candidate | Votes | % | ± | |
---|---|---|---|---|---|
Conservative | Holly Ramsey* | 2,202 | 58.5 | ||
Conservative | Eric Allen | 2,066 | 54.9 | ||
Conservative | Elliot Colburn | 1,900 | 50.5 | ||
Liberal Democrat | Mary Burstow* | 1,711 | 45.4 | ||
Liberal Democrat | Anisha Callaghan | 1,292 | 34.3 | ||
Liberal Democrat | Monica Tyler | 1,253 | 33.3 | ||
Labour | Victoria Barlow | 315 | 8.4 | ||
Labour | Jane Rodger | 288 | 7.6 | ||
Labour | Helen Martin | 287 | 7.6 | ||
Rejected ballots | 10 | ||||
Turnout | 3,775 | 45.29 | |||
Conservative gain from Liberal Democrat | Swing | ||||
Conservative hold | Swing | ||||
Conservative hold | Swing |
Party | Candidate | Votes | % | ± | |
---|---|---|---|---|---|
Conservative | Martina Allen | 1,681 | 45.7 | ||
Conservative | Peter Geiringer | 1,466 | 39.9 | ||
Conservative | James McDermott-Hill | 1,405 | 38.2 | ||
Liberal Democrat | Samantha Bourne* | 1,405 | 38.2 | ||
Liberal Democrat | Richard Broadbent* | 1,287 | 35.0 | ||
Liberal Democrat | Cliff Mason | 1,243 | 33.8 | ||
Independent | Richard Johnson | 848 | 23.1 | ||
Labour | Kirsty Archer | 542 | 14.7 | ||
Labour | Kerrie Peek | 370 | 10.1 | ||
Labour | Karon Whitham | 334 | 9.1 | ||
UKIP | Howard Cowley | 189 | 5.1 | ||
UKIP | Bill Goddard | 138 | 3.8 | ||
UKIP | David Taffurelli | 126 | 3.4 | ||
Rejected ballots | 4 | ||||
Turnout | 3,680 | 44.63 | |||
Conservative gain from Liberal Democrat | Swing | ||||
As James McDermott-Hill (Conservative) and Samantha Bourne (Lib Dems) were tied on 1,405 votes each. Lots were drawn and McDermott-Hill won the seat. [11]
The Conservative Party, officially the Conservative and Unionist Party, is a centre-right political party in the United Kingdom. Presently led by Theresa May, it has been the governing party since 2010. It presently has 314 Members of Parliament in the House of Commons, 249 members of the House of Lords, and 18 members of the European Parliament. It also has 31 Members of the Scottish Parliament, 12 members of the Welsh Assembly, eight members of the London Assembly and 9,008 local councillors. One of the major parties of UK politics, it has formed the government on 45 occasions, more than any other party.
The Liberal Democrats are a liberal, centrist political party in the United Kingdom. They presently have 11 Members of Parliament in the House of Commons, 96 members of the House of Lords, and one member of the European Parliament. They also have five Members of the Scottish Parliament and a member each in the Welsh Assembly and London Assembly. The party reached the height of its influence in the early 2010s, forming a junior partner in a coalition government from 2010 to 2015. It is presently led by Vince Cable.
Party | Candidate | Votes | % | ± | |
---|---|---|---|---|---|
Liberal Democrat | Jean Crossby* | 1,063 | 41.8 | ||
Liberal Democrat | Martin Gonzalez* | 977 | 38.4 | ||
Liberal Democrat | Annie Moral | 922 | 36.3 | ||
Labour | Nick Diamantis | 876 | 34.5 | ||
Labour | Maggie Hughes | 800 | 31.5 | ||
Labour | Patrick Sim | 745 | 29.3 | ||
Conservative | Steven Ayres | 583 | 22.9 | ||
Conservative | Simon Densley | 513 | 20.2 | ||
Conservative | Simon Higgs | 497 | 19.6 | ||
UKIP | John Brereton | 255 | 10.0 | ||
UKIP | Eleanor Smith | 180 | 7.1 | ||
UKIP | Ian Rawat | 178 | 7.0 | ||
National Front | Richard Edmonds | 49 | 1.9 | ||
Rejected ballots | 8 | ||||
Turnout | 2,549 | 29.21 | |||
Liberal Democrat hold | Swing | ||||
Liberal Democrat hold | Swing |
Party | Candidate | Votes | % | ± | |
---|---|---|---|---|---|
Conservative | Jed Dwight | 1,505 | 44.8 | ||
Conservative | Param Nandha | 1,414 | 42.1 | ||
Conservative | Ryan Stoneman | 1,374 | 40.9 | ||
Liberal Democrat | Nick Emmerson* | 1,087 | 32.4 | ||
Liberal Democrat | Miguel Javelot* | 969 | 28.9 | ||
Liberal Democrat | Peter Okenla | 921 | 27.4 | ||
Labour | Ray Eveleigh | 699 | 20.8 | ||
Labour | Paul Prior | 663 | 19.7 | ||
Labour | Gerald Tasker | 558 | 16.6 | ||
Green | Claire Jackson-Prior | 262 | 7.8 | ||
Green | Cumar Saha | 254 | 7.6 | ||
UKIP | Glen Roberts | 147 | 4.4 | ||
UKIP | Simon Stuart | 121 | 3.6 | ||
UKIP | Nicholas Smith | 106 | 3.2 | ||
Rejected ballots | 6 | ||||
Turnout | 3,363 | 40.01 | |||
Conservative gain from Liberal Democrat | Swing | ||||
Party | Candidate | Votes | % | ± | |
---|---|---|---|---|---|
Liberal Democrat | David Bartolucci* | 1,259 | 40.3 | ||
Liberal Democrat | Rich Clare | 1,236 | 39.6 | ||
Liberal Democrat | Ali Mirhashem* | 1,114 | 35.7 | ||
Labour | Steve Adams | 1,082 | 34.6 | ||
Labour | Bonnie Craven | 961 | 30.8 | ||
Labour | Vic Paulino | 905 | 29.0 | ||
Conservative | Nigel Cornwell | 789 | 25.3 | ||
Conservative | Marie Grant | 756 | 24.2 | ||
Conservative | Alan Plant | 727 | 23.3 | ||
Green | Peter Friel | 293 | 9.4 | ||
UKIP | Jess Beadle | 154 | 4.9 | ||
UKIP | Charlie Wood | 112 | 3.6 | ||
Rejected ballots | 8 | ||||
Turnout | 3,132 | 33.69 | |||
Liberal Democrat hold | Swing | ||||
Liberal Democrat hold | Swing |
Party | Candidate | Votes | % | ± | |
---|---|---|---|---|---|
Liberal Democrat | Ruth Dombey* | 1,350 | 42.1 | ||
Liberal Democrat | Marlene Heron* | 1,263 | 39.4 | ||
Liberal Democrat | Stephen Penneck* | 1,222 | 38.1 | ||
Conservative | Emma Scully | 1,134 | 35.3 | ||
Conservative | Vikki Shields | 1,032 | 32.2 | ||
Conservative | Terry Woods | 1,021 | 31.8 | ||
Labour | Teresa O'Brien | 754 | 23.5 | ||
Labour | Emily Brothers | 742 | 23.1 | ||
Labour | Victoria Richer | 681 | 21.2 | ||
UKIP | Andrew Beadle | 155 | 4.8 | ||
UKIP | Julie Beach | 140 | 4.4 | ||
UKIP | Ernest Ford | 140 | 4.4 | ||
Rejected ballots | 4 | ||||
Turnout | 3,213 | 39.68 | |||
Liberal Democrat hold | Swing | ||||
Liberal Democrat hold | Swing |
Party | Candidate | Votes | % | ± | |
---|---|---|---|---|---|
Conservative | Tony Shields* | 1,383 | 44.3 | ||
Liberal Democrat | Richard Clifton* | 1,347 | 43.1 | ||
Liberal Democrat | Trish Fivey* | 1,303 | 41.7 | ||
Conservative | Vanessa Udall | 1,295 | 41.5 | ||
Conservative | David Slaughter | 1,285 | 41.1 | ||
Liberal Democrat | Ed Parsley | 1,187 | 38.0 | ||
Labour | Tessa Cornell | 566 | 18.1 | ||
Labour | Kathryn Brennan | 554 | 17.7 | ||
Labour | Ronald Phillips | 475 | 15.2 | ||
Rejected ballots | 12 | ||||
Turnout | 3,136 | 39.12 | |||
Conservative hold | Swing | ||||
Liberal Democrat hold | Swing | ||||
Liberal Democrat hold | Swing |
Party | Candidate | Votes | % | ± | |
---|---|---|---|---|---|
Conservative | Catherine Grey | 1,334 | 39.8 | ||
Conservative | Lily Bande | 1,326 | 39.6 | ||
Liberal Democrat | Kevin Burke* | 1,288 | 38.4 | ||
Conservative | Mukesh Rao | 1,227 | 36.6 | ||
Liberal Democrat | Wendy Mathys* | 1,206 | 36.0 | ||
Liberal Democrat | Simon Wales* | 1,190 | 35.5 | ||
Labour | Andy Cook | 806 | 24.0 | ||
Labour | Laura Mullaney | 713 | 21.3 | ||
Labour | Christopher Woolmer | 672 | 20.0 | ||
Green | Peter Hickson | 300 | 8.9 | ||
Rejected ballots | 3 | ||||
Turnout | 3,355 | 39.72 | |||
Conservative gain from Liberal Democrat | Swing | ||||
Liberal Democrat hold | Swing |
Party | Candidate | Votes | % | ± | |
---|---|---|---|---|---|
Liberal Democrat | Colin Stears* | 1,324 | 46.8 | ||
Liberal Democrat | Sam Weatherlake | 1,249 | 44.2 | ||
Liberal Democrat | Nali Patel* | 1,224 | 43.3 | ||
Conservative | Will Curley | 760 | 26.9 | ||
Conservative | Millie Shields | 747 | 26.4 | ||
Conservative | Sebastian Wopinski | 659 | 23.3 | ||
Labour | Sheila Berry | 533 | 18.9 | ||
Labour | Carlos De Sousa | 498 | 17.6 | ||
Labour | Paul McCarthy | 476 | 16.8 | ||
Green | Penelope Mouncey | 204 | 7.2 | ||
UKIP | John Bannon | 196 | 6.9 | ||
Green | Michael Boulton | 187 | 6.6 | ||
UKIP | Bill Main-Ian | 177 | 6.3 | ||
UKIP | Gino Marotta | 129 | 4.6 | ||
Green | Phillip Mouncey | 121 | 4.3 | ||
Rejected ballots | 2 | ||||
Turnout | 2,829 | 34.09 | |||
Liberal Democrat hold | Swing | ||||
Liberal Democrat hold | Swing |
Party | Candidate | Votes | % | ± | |
---|---|---|---|---|---|
Liberal Democrat | Sunita Gordon* | 1,637 | 50.2 | ||
Liberal Democrat | Marian James* | 1,587 | 48.6 | ||
Liberal Democrat | Joyce Melican* | 1,505 | 46.1 | ||
Conservative | Charlotte Leonard | 912 | 27.9 | ||
Conservative | Lynn Robertson | 888 | 27.2 | ||
Conservative | Christopher Wortley | 827 | 25.3 | ||
Labour | Michael McLoughlin | 594 | 18.2 | ||
Labour | Mary Towler | 526 | 16.1 | ||
Labour | David Towler | 516 | 15.8 | ||
Green | Verity Thomson | 300 | 9.2 | ||
Green | Mark Webb | 222 | 6.8 | ||
UKIP | Malcolm Horne | 119 | 3.6 | ||
UKIP | Angela North | 104 | 3.2 | ||
UKIP | Vivien Worsfold | 72 | 2.2 | ||
Rejected ballots | 10 | ||||
Turnout | 3,274 | 37.76 | |||
Liberal Democrat hold | Swing | ||||
Liberal Democrat hold | Swing |
Party | Candidate | Votes | % | ± | |
---|---|---|---|---|---|
Liberal Democrat | Steve Cook | 1,793 | 53.5 | ||
Liberal Democrat | Jayne McCoy* | 1,704 | 50.8 | ||
Liberal Democrat | Muhammad Sadiq* | 1,588 | 47.3 | ||
Conservative | Daryl Brisley | 1,233 | 36.8 | ||
Conservative | Hilary Wortley | 1,089 | 32.5 | ||
Conservative | Omoniyi Giwa | 978 | 29.2 | ||
Labour | David Murray | 506 | 15.1 | ||
Labour | Bobbie Lambert | 413 | 12.3 | ||
Green | Maeve Tomlinson | 404 | 12.0 | ||
Labour | Callum Roper | 373 | 11.1 | ||
Rejected ballots | 10 | ||||
Turnout | 3,364 | 41.45 | |||
Liberal Democrat hold | Swing | ||||
Liberal Democrat hold | Swing |
Party | Candidate | Votes | % | ± | |
---|---|---|---|---|---|
Liberal Democrat | Benjamin Andrew | 1,128 | 41.6 | ||
Liberal Democrat | Vincent Galligan | 1,057 | 39.0 | ||
Liberal Democrat | Hanna Zuchowska* | 950 | 35.0 | ||
Labour | David Grant | 883 | 32.6 | ||
Labour | Margaret Thomas | 826 | 30.5 | ||
Labour | Ahmad Wattoo | 723 | 26.7 | ||
Conservative | David Jeffreys | 475 | 17.5 | ||
Conservative | Ross Taylor | 461 | 17.0 | ||
Conservative | Julia Russell | 451 | 16.6 | ||
UKIP | Barry Greening | 245 | 9.0 | ||
Green | Peter Alfrey | 229 | 8.4 | ||
Green | Helen Heathfield | 206 | 7.6 | ||
UKIP | Mark Nicholson | 180 | 6.6 | ||
UKIP | Stewart Wood | 174 | 6.4 | ||
Green | Gina Mudge | 166 | 6.1 | ||
Rejected ballots | 10 | ||||
Turnout | 2,722 | 31.20 | |||
Liberal Democrat hold | Swing | ||||
Liberal Democrat hold | Swing |
Party | Candidate | Votes | % | ± | |
---|---|---|---|---|---|
Liberal Democrat | Jenny Batt | 1,759 | 47.6 | ||
Conservative | Tom Drummond | 1,539 | 41.7 | ||
Liberal Democrat | Drew Heffernan | 1,489 | 40.3 | ||
Liberal Democrat | Sam Martin | 1,461 | 39.6 | ||
Conservative | Bob Miah | 1,459 | 39.5 | ||
Conservative | Paul Newman | 1,421 | 38.5 | ||
Labour | Liz Martin | 714 | 19.3 | ||
Labour | John Evers | 711 | 19.3 | ||
Labour | Ann Morrison | 552 | 14.9 | ||
Rejected ballots | 14 | ||||
Turnout | 3,707 | 39.68 | |||
Liberal Democrat hold | Swing | ||||
Conservative gain from Liberal Democrat | Swing | ||||
Liberal Democrat hold | Swing |
Beddington is a suburban settlement in the London Borough of Sutton on the boundary with the London Borough of Croydon. Beddington is formed from a village of the same name which until early the 20th century still included land which became termed entirely as Wallington. The BedZED low energy housing estate is, in non-ecclesiastical terms, in the neighbouring locality of Hackbridge. The latter was in the 13th century shown on local maps as Hakebrug, and named after a bridge on the River Wandle. The locality has a landscaped wooded park at Beddington Park - also known as Carew Manor; and a nature reserve and sewage treatment works in the centre and to the north of its area respectively. The population of Beddington according to the 2011 census is 21,044.
Carshalton is a town in the London Borough of Sutton, England. Historically part of Surrey, it is located 9.5 miles (15.1 km) south-southwest of Charing Cross, situated in the valley of the River Wandle, one of the sources of which is Carshalton Ponds in the middle of the village.
Wallington is a town in the London Borough of Sutton, England, 10.3 miles (16.6 km) south south-west of Charing Cross. Before the Municipal Borough of Beddington and Wallington merged into the London Borough of Sutton, it was part of the county of Surrey. Wallington is a post town in the SM postcode area.
The London Borough of Sutton is a London borough in South West London, England and forms part of Outer London. It covers an area of 43 km2 (17 sq mi) and is the 80th largest local authority in England by population. It is one of the southernmost boroughs of London. It is south of the London Borough of Merton, west of the London Borough of Croydon and east of the Royal Borough of Kingston Upon Thames. The local authority is Sutton London Borough Council. Its principal town is the eponymous Sutton.
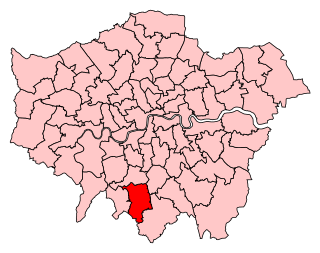
Carshalton and Wallington is a constituency represented in the House of Commons of the Parliament of the United Kingdom since 1997 by Tom Brake of the Liberal Democrats. It elects one Member of Parliament (MP) by the first past the post system of election.
The A232 is a road running east-west in two modern counties: across far south London and 3 miles into Surrey. It connects the A24 in Ewell with the A224 Orpington bypass.
Beddington and Wallington was, from 1915 to 1965, a local government district in north east Surrey, England. It formed part of the London suburbs, lying within the Metropolitan Police District and the London Passenger Transport Area. In 1965 it was abolished on the creation of Greater London.
Croydon and Sutton is a constituency represented in the London Assembly.
Carshalton was a parliamentary constituency centred on the Carshalton suburb of London, in what is now the London Borough of Sutton. It returned one Member of Parliament to the House of Commons of the Parliament of the United Kingdom.
Sutton London Borough Council in London, England is elected every four years.
Sutton London Borough Council is the local authority for the London Borough of Sutton in Greater London, England. It is a London borough council, one of 32 in the United Kingdom capital of London. Sutton is divided into 18 wards, each electing three councillors. Following the May 2014 council election, Sutton London Borough Council comprises 45 Liberal Democrat councillors and 9 Conservative Party councillors, an increase of the Liberal Democrat majority. The council was created by the London Government Act 1963 and replaced three local authorities: Beddington and Wallington Borough Council, Sutton and Cheam Borough Council and Carshalton Urban District Council.
The Croydon North by-election was a by-election for the Parliament of the United Kingdom's House of Commons constituency of Croydon North in the London Borough of Croydon. The by-election was caused by the death of its Member of Parliament Malcolm Wicks. It took place on Thursday, 29 November, the same day as by-elections in Middlesbrough and Rotherham. The by-election was won by Steve Reed of the Labour Party.
The 2014 Sutton Council election took place on 22 May 2014 to elect members of Sutton Council in England. This was on the same day as other local elections.
The 1964 Sutton Council election took place on 7 May 1964 to elect members of Sutton London Borough Council in London, England. The whole council was up for election and the Conservative party gained control of the council.
Paul Stuart Scully is a British Conservative Party politician who currently serves as Conservative Party's Vice Chairman for the London region, having replaced Stephen Hammond in December 2017 for rebelling against the government over the EU withdrawal bill. He was elected as the Member of Parliament (MP) for Sutton and Cheam in 2015, and held the seat in the 2017 general election.
The 2017 United Kingdom local elections were held on Thursday 4 May 2017. Local elections were held across Great Britain, with elections to 35 English local authorities and all councils in Scotland and Wales.
Council elections in England were held on Thursday 3 May 2018. Elections were held in all 32 London boroughs, 34 metropolitan boroughs, 67 district and borough councils and 17 unitary authorities. There were also direct elections for the mayoralties of Hackney, Lewisham, Newham, Tower Hamlets and Watford.
An election for Redbridge London Borough Council took place on 3 May 2018, the same day as for other London Boroughs. All 63 seats were up for election. The Labour Party retained control of the council with an increased majority, taking 81% of the seats.