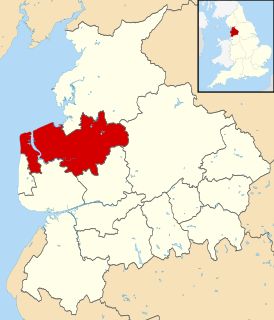
Elections to Wyre Borough Council were held on 5 May 2011, along with the United Kingdom Alternative Vote referendum, 2011. [1] All 55 councillors were elected from 26 wards in elections held every four years. [2] The Conservative Party stayed in overall control of the council. [3]
Wyre is a local government district with borough status in Lancashire, England. The population of the non-metropolitan district at the 2011 census was 107,749. The district borders the unitary authority of Blackpool as well as the districts of Lancaster, Ribble Valley, Fylde and Preston. The council is based in Poulton-le-Fylde.
The Conservative Party, officially the Conservative and Unionist Party, is a centre-right political party in the United Kingdom. Presently led by Theresa May, it has been the governing party since 2010. It presently has 314 Members of Parliament in the House of Commons, 249 members of the House of Lords, and 18 members of the European Parliament. It also has 31 Members of the Scottish Parliament, 12 members of the Welsh Assembly, eight members of the London Assembly and 9,008 local councillors. One of the major parties of UK politics, it has formed the government on 45 occasions, more than any other party.
The Local Government Boundary Commission for England reviewed the electoral wards of Wyre Borough Council in 2014 with the new electoral map to be elected for the first time at the Wyre Borough Council election, 2015.
The Local Government Boundary Commission for England (LGBCE) is a parliamentary body established by statute to conduct boundary, electoral and structural reviews of local government areas in England. The LGBCE is independent of government and political parties, and is directly accountable to the Speaker's Committee of the House of Commons.
Following the election, the composition of the council is now as follows:
Party | Seats | ± | |
---|---|---|---|
Conservative | 40 | –5 | |
Labour | 15 | +7 | |
Liberal Democrat | 0 | –1 | |
Independent | 0 | –1 |
Party | Seats | Gains | Losses | Net gain/loss | Seats % | Votes % | Votes | +/− | |
---|---|---|---|---|---|---|---|---|---|
Conservative | 40 | 1 | 6 | –5 | 72.73 | 60.23 | 45,140 | -3.62% | |
Labour | 15 | 7 | 0 | +7 | 27.27 | 35.13 | 26,331 | +6.78% | |
UKIP | 0 | 0 | 0 | 0 | 0 | 2.53 | 1,894 | +0.28% | |
Independent | 0 | 0 | 1 | –1 | 0 | 1.46 | 1,095 | +1.46% | |
Green | 0 | 0 | 0 | 0 | 0 | 0.65 | 485 | +0.65% | |
Liberal Democrat | 0 | 0 | 1 | –1 | 0 | 0 | 0 | -4.85% |
Party | Candidate | Votes | % | ± | |
---|---|---|---|---|---|
Labour | Terry Lees | 1,013 | 18.29 | +4.022 | |
Conservative | Don Macnaughton | 942 | 17.01 | -2.57 | |
Conservative | Julie Vanessa Newsham | 912 | 16.47 | –3.08 | |
Labour | Sean Hazlewood | 901 | 16.27 | +2.14 | |
Conservative | Christopher Robert McConnachie | 894 | 16.14 | -2.42 | |
Labour | Kevin Ronald Hogginson | 876 | 15.82 | +1.90 | |
Turnout | 5,538 | 40.2 | |||
Labour gain from Conservative | Swing | +6.59 | |||
Conservative hold | Swing | -4.57 | |||
Conservative hold | Swing | -4.77 |
Party | Candidate | Votes | % | ± | |
---|---|---|---|---|---|
Conservative | Peter Gibson | 761 | 40.39 | +3.64 | |
Conservative | David John Henderson | 758 | 40.23 | +1.88 | |
Labour | Richard Hobson | 365 | 19.37 | +6.02 | |
Turnout | 1,884 | 42.9 | –11.13 | ||
Conservative hold | Swing | -4.17 | |||
Conservative hold | Swing | -4.14 |
Party | Candidate | Votes | % | ± | |
---|---|---|---|---|---|
Conservative | Pete Murphy | Unopposed | N/A | N/A | |
Majority | N/A | N/A | N/A | ||
Turnout | N/A | N/A | N/A | ||
Conservative hold | Swing |
Party | Candidate | Votes | % | ± | |
---|---|---|---|---|---|
Conservative | Robert William Brooks | 444 | 70.48 | –5.24 | |
Labour | Faron Stuart Young | 186 | 29.52 | +5.24 | |
Majority | 258 | 40.95 | –10.66 | ||
Turnout | 630 | 48.3 | +1.29 | ||
Conservative hold | Swing | -10.48 |
Party | Candidate | Votes | % | ± | |
---|---|---|---|---|---|
Conservative | David Williams | 535 | 75.35 | +9.04 | |
UKIP | Simon Noble | 175 | 24.65 | N/A | |
Majority | 360 | 50.70 | +18.08 | ||
Turnout | 710 | ||||
Conservative hold | Swing |
Party | Candidate | Votes | % | ± | |
---|---|---|---|---|---|
Conservative | James Hargeaves | 914 | 31.94 | –3.50 | |
Conservative | May Gandhi | 905 | 31.62 | –2.67 | |
Labour | Andy Walker | 556 | 19.43 | +4.80 | |
Labour | Frank William Turner | 487 | 17.02 | +1.38 | |
Turnout | 2,862 | 46.6 | |||
Conservative hold | Swing | -7.29 | |||
Conservative hold | Swing | -5.06 |
Party | Candidate | Votes | % | ± | |
---|---|---|---|---|---|
Conservative | Dave Swift | Unopposed | N/A | N/A | |
Majority | N/A | N/A | N/A | ||
Turnout | N/A | N/A | N/A | ||
Conservative gain from Liberal Democrat | Swing | ||||
Party | Candidate | Votes | % | ± | |
---|---|---|---|---|---|
Conservative | Andrea Kay | 1,210 | 19.01 | -0.20 | |
Conservative | Rita Amos | 1,102 | 17.31 | +0.33 | |
Labour | Penny Martin | 1,077 | 16.92 | +1.05 | |
Conservative | Tony Morley | 1,068 | 16.78 | +0.35 | |
Labour | David Oxley | 978 | 15.36 | +0.57 | |
Labour | John Damien Traynor | 931 | 14.63 | +0.56 | |
Turnout | 6,366 | 48.7 | +13.6 | ||
Conservative hold | Swing | +0.31 | |||
Conservative hold | Swing | 0.49 | |||
Labour gain from Conservative | Swing | +0.70 | |||
Party | Candidate | Votes | % | ± | |
---|---|---|---|---|---|
Conservative | Dulcie Mary Atkins | 1,272 | 30.29 | +3.06 | |
Conservative | Alice Collinson | 1,223 | 29.12 | +4.56 | |
Conservative | Tom Balmain | 1,073 | 25.56 | +3.96 | |
Labour | Marilyn Levey | 632 | 15.05 | N/A | |
Turnout | 4,200 | 48.6 | –14.02 | ||
Conservative hold | Swing | +2.52 | |||
Conservative hold | Swing | +1.61 | |||
Conservative hold | Swing | +1.01 |
Party | Candidate | Votes | % | ± | |
---|---|---|---|---|---|
Conservative | Susan Catteral | 1,089 | 49.93 | N/A | |
Conservative | Susan Pimbley | 824 | 37.78 | N/A | |
Labour | Al Davies | 268 | 12.29 | N/A | |
Turnout | 2,181 | 48.6 | N/A | ||
Conservative hold | Swing | N/A | |||
Conservative hold | Swing | N/A |
Party | Candidate | Votes | % | ± | |
---|---|---|---|---|---|
Conservative | Julie Robinson | 1,055 | 42.29 | +1.85 | |
Conservative | Lynn Bowen | 966 | 38.72 | +2.74 | |
Labour | Andy Meredith | 474 | 19.00 | +6.11 | |
Turnout | 2,495 | 46.7 | |||
Conservative hold | Swing | -4.26 | |||
Conservative hold | Swing | -5.67 |
Party | Candidate | Votes | % | ± | |
---|---|---|---|---|---|
Conservative | Simon Bridge | 1,049 | 43.01 | +5.44 | |
Conservative | Graeme Cocker | 1,003 | 41.12 | +1.73 | |
Labour | Richard Thomas Anyon | 387 | 15.87 | +4.09 | |
Turnout | |||||
Conservative hold | Swing | +0.83 | |||
Conservative hold | Swing | -2.36 |
Party | Candidate | Votes | % | ± | |
---|---|---|---|---|---|
Conservative | Barry Birch | 880 | 38.33 | +1.08 | |
Conservative | Roger Berry | 876 | 38.15 | +1.81 | |
Labour | Chris Frost | 540 | 23.52 | +8.88 | |
Turnout | 2,296 | 49.8 | –19.78 | ||
Conservative hold | Swing | -7.80 | |||
Conservative hold | Swing | -9.94 |
Party | Candidate | Votes | % | ± | |
---|---|---|---|---|---|
Conservative | John Hodgkinson | 602 | 21.90 | +4.40 | |
Conservative | David John Walmsley | 563 | 20.48 | +2.29 | |
Labour | Bill Glasgow | 486 | 17.68 | +4.32 | |
Labour | Alan Morgan | 462 | 16.81 | +6.28 | |
UKIP | Roy Graham Hopwood | 384 | 13.97 | –2.91 | |
UKIP | Alan Southern | 252 | 9.17 | -5.64 | |
Turnout | 2,749 | 46.4 | |||
Conservative hold | Swing | +3.60 | |||
Conservative hold | Swing | +2.36 |
Party | Candidate | Votes | % | ± | |
---|---|---|---|---|---|
Labour | Ruth Duffy | 617 | 31.27 | +2.59 | |
Labour | Ian Duffy | 603 | 30.56 | +2.87 | |
Conservative | David Jones | 317 | 16.07 | -6.04 | |
Conservative | Kerry Jones | 259 | 13.13 | -8.39 | |
Independent | Bob Jones | 177 | 8.97 | N/A | |
Turnout | 1,973 | 31.6 | –2.62 | ||
Labour hold | Swing | +9.03 | |||
Labour hold | Swing | +7.92 |
Party | Candidate | Votes | % | ± | |
---|---|---|---|---|---|
Conservative | Ron Greenhough | 664 | 27.56 | –5.85 | |
Conservative | Ann Margaret Turner | 641 | 26.61 | –4.27 | |
Labour | June Jackson | 568 | 23.58 | +5.31 | |
Labour | Peter Geoffrey Smith | 536 | 22.25 | +4.81 | |
Turnout | 2,409 | 41 | +10.86 | ||
Conservative hold | Swing | -11.16 | |||
Conservative hold | Swing | -9.08 |
Party | Candidate | Votes | % | ± | |
---|---|---|---|---|---|
Labour | Julie Elizabeth Grunshaw | 694 | 30.29 | +5.07 | |
Labour | Christine Smith | 674 | 29.42 | +6.85 | |
Conservative | Margaret Bond | 503 | 21.96 | -5.96 | |
Conservative | James Robert McConnachie | 420 | 18.33 | -5.96 | |
Turnout | 2,291 | 40.5 | +12.41 | ||
Labour hold | Swing | +7.40 | |||
Labour gain from Conservative | Swing | +12.81 | |||
Party | Candidate | Votes | % | ± | |
---|---|---|---|---|---|
Labour | Clive Grunshaw | 919 | 25.42 | +5.20 | |
Labour | Lorraine Beavers | 893 | 24.70 | +4.51 | |
Labour | Ronald Shewan | 825 | 22.82 | +4.28 | |
Conservative | David Charles Shaw | 366 | 10.13 | -2.86 | |
Conservative | Ian McAllister Nicholson | 343 | 9.49 | -3.11 | |
Conservative | Alexander Tomlinson | 269 | 7.44 | -2.25 | |
Turnout | 3,615 | 34.6 | |||
Labour hold | Swing | +8.06 | |||
Labour hold | Swing | +7.62 | |||
Labour hold | Swing | +6.53 |
Party | Candidate | Votes | % | ± | |
---|---|---|---|---|---|
Conservative | Donald William Lawrenson | 523 | 63.39 | +5.12 | |
Green | Sue White | 173 | 20.97 | N/A | |
Labour | Darrell Stratford Jackson | 129 | 15.64 | N/A | |
Majority | 350 | 42.42 | +25.89 | ||
Turnout | 825 | 47 | +11.79 | ||
Conservative hold | Swing | +25.88 |
Party | Candidate | Votes | % | ± | |
---|---|---|---|---|---|
Conservative | Gordon McCain | 1,299 | 26.34 | –0.68 | |
Conservative | Vivien Taylor | 1,226 | 24.86 | –2.27 | |
Conservative | Paul Moon | 1,220 | 24.74 | –3.02 | |
Labour | Nic Fogg | 656 | 13.30 | +4.92 | |
UKIP | Christopher Steven Lamb | 530 | 10.75 | N/A | |
Turnout | 4,931 | 47.8 | |||
Conservative hold | Swing | -5.60 | |||
Conservative hold | Swing | -3.31 | |||
Conservative hold | Swing | -4.06 |
Party | Candidate | Votes | % | ± | |
---|---|---|---|---|---|
Labour | Terry Rogers | 841 | 16.23 | -1.93 | |
Labour | Ted Taylor | 801 | 15.45 | -0.75 | |
Labour | Rita Hewitt | 758 | 14.62 | -2.75 | |
Conservative | Marlene Colby | 698 | 13.47 | -3.90 | |
Conservative | Michelle Riley | 684 | 13.29 | -0.58 | |
Conservative | Keith Riley | 655 | 12.64 | -5.52 | |
UKIP | David Gerrard | 320 | 6.17 | -2.49 | |
UKIP | Jimmy Orange | 233 | 4.50 | N/A | |
Independent | Jack Harrison | 193 | 3.72 | N/A | |
Turnout | 5,183 | 40.7 | |||
Labour hold | Swing | -1.51 | |||
Labour hold | Swing | -0.17 | |||
Labour hold | Swing | -1.52 |
Party | Candidate | Votes | % | ± | |
---|---|---|---|---|---|
Conservative | Julia Anderson | 1,445 | 26.58 | -2.09 | |
Conservative | Ian Perkin | 1,336 | 24.58 | -2.54 | |
Conservative | Ramesh Gandhi | 1,311 | 24.12 | -2.81 | |
Labour | Eddie Rawlings | 679 | 12.49 | +3.60 | |
Labour | Jonjo O'Connell | 665 | 12.23 | +3.85 | |
Turnout | 5,436 | 45.5 | |||
Conservative hold | Swing | -5.69 | |||
Conservative hold | Swing | -6.39 | |||
Conservative hold | Swing | -6.66 |
Party | Candidate | Votes | % | ± | |
---|---|---|---|---|---|
Conservative | David Bannister | 928 | 35.29 | -8.03 | |
Conservative | Lesley McKay | 902 | 34.30 | -6.16 | |
Labour | Liam Bromley | 488 | 18.56 | +2.34 | |
Green | Jake Welsh | 312 | 11.86 | N/A | |
Turnout | 2,630 | 46.8 | |||
Conservative hold | Swing | -10.37 | |||
Conservative hold | Swing | -1.80 |
Party | Candidate | Votes | % | ± | |
---|---|---|---|---|---|
Conservative | Patsy Anne Ormrod | 1,379 | 26.42 | -0.79 | |
Conservative | Michael John Vincent | 1,239 | 23.74 | +0.28 | |
Conservative | Alan Thomas Vincent | 1,223 | 23.43 | +0.27 | |
Labour | Brian Michael Stephenson | 713 | 13.66 | +4.11 | |
Labour | Evelyn Stephenson | 665 | 12.74 | +3.23 | |
Turnout | 5,219 | 44.7 | |||
Conservative hold | Swing | -4.90 | |||
Conservative hold | Swing | -2.95 | |||
Conservative hold | Swing | -5.36 |
Party | Candidate | Votes | % | ± | |
---|---|---|---|---|---|
Labour | Marge Anderton | 920 | 17.56 | +0.64 | |
Labour | Paul Treece-Birch | 911 | 17.39 | +2.73 | |
Labour | Emma Victoria Anderton | 896 | 17.10 | +3.78 | |
Conservative | Stan Leadbetter | 714 | 13.63 | -4.60 | |
Conservative | Mike Sanderson | 607 | 11.59 | -8.17 | |
Conservative | Bob Long | 466 | 8.90 | -8.20 | |
Independent | Mark Hamer | 389 | 7.43 | N/A | |
Independent | Trisha Hogg | 175 | 3.34 | N/A | |
Independent | Belinda Ann Armstrong | 161 | 3.07 | N/A | |
Turnout | 5,239 | ||||
Labour gain from Conservative | Swing | +8.81 | |||
Labour gain from Conservative | Swing | +7.33 | |||
Labour gain from Conservative | Swing | +11.98 | |||
Party | Candidate | Votes | % | ± | |
---|---|---|---|---|---|
Conservative | Val Wilson | 592 | 69.40 | -3.56 | |
Labour | Ben Whittingham | 261 | 30.60 | +3.56 | |
Majority | 331 | 38.80 | -7.12 | ||
Turnout | 853 | ||||
Conservative hold | Swing | -7.12 |
Tewkesbury Borough Council is the local authority for Tewkesbury Borough. Tewkesbury Borough is located in North Gloucestershire in the South West of England region. The Council itself is based in the Council Offices in Tewkesbury proper, but the borough also comprises Ashchurch, Bishop's Cleeve, Brockworth, Churchdown and Winchcombe and a number of other settlements. It is administratively distinct from Tewkesbury Town Council, which serves the smaller parish of Tewkesbury only.
Guildford Council in Surrey, England is elected every four years.
Elections to Wyre Borough Council in Lancashire, England are held every four years. Since the last boundary changes in 2003, 55 councillors have been elected from 26 wards.
Ashford Borough Council in Kent, England is elected every four years. Since the last boundary changes in 2003, 43 councillors have been elected from 35 wards.
One third of Basildon Borough Council in Essex, England is elected each year, followed by one year without election. Since the last boundary changes in 2002, 42 councillors have been elected from 16 wards.
Broxtowe Borough Council in Nottinghamshire, England is elected every four years. The Conservative party held overall control of the council from its foundation in 1973 until 1995 when the Labour party took control. Boundary changes took place for the 2003 election reducing the number of seats by five. The election saw Labour lose overall control of the council. Since 2003 the council has been under no overall control with Labour and the Liberal Democrats sharing power.
Dartford Borough Council is elected every four years.
One third of Burnley Borough Council in Lancashire, England is elected each year, followed by one year without election. Since the last boundary changes in 2002, 45 councillors have been elected from 15 wards.
Havering London Borough Council is the local authority for the London Borough of Havering in Greater London, England. It is a London borough council, one of 32 in the United Kingdom capital of London. Havering is divided into 18 wards, each electing three councillors. Since May 2018, Havering London Borough Council has been in no overall control. It comprises 25 Conservative Party members, 23 Havering Residents Association members, 5 Labour Party members and 1 Independent member. The council was created by the London Government Act 1963 and replaced two local authorities: Hornchurch Urban District Council and Romford Borough Council.
Milton Keynes is a unitary authority in Buckinghamshire, England. Until 1 April 1997 it was a non-metropolitan district.
Elections to Wyre Borough Council were held on 3 May 2007. All 55 councillors were elected from 26 wards in elections held every four years. The Conservative Party kept hold overall control of the council.
Elections to Wyre Borough Council were held on 5 May 2003. All 55 councillors were elected from 26 wards in elections held every four years. The Conservative Party kept hold overall control of the council. For this election boundary changes had taken place which resulted in reducing the number of seats by one.
The Broxbourne Council election, 2012 was held on 3 May 2012 to elect council members of the Broxbourne Borough Council, the local government authority of the borough of Broxbourne, Hertfordshire, England.
Torbay Council is the local authority of Torbay in Devon, England. It is a unitary authority, having the powers of a non-metropolitan county and district council combined. It provides a full range of local government services including Council Tax billing, libraries, social services, processing planning applications, waste collection and disposal, and it is a local education authority. The council appoints members to Devon and Somerset Fire and Rescue Authority and the Devon and Cornwall Police and Crime Panel. Torbay is divided into 15 wards, electing 36 councillors. The whole council is elected every four years with the last election taking place on 7 May 2015 and the next election scheduled for 2019. The council was created by the Local Government Act 1972 and replaced the Torbay Borough Council of the County Borough of Torbay. Since 1974 Torbay has held borough status which entitles the council to be known as Torbay Borough Council, although it has not used this name since becoming a unitary authority. The council is unusual in that its executive function is controlled by a directly elected mayor of Torbay, currently Gordon Oliver.
Havering Residents Association (HRA) is a group of residents' associations and registered political party in London, England. It is active in the London Borough of Havering and forms a 17-councillor group on Havering London Borough Council. At the 2014 London borough council elections they were the second largest party on Havering Council, largest elected residents group in London, and the fourth largest political party represented on all London borough councils. Not all residents groups in Havering are affiliated to the HRA, usually indicating this by standing as 'independent resident' candidates. In 2014 eight members of the Havering Residents Association group split off to form the East Havering Residents Group.
Local elections are to be held for Wyre Borough Council on 7 May 2015, the same day as the United Kingdom general election, 2015 and other United Kingdom local elections, 2015. Local elections are held every four years with all councillors up for election in multi-member electoral wards.
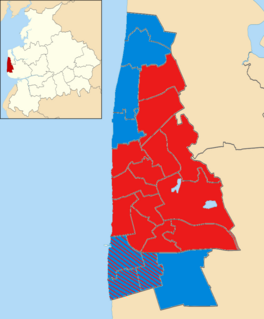
The 2015 Blackpool Borough Council election took place on 7 May 2015 to elect members of Blackpool Borough Council in England. All 21 wards of 2 seats each on the council were contested with newly elected members next due to serve a four-year term and next contest their seats in 2019. The council is made up oThis election took place on the same day as other local elections as well as the 2015 UK General Election.
The 2015 Middlesbrough Borough Council election took place on 7 May 2015 to elect members of Middlesbrough Borough Council in England. It took place on the same day as the election for the Mayor of Middlesbrough, as well as the UK general election, and other local elections across England. Since the 2011 election, there have been boundary reviews, which resulted in two fewer seats on the council, many old wards being discontinued and new wards being formed.
Elections to elect all members (councillors) of Thanet District Council were held on 7 May 2015, as part of the United Kingdom local elections, 2015 taking place simultaneously with the 2015 General Election. Local UK Independence Party candidates won the council, becoming the governing group, the first time UKIP had won control of any type of local government unit above the level of a civil parish council, whether London Borough, Metropolitan Borough, Unitary Authority, Non-Metropolitan Borough or a District Council. The District has as its main towns the beach resort towns of Ramsgate, Margate and Broadstairs.
Elections to elect all members (councillors) of Thanet District Council were held on 5 May 2011, as part of the United Kingdom local elections, 2011 taking place simultaneously with the Alternative Vote Referendum. No political party won an overall majority of seats, meaning that the council went into 'No Overall Control' status for the first time since 1991. The Conservative Party ran a minority administration until December that year, when a Conservative councillor defected to the Independents group, enabling The Labour Party to run a minority administration until 2015. The District has as its main towns the beach resort towns of Ramsgate, Margate and Broadstairs.