This article includes a list of general references, but it remains largely unverified because it lacks sufficient corresponding inline citations . (May 2021) (Learn how and when to remove this template message) |
| |||||||||||||||||||||
All 59 seats to Epping Forest District Council 30 seats needed for a majority | |||||||||||||||||||||
---|---|---|---|---|---|---|---|---|---|---|---|---|---|---|---|---|---|---|---|---|---|
| |||||||||||||||||||||
Council composition following the election | |||||||||||||||||||||
|
Elections to Epping Forest Council were held on 10 May 1973. This was the first election to the Epping Forest Council. The entire council was up for election and the council was won under Conservative control.
Party | Candidate | Votes | % | ±% | |
---|---|---|---|---|---|
Conservative | I. Beattie | 1,810 | 57.2 | ||
Conservative | R. Garner | 1,806 | |||
Conservative | C. Perry | 1,801 | |||
Conservative | N. Croucher | 1,786 | |||
Conservative | V. Milner | 1,770 | |||
Conservative | E. Perry | 1,764 | |||
Conservative | L. Welch | 1,744 | |||
Liberal | R. Eveling | 690 | 21.8 | ||
Labour | Ms. B. O'Brien | 663 | 21.0 | ||
Labour | Ms. F. Underhill | 650 | |||
Liberal | H. King | 643 | |||
Labour | Ms. P. Blagden | 643 | |||
Labour | M. Fox | 637 | |||
Labour | J. Fryer | 615 | |||
Labour | Ms. A. Fowl | 611 | |||
Labour | D. Whiteford | 592 | |||
Majority | 1,120 | 35.4 | |||
Turnout | 34.8 | ||||
Conservative win (new seat) | |||||
Conservative win (new seat) |
Party | Candidate | Votes | % | ±% | |
---|---|---|---|---|---|
Conservative | Ms. S. Gordon | 1,571 | 84.4 | ||
Conservative | W. Reynolds | 1,561 | |||
Conservative | C. Davie | 1,558 | |||
Conservative | N. Risdon | 1,553 | |||
Conservative | S. Barnett | 1,541 | |||
Conservative | B. Gunby | 1,523 | |||
Labour | Ms. G.Hilton | 291 | 15.6 | ||
Labour | J. Turner | 269 | |||
Labour | Ms. E. O'Donoghue | 261 | |||
Labour | Ms. P. Whiteford | 248 | |||
Majority | 1,280 | 68.7 | |||
Turnout | 20.7 | ||||
Conservative win (new seat) | |||||
Conservative win (new seat) |
Party | Candidate | Votes | % | ±% | |
---|---|---|---|---|---|
Conservative | T. Butler | 328 | 72.1 | ||
Labour | R. Gross | 127 | 27.9 | ||
Majority | 201 | 44.2 | |||
Turnout | 455 | 38.9 | |||
Conservative win (new seat) |
Party | Candidate | Votes | % | ±% | |
---|---|---|---|---|---|
Conservative | Ms. A. Miller | 1,703 | 56.5 | ||
Conservative | F. Limer | 1,687 | |||
Conservative | R. Cooper | 1,647 | |||
Conservative | K. Rothwell | 1,646 | |||
Conservative | H. Mead | 1,642 | |||
Conservative | M. Aldworth | 1,629 | |||
Labour | H. Cliffe | 1,309 | 43.5 | ||
Labour | C. Long | 1,256 | |||
Labour | Ms. A. Miles | 1,254 | |||
Labour | W. Garrett | 1,250 | |||
Labour | P. Rodwell | 1,233 | |||
Labour | D. Macaskill | 1,198 | |||
Majority | 394 | 13.1 | |||
Turnout | 35.9 | ||||
Conservative win (new seat) | |||||
Conservative win (new seat) |
Party | Candidate | Votes | % | ±% | |
---|---|---|---|---|---|
Conservative | G. Padfield | N/A | N/A | ||
Majority | N/A | N/A | |||
Turnout | N/A | N/A | |||
Conservative win (new seat) |
Party | Candidate | Votes | % | ±% | |
---|---|---|---|---|---|
Conservative | A. Sutherland | 396 | 63.5 | ||
Labour | C. Windle | 228 | 36.5 | ||
Majority | 168 | 26.9 | |||
Turnout | 624 | 38.1 | |||
Conservative win (new seat) |
Party | Candidate | Votes | % | ±% | |
---|---|---|---|---|---|
Conservative | B. Greenhill | 265 | 66.9 | ||
Labour | V. Bardell | 131 | 33.1 | ||
Majority | 134 | 33.8 | |||
Turnout | 396 | 36.9 | |||
Conservative win (new seat) |
Party | Candidate | Votes | % | ±% | |
---|---|---|---|---|---|
Conservative | Ms. E. Tuck | 559 | 76.4 | ||
Labour | S. Riley | 173 | 23.6 | ||
Majority | 386 | 52.7 | |||
Turnout | 732 | 40.1 | |||
Conservative win (new seat) |
Party | Candidate | Votes | % | ±% | |
---|---|---|---|---|---|
Conservative | D. Morton | N/A | N/A | ||
Majority | N/A | N/A | |||
Turnout | N/A | N/A | |||
Conservative win (new seat) |
Party | Candidate | Votes | % | ±% | |
---|---|---|---|---|---|
Conservative | R. Amanet | 612 | 50.6 | ||
Independent | Ms. A Wendrop | 597 | 49.4 | ||
Majority | 15 | 1.2 | |||
Turnout | 1,209 | 57.3 | |||
Conservative win (new seat) |
Party | Candidate | Votes | % | ±% | |
---|---|---|---|---|---|
Labour | Ms. J. Davis | 1,898 | 56.3 | ||
Labour | Ms. L. Fox | 1,862 | |||
Labour | B. Mooney | 1,858 | |||
Labour | A. Hilton | 1,854 | |||
Labour | S. Palfreman | 1,830 | |||
Labour | Ms. B. Whitlock | 1,800 | |||
Labour | H. Worby | 1,799 | |||
Labour | Ms. E Chapman | 1,760 | |||
Conservative | C. Mackay | 1,476 | 43.7 | ||
Conservative | Ms. Valerie Metcalfe | 1,441 | |||
Conservative | M. McGreal | 1,437 | |||
Conservative | Ms. V. O'Malley | 1,424 | |||
Conservative | Ms. D. Sanders | 1,402 | |||
Conservative | L. Whittome | 1,392 | |||
Conservative | Ms. J. Newton | 1,384 | |||
Conservative | R. Pocock | 1,381 | |||
Majority | 422 | 12.2 | |||
Turnout | 28.8 | ||||
Labour win (new seat) | |||||
Labour win (new seat) |
Party | Candidate | Votes | % | ±% | |
---|---|---|---|---|---|
Conservative | G. Claridge | 2,149 | 56.1 | ||
Conservative | Ms. L. Scott | 2,149 | |||
Conservative | A. Swallow | 2,148 | |||
Conservative | Ms. M. Spurge | 2,139 | |||
Conservative | D. James | 2,127 | |||
Conservative | D. Crilley | 2,116 | |||
Conservative | J. Martin | 2,109 | |||
Conservative | R. O'Malley | 2,107 | |||
Labour | Ms. M. French | 1,702 | 43.9 | ||
Labour | W. Archer | 1,695 | |||
Labour | J. Blagden | 1,672 | |||
Labour | D. Berry | 1,656 | |||
Labour | G. Castleman | 1,649 | |||
Labour | K. McKenzie | 1,622 | |||
Labour | D. Sherman | 1,619 | |||
Labour | G. Castleman | 1,611 | |||
Majority | 474 | 12.2 | |||
Turnout | 33.1 | ||||
Conservative win (new seat) | |||||
Conservative win (new seat) |
Party | Candidate | Votes | % | ±% | |
---|---|---|---|---|---|
Conservative | P. Gould | N/A | N/A | ||
Majority | N/A | N/A | |||
Turnout | N/A | N/A | |||
Conservative win (new seat) |
Party | Candidate | Votes | % | ±% | |
---|---|---|---|---|---|
Conservative | M. Welch | 894 | 57.6 | ||
Conservative | F. Radford | 793 | |||
Labour | M. Skudder | 659 | 42.4 | ||
Labour | J. Mackie | 642 | |||
Majority | 235 | 15.2 | |||
Turnout | 48.4 | ||||
Conservative win (new seat) | |||||
Conservative win (new seat) |
Party | Candidate | Votes | % | ±% | |
---|---|---|---|---|---|
Independent | Harry Waterman | 692 | 72.0 | ||
Labour | R. Bednall | 269 | 28.0 | ||
Majority | 423 | 44.0 | |||
Turnout | 961 | 39.3 | |||
Independent win (new seat) |
Party | Candidate | Votes | % | ±% | |
---|---|---|---|---|---|
Conservative | J. Pledge | N/A | N/A | ||
Majority | N/A | N/A | |||
Turnout | N/A | N/A | |||
Conservative win (new seat) |
Party | Candidate | Votes | % | ±% | |
---|---|---|---|---|---|
Labour | C. Hewins | 398 | 63.9 | ||
Conservative | R. Chidley | 225 | 36.1 | ||
Majority | 173 | 27.8 | |||
Turnout | 623 | 35.4 | |||
Labour win (new seat) |
Party | Candidate | Votes | % | ±% | |
---|---|---|---|---|---|
Independent | T. East | N/A | N/A | ||
Majority | N/A | N/A | |||
Turnout | N/A | N/A | |||
Independent win (new seat) |
Party | Candidate | Votes | % | ±% | |
---|---|---|---|---|---|
Conservative | Ms. W. Page | 546 | 70.5 | ||
Labour | J. Bowers | 228 | 29.5 | ||
Majority | 318 | 41.1 | |||
Turnout | 774 | 41.4 | |||
Conservative win (new seat) |
Party | Candidate | Votes | % | ±% | |
---|---|---|---|---|---|
Independent | J. Atkinson | 434 | 56.5 | ||
Labour | S. Langton | 334 | 43.5 | ||
Majority | 100 | 13.0 | |||
Turnout | 768 | 54.1 | |||
Independent win (new seat) |
Party | Candidate | Votes | % | ±% | |
---|---|---|---|---|---|
Conservative | Ms. J. Price | 464 | 56.2 | ||
Labour | R. Barnes | 361 | 43.8 | ||
Majority | 103 | 12.5 | |||
Turnout | 825 | 59.3 | |||
Conservative win (new seat) |
Party | Candidate | Votes | % | ±% | |
---|---|---|---|---|---|
Conservative | R. Daniels | 1,086 | 80.9 | ||
Conservative | Ms. J. Wainwright | 1,051 | |||
Labour | Ms. S. Gymer | 256 | 19.1 | ||
Labour | Ms. F. Davy | 191 | |||
Majority | 830 | 61.8 | |||
Turnout | 43.2 | ||||
Conservative win (new seat) | |||||
Conservative win (new seat) |
Party | Candidate | Votes | % | ±% | |
---|---|---|---|---|---|
Conservative | J. Patching | 1,162 | 51.1 | ||
Conservative | H. Taylor | 1,135 | |||
Conservative | R. Knibb | 1,127 | |||
Labour | Ms. J. Hewins | 1,111 | 48.9 | ||
Conservative | H. Smith | 1,110 | |||
Labour | A. Matthews | 1,087 | |||
Conservative | W. Barbour | 1,074 | |||
Labour | N. Paul | 1,040 | |||
Labour | C. Sumner | 1,013 | |||
Labour | Ms. J. Taylor | 1,009 | |||
Majority | 51 | 2.2 | |||
Turnout | 33.4 | ||||
Conservative win (new seat) | |||||
Labour win (new seat) | |||||
Conservative win (new seat) |
Epping Forest is a local government district in Essex, England. Situated in the west of the county, bordering northeastern Greater London, it is named after, and contains a large part of, Epping Forest.
The district of Epping Forest is in the county of Essex in England. It was created on 1 April 1974, following the merger of Epping Urban District, Chigwell Urban District, Waltham Holy Cross Urban District, and part of Epping and Ongar Rural District.
Elections to Epping Forest Council were held on 7 May 1998. One third of the council was up for election and the council stayed under no overall control. Overall turnout was 29.4%.
Elections to Epping Forest Council were held on 6 May 1999. One third of the council was up for election and the council stayed under no overall control. Overall turnout was 29%. This was the last time the Epping Residents Association had representation on the district council.
Elections to Epping Forest Council were held on 4 May 2000. One third of the council was up for election and the council stayed under no overall control. Overall turnout was 30.4%. This was the last election with some of the current boundaries.
Elections to Epping Forest Council were held on 2 May 2002. The whole council was up for election with boundary changes since the last election in 2000 reducing the number of seats by 1. The council stayed under no overall control.
Elections to Epping Forest Council were held on 1 May 2003. One third of the council was up for election and the council stayed under no overall control. This election saw the best performance in terms of seats and vote share for the Liberal Democrats.
Elections to Epping Forest Council were held on 10 June 2004. One third of the council was up for election and the council stayed under no overall control. Overall turnout was 37.6%.
Elections to Epping Forest Council were held on 4 May 2006. One third of the council was up for election and the council stayed under no overall control.
Elections to Epping Forest Council were held on 3 May 2007. One third of the council was up for election and the Conservative party regained overall control of the council, thanks initially to a by-election in Grange Hill in December 2006, and then following gains at this election.
The 2012 Epping Forest Council election took place on 3 May 2012 to elect members of Epping Forest Council in England. This was on same day as other 2012 United Kingdom local elections.
The 2014 Epping Forest District Council election took place on 22 May 2014 to elect members of Epping Forest District Council in England. This was on the same day as other local elections and the European Parliament elections.
The 2015 Epping Forest District Council election took place on 7 May 2015 to elect members of Epping Forest District Council in England. This was on the same day as other local elections.
The 2016 Epping Forest District Council election took place on 5 May 2016 to elect members of Epping Forest District Council in England. This was on the same day as other local elections.
The 2018 Epping Forest District Council election took place on 3 May 2018 to elect members of Epping Forest District Council in England. This was on the same day as other local elections.
The 2011 Epping Forest District Council election was held on 5 May 2011 to elect members of Epping Forest Council in England as part of the wider local elections in England and Northern Ireland.
The 2019 Epping Forest District Council election will take place on 2 May 2019 to elect members of Epping Forest District Council in England. This was on the same day as other local elections.
The 2010 Epping Forest District Council election took place on 6 May 2010 to elect members of Epping Forest District Council in England. This was on the same day as other 2010 United Kingdom general election.
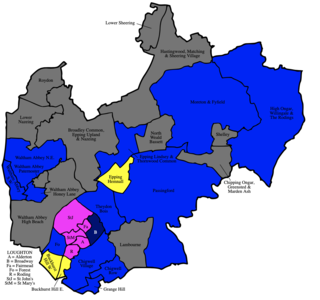
Elections to Epping Forest Council were held on 1 May 2008. One third of the council was up for election and the council remained in Conservative control.
The 2021 Epping Forest District Council election will take place on 6 May 2021 to elect members of Epping Forest District Council in England. This was on the same day as other local elections.