The 1983 Italian general election was held in Italy on 26 June 1983.[1] The Pentapartito formula, the governative alliance between five centrist parties, caused unexpected problems to Christian Democracy. The alliance was fixed and universal, extended both to the national government and to the local administrations. Considering that the election result did no longer depend on the strength of the DC, but the strength of the entire Pentapartito, centrist electors began to look at the Christian Democratic vote as not necessary to prevent a Communist success. Moreover, voting for one of the four minor parties of the alliance was seen as a form of moderate protest against the government without giving advantages to the PCI. Other minor effects of this election were a reduction of the referendarian Radical Party and the appearance of some regional forces.
The pure party-list proportional representation had traditionally become the electoral system for the Chamber of Deputies. Italian provinces were united in 32 constituencies, each electing a group of candidates. At constituency level, seats were divided between open lists using the largest remainder method with Imperiali quota. Remaining votes and seats were transferred at national level, where they were divided using the Hare quota, and automatically distributed to best losers into the local lists.
For the Senate, 237 single-seat constituencies were established, even if the assembly had risen to 315 members. The candidates needed a landslide victory of two thirds of votes to be elected, a goal which could be reached only by the German minorities in South Tirol. All remained votes and seats were grouped in party lists and regional constituencies, where a D'Hondt method was used: inside the lists, candidates with the best percentages were elected.
Historical background
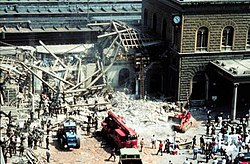
Rescue teams making their way through the rubble after the explosion in Bologna.
On 2 August 1980, a bomb killed 85 people and wounded more than 200 in Bologna. Known as the Bologna massacre, the blast destroyed a large portion of the city's railway station. This was found to be a fascist bombing, mainly organized by the NAR, who had ties with the Roman criminal organization Banda della Magliana. In the following days the central square of Bologna, Piazza Maggiore, hosted large-scale demonstrations of indignation and protest among the population, in which were not spared harsh criticism and protests addressed to government representatives, who attended the funerals of the victims celebrated in the San Petronio Basilica on 6 August.
In 1981 at a meeting of the Congress of the Italian Socialist Party (PSI), was officially launched a centrist political alliance called Pentapartito, when the Christian DemocratArnaldo Forlani and Socialist Secretary Bettino Craxi signed an agreement with the "blessing" of Giulio Andreotti. Because the agreement was signed in a trailer, it was called the "pact of the camper." The pact was also called "CAF" for the initials of the signers, Craxi-Andreotti-Forlani. With this agreement, the DC party recognized the equal dignity of the so-called "secular parties" of the majority (i.e., the Socialists, Social Democrats, Liberals and Republicans) and also guaranteed an alternation of government (in fact, Giovanni Spadolini of the PRI and Bettino Craxi of the PSI became the first non-Christian Democrats to hold the Presidency of the Council). With the birth of the Pentapartito, the possibility of the growth of the majority toward the Italian Communist Party (PCI) was finally dismissed. The Christian Democrats remained the leaders of the coalition, and managed several times to prevent representatives of the secular parties from becoming President of the Council.
The DC respected the pact of an alternance of leadership between the parties of the alliance and accepted the Socialist secretary, Bettino Craxi, as the new Prime Minister of Italy. The Christian Democrats hoped that their minor responsibility could drive away some popular discontent from their party. The Italian Socialist Party so arrived to the highest office of the government for the first time in history. Differently from the DC, which had an oligarchic structure, the PSI was strongly ruled by its secretary, so the Craxi's premiership resulted the longest one without any political crisis in post-war Italy, despite some international tensions with the United States about the Palestine Liberation Organization. Craxi formed a renewed government in 1986, but could not survive in 1987 to a dispute with DC's secretary Ciriaco De Mita, who was searching and effectively obtained an early national election, ruled by an electoral Christian Democratic government with old Amintore Fanfani as PM.
This page is based on this Wikipedia article Text is available under the CC BY-SA 4.0 license; additional terms may apply. Images, videos and audio are available under their respective licenses.