Detection limit

Last updated

The limit of detection (LOD or LoD) is the lowest signal, or the lowest corresponding quantity to be determined (or extracted) from the signal, that can be observed with a sufficient degree of confidence or statistical significance. However, the exact threshold (level of decision) used to decide when a signal significantly emerges above the continuously fluctuating background noise remains arbitrary and is a matter of policy and often of debate among scientists, statisticians and regulators depending on the stakes in different fields.

Contents

Significance in analytical chemistry

In analytical chemistry, the detection limit, lower limit of detection, also termed LOD for limit of detection or analytical sensitivity (not to be confused with statistical sensitivity), is the lowest quantity of a substance that can be distinguished from the absence of that substance (a blank value ) with a stated confidence level (generally 99%). [1] [2] [3] The detection limit is estimated from the mean of the blank, the standard deviation of the blank, the slope (analytical sensitivity) of the calibration plot and a defined confidence factor (e.g. 3.2 being the most accepted value for this arbitrary value). [4] Another consideration that affects the detection limit is the adequacy and the accuracy of the model used to predict concentration from the raw analytical signal. [5]

As a typical example, from a calibration plot following a linear equation taken here as the simplest possible model:

where, corresponds to the signal measured (e.g. voltage, luminescence, energy, etc.), "b" the value in which the straight line cuts the ordinates axis, "a" the sensitivity of the system (i.e., the slope of the line, or the function relating the measured signal to the quantity to be determined) and "x" the value of the quantity (e.g. temperature, concentration, pH, etc.) to be determined from the signal , [6] the LOD for "x" is calculated as the "x" value in which equals to the average value of blanks "y" plus "t" times its standard deviation "s" (or, if zero, the standard deviation corresponding to the lowest value measured) where "t" is the chosen confidence value (e.g. for a confidence of 95% it can be considered t = 3.2, determined from the limit of blank). [4]

Thus, in this didactic example:

There are a number of concepts derived from the detection limit that are commonly used. These include the instrument detection limit (IDL), the method detection limit (MDL), the practical quantitation limit (PQL), and the limit of quantitation (LOQ). Even when the same terminology is used, there can be differences in the LOD according to nuances of what definition is used and what type of noise contributes to the measurement and calibration. [7]

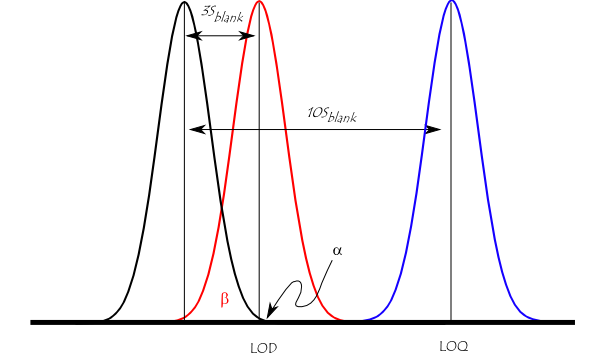
The figure below illustrates the relationship between the blank, the limit of detection (LOD), and the limit of quantitation (LOQ) by showing the probability density function for normally distributed measurements at the blank, at the LOD defined as 3 × standard deviation of the blank, and at the LOQ defined as 10 × standard deviation of the blank. (The identical spread along Abscissa of these two functions is problematic.) For a signal at the LOD, the alpha error (probability of false positive) is small (1%). However, the beta error (probability of a false negative) is 50% for a sample that has a concentration at the LOD (red line). This means a sample could contain an impurity at the LOD, but there is a 50% chance that a measurement would give a result less than the LOD. At the LOQ (blue line), there is minimal chance of a false negative.

LOD.png
Illustration of the concept of detection limit and quantitation limit by showing the theoretical normal distributions associated with blank, detection limit (LOD), and quantitation limit (LOQ) level samples.

Instrument detection limit

Most analytical instruments produce a signal even when a blank (matrix without analyte) is analyzed. This signal is referred to as the noise level. The instrument detection limit (IDL) is the analyte concentration that is required to produce a signal greater than three times the standard deviation of the noise level. This may be practically measured by analyzing 8 or more standards at the estimated IDL then calculating the standard deviation from the measured concentrations of those standards.

The detection limit (according to IUPAC) is the smallest concentration, or the smallest absolute amount, of analyte that has a signal statistically significantly larger than the signal arising from the repeated measurements of a reagent blank.

Mathematically, the analyte's signal at the detection limit () is given by:

where, is the mean value of the signal for a reagent blank measured multiple times, and is the known standard deviation for the reagent blank's signal.

Other approaches for defining the detection limit have also been developed. In atomic absorption spectrometry usually the detection limit is determined for a certain element by analyzing a diluted solution of this element and recording the corresponding absorbance at a given wavelength. The measurement is repeated 10 times. The 3σ of the recorded absorbance signal can be considered as the detection limit for the specific element under the experimental conditions: selected wavelength, type of flame or graphite oven, chemical matrix, presence of interfering substances, instrument... .

Method detection limit

Often there is more to the analytical method than just performing a reaction or submitting the analyte to direct analysis. Many analytical methods developed in the laboratory, especially these involving the use of a delicate scientific instrument, require a sample preparation, or a pretreatment of the samples prior to being analysed. For example, it might be necessary to heat a sample that is to be analyzed for a particular metal with the addition of acid first (digestion process). The sample may also be diluted or concentrated prior to analysis by means of a given instrument. Additional steps in an analysis method add additional opportunities for errors. Since detection limits are defined in terms of errors, this will naturally increase the measured detection limit. This "global" detection limit (including all the steps of the analysis method) is called the method detection limit (MDL). The practical way for determining the MDL is to analyze seven samples of concentration near the expected limit of detection. The standard deviation is then determined. The one-sided Student's t-distribution is determined and multiplied versus the determined standard deviation. For seven samples (with six degrees of freedom) the t value for a 99% confidence level is 3.14. Rather than performing the complete analysis of seven identical samples, if the Instrument Detection Limit is known, the MDL may be estimated by multiplying the Instrument Detection Limit, or Lower Level of Detection, by the dilution prior to analyzing the sample solution with the instrument. This estimation, however, ignores any uncertainty that arises from performing the sample preparation and will therefore probably underestimate the true MDL.

Limit of each model

The issue of limit of detection, or limit of quantification, is encountered in all scientific disciplines. This explains the variety of definitions and the diversity of juridiction specific solutions developed to address preferences. In the simplest cases as in nuclear and chemical measurements, definitions and approaches have probably received the clearer and the simplest solutions. In biochemical tests and in biological experiments depending on many more intricate factors, the situation involving false positive and false negative responses is more delicate to handle. In many other disciplines such as geochemistry, seismology, astronomy, dendrochronology, climatology, life sciences in general, and in many other fields impossible to enumerate extensively, the problem is wider and deals with signal extraction out of a background of noise. It involves complex statistical analysis procedures and therefore it also depends on the models used, [5] the hypotheses and the simplifications or approximations to be made to handle and manage uncertainties. When the data resolution is poor and different signals overlap, different deconvolution procedures are applied to extract parameters. The use of different phenomenological, mathematical and statistical models may also complicate the exact mathematical definition of limit of detection and how it is calculated. This explains why it is not easy to come to a general consensus, if any, about the precise mathematical definition of the expression of limit of detection. However, one thing is clear: it always requires a sufficient number of data (or accumulated data) and a rigorous statistical analysis to render better signification statistically.

Limit of quantification

The limit of quantification (LoQ, or LOQ) is the lowest value of a signal (or concentration, activity, response...) that can be quantified with acceptable precision and accuracy.

The LoQ is the limit at which the difference between two distinct signals / values can be discerned with a reasonable certainty, i.e., when the signal is statistically different from the background. The LoQ may be drastically different between laboratories, so another detection limit is commonly used that is referred to as the Practical Quantification Limit (PQL).

See also

Related Research Articles

<span class="mw-page-title-main">Analytical chemistry</span> Study of the separation, identification, and quantification of matter

Analytical chemistry studies and uses instruments and methods to separate, identify, and quantify matter. In practice, separation, identification or quantification may constitute the entire analysis or be combined with another method. Separation isolates analytes. Qualitative analysis identifies analytes, while quantitative analysis determines the numerical amount or concentration.

<span class="mw-page-title-main">Atomic absorption spectroscopy</span> Type of spectroanalytical ciao

Atomic absorption spectroscopy (AAS) and atomic emission spectroscopy (AES) is a spectroanalytical procedure for the quantitative determination of chemical elements by free atoms in the gaseous state. Atomic absorption spectroscopy is based on absorption of light by free metallic ions.

<span class="mw-page-title-main">Allan variance</span> Measure of frequency stability in clocks and oscillators

The Allan variance (AVAR), also known as two-sample variance, is a measure of frequency stability in clocks, oscillators and amplifiers. It is named after David W. Allan and expressed mathematically as . The Allan deviation (ADEV), also known as sigma-tau, is the square root of the Allan variance, .

<span class="mw-page-title-main">Ultraviolet–visible spectroscopy</span> Range of spectroscopic analysis

Ultraviolet (UV) spectroscopy or ultraviolet–visible (UV–VIS) spectrophotometry refers to absorption spectroscopy or reflectance spectroscopy in part of the ultraviolet and the full, adjacent visible regions of the electromagnetic spectrum. Being relatively inexpensive and easily implemented, this methodology is widely used in diverse applied and fundamental applications. The only requirement is that the sample absorb in the UV-Vis region, i.e. be a chromophore. Absorption spectroscopy is complementary to fluorescence spectroscopy. Parameters of interest, besides the wavelength of measurement, are absorbance (A) or transmittance (%T) or reflectance (%R), and its change with time.

<span class="mw-page-title-main">Sensor</span> Converter that measures a physical quantity and converts it into a signal

A sensor is a device that produces an output signal for the purpose of sensing a physical phenomenon.

Chemometrics is the science of extracting information from chemical systems by data-driven means. Chemometrics is inherently interdisciplinary, using methods frequently employed in core data-analytic disciplines such as multivariate statistics, applied mathematics, and computer science, in order to address problems in chemistry, biochemistry, medicine, biology and chemical engineering. In this way, it mirrors other interdisciplinary fields, such as psychometrics and econometrics.

An assay is an investigative (analytic) procedure in laboratory medicine, mining, pharmacology, environmental biology and molecular biology for qualitatively assessing or quantitatively measuring the presence, amount, or functional activity of a target entity. The measured entity is often called the analyte, the measurand, or the target of the assay. The analyte can be a drug, biochemical substance, chemical element or compound, or cell in an organism or organic sample. An assay usually aims to measure an analyte's intensive property and express it in the relevant measurement unit.

<span class="mw-page-title-main">Calibration curve</span> Method for determining the concentration of a substance in an unknown sample

In analytical chemistry, a calibration curve, also known as a standard curve, is a general method for determining the concentration of a substance in an unknown sample by comparing the unknown to a set of standard samples of known concentration. A calibration curve is one approach to the problem of instrument calibration; other standard approaches may mix the standard into the unknown, giving an internal standard. The calibration curve is a plot of how the instrumental response, the so-called analytical signal, changes with the concentration of the analyte.

<span class="mw-page-title-main">Mass spectrum</span> Tool in chemical analysis

A mass spectrum is a histogram plot of intensity vs. mass-to-charge ratio (m/z) in a chemical sample, usually acquired using an instrument called a mass spectrometer. Not all mass spectra of a given substance are the same; for example, some mass spectrometers break the analyte molecules into fragments; others observe the intact molecular masses with little fragmentation. A mass spectrum can represent many different types of information based on the type of mass spectrometer and the specific experiment applied. Common fragmentation processes for organic molecules are the McLafferty rearrangement and alpha cleavage. Straight chain alkanes and alkyl groups produce a typical series of peaks: 29 (CH3CH2+), 43 (CH3CH2CH2+), 57 (CH3CH2CH2CH2+), 71 (CH3CH2CH2CH2CH2+) etc.

Cavity ring-down spectroscopy (CRDS) is a highly sensitive optical spectroscopic technique that enables measurement of absolute optical extinction by samples that scatter and absorb light. It has been widely used to study gaseous samples which absorb light at specific wavelengths, and in turn to determine mole fractions down to the parts per trillion level. The technique is also known as cavity ring-down laser absorption spectroscopy (CRLAS).

<span class="mw-page-title-main">Immunoassay</span> Biochemical test for a protein or other molecule using an antibody

An immunoassay (IA) is a biochemical test that measures the presence or concentration of a macromolecule or a small molecule in a solution through the use of an antibody (usually) or an antigen (sometimes). The molecule detected by the immunoassay is often referred to as an "analyte" and is in many cases a protein, although it may be other kinds of molecules, of different sizes and types, as long as the proper antibodies that have the required properties for the assay are developed. Analytes in biological liquids such as serum or urine are frequently measured using immunoassays for medical and research purposes.

In metrology, measurement uncertainty is the expression of the statistical dispersion of the values attributed to a measured quantity. All measurements are subject to uncertainty and a measurement result is complete only when it is accompanied by a statement of the associated uncertainty, such as the standard deviation. By international agreement, this uncertainty has a probabilistic basis and reflects incomplete knowledge of the quantity value. It is a non-negative parameter.

<span class="mw-page-title-main">Isotope dilution</span>

Isotope dilution analysis is a method of determining the quantity of chemical substances. In its most simple conception, the method of isotope dilution comprises the addition of known amounts of isotopically enriched substance to the analyzed sample. Mixing of the isotopic standard with the sample effectively "dilutes" the isotopic enrichment of the standard and this forms the basis for the isotope dilution method. Isotope dilution is classified as a method of internal standardisation, because the standard is added directly to the sample. In addition, unlike traditional analytical methods which rely on signal intensity, isotope dilution employs signal ratios. Owing to both of these advantages, the method of isotope dilution is regarded among chemistry measurement methods of the highest metrological standing.

The Standard addition method, often used in analytical chemistry, quantifies the analyte present in an unknown. This method is useful for analyzing complex samples where a matrix effect interferes with the analyte signal. In comparison to the calibration curve method, the standard addition method has the advantage of the matrices of the unknown and standards being nearly identical. This minimizes the potential bias arising from the matrix effect when determining the concentration.

In a chemical analysis, the internal standard method involves adding the same amount of a chemical substance to each sample and calibration solution. The internal standard responds proportionally to changes in the analyte and provides a similar, but not identical, measurement signal. It must also be absent from the sample matrix to ensure there is no other source of the internal standard present. Taking the ratio of analyte signal to internal standard signal and plotting it against the analyte concentrations in the calibration solutions will result in a calibration curve. The calibration curve can then be used to calculate the analyte concentration in an unknown sample.

In chemical analysis, matrix refers to the components of a sample other than the analyte of interest. The matrix can have a considerable effect on the way the analysis is conducted and the quality of the results are obtained; such effects are called matrix effects. For example, the ionic strength of the solution can have an effect on the activity coefficients of the analytes. The most common approach for accounting for matrix effects is to build a calibration curve using standard samples with known analyte concentration and which try to approximate the matrix of the sample as much as possible. This is especially important for solid samples where there is a strong matrix influence. In cases with complex or unknown matrices, the standard addition method can be used. In this technique, the response of the sample is measured and recorded, for example, using an electrode selective for the analyte. Then, a small volume of standard solution is added and the response is measured again. Ideally, the standard addition should increase the analyte concentration by a factor of 1.5 to 3, and several additions should be averaged. The volume of standard solution should be small enough to disturb the matrix as little as possible.

Response factor, usually in chromatography and spectroscopy, is the ratio between a signal produced by an analyte, and the quantity of analyte which produces the signal. Ideally, and for easy computation, this ratio is unity (one). In real-world scenarios, this is often not the case.

Analytical quality control (AQC) refers to all those processes and procedures designed to ensure that the results of laboratory analysis are consistent, comparable, accurate and within specified limits of precision. Constituents submitted to the analytical laboratory must be accurately described to avoid faulty interpretations, approximations, or incorrect results. The qualitative and quantitative data generated from the laboratory can then be used for decision making. In the chemical sense, quantitative analysis refers to the measurement of the amount or concentration of an element or chemical compound in a matrix that differs from the element or compound. Fields such as industry, medicine, and law enforcement can make use of AQC.

Ion suppression in LC-MS and LC-MS/MS refers to reduced detector response, or signal:noise as a manifested effect of competition for ionisation efficiency in the ionisation source, between the analyte(s) of interest and other endogenous or exogenous species which have not been removed from the sample matrix during sample preparation. Ion suppression is not strictly a problem unless interfering compounds elute at the same time as the analyte of interest. In cases where ion suppressing species do co-elute with an analyte, the effects on the important analytical parameters including precision, accuracy and limit of detection can be extensive, severely limiting the validity of an assay's results.

A blank value in analytical chemistry is a measurement of a blank. The reading does not originate from a sample, but the matrix effects, reagents and other residues. These contribute to the sample value in the analytical measurement and therefore have to be subtracted.

References

  1. IUPAC , Compendium of Chemical Terminology , 2nd ed. (the "Gold Book") (1997). Online corrected version: (2006) " detection limit ". doi : 10.1351/goldbook.L03540
  2. MacDougall D, Crummett WB, et al. (1980). "Guidelines for Data Acquisition and Data Quality Evaluation in Environmental Chemistry". Analytical Chemistry. 52 (14): 2242–49. doi:10.1021/ac50064a004.
  3. Saah AJ, Hoover DR (1998). "[Sensitivity and specificity revisited: significance of the terms in analytic and diagnostic language]". Ann Dermatol Venereol. 125 (4): 291–4. PMID   9747274.
  4. 1 2 Armbruster DA, Pry T (August 2008). "Limit of blank, limit of detection and limit of quantitation". The Clinical Biochemist. Reviews. 29 Suppl 1 (1): S49–S52. PMC   2556583 . PMID   18852857.
  5. 1 2 "R: "Detection" limit for each model". search.r-project.org. Retrieved 2022-01-04.
  6. Quesada-González D, Stefani C, González I, de la Escosura-Muñiz A, Domingo N, Mutjé P, Merkoçi A (September 2019). "Signal enhancement on gold nanoparticle-based lateral flow tests using cellulose nanofibers". Biosensors & Bioelectronics. 141: 111407. doi:10.1016/j.bios.2019.111407. hdl: 10261/201014 . PMID   31207571. S2CID   190531742.
  7. Long, Gary L.; Winefordner, J. D. (1983), "Limit of detection: a closer look at the IUPAC definition", Anal. Chem., 55 (7): 712A–724A, doi:10.1021/ac00258a724

Further reading