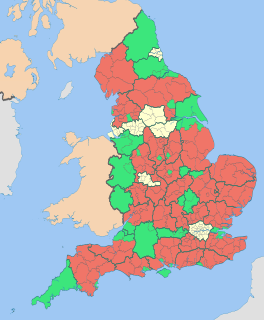
The 2015 Wychavon District Council election took place on 7 May 2015 to elect members of Wychavon District Council in Worcestershire, England. The whole council was up for election and the Conservative party stayed in overall control of the council. [1]
Wychavon is a local government district in Worcestershire, England. Its council is based in the town of Pershore, and the other towns in the district are Droitwich Spa and Evesham. The district extends from the south-east corner of Worcestershire north and west. It borders all the other districts of Worcestershire, as well as the counties of Gloucestershire and Warwickshire.
Non-metropolitan districts, or colloquially "shire districts", are a type of local government district in England. As created, they are sub-divisions of non-metropolitan counties in a two-tier arrangement.
Worcestershire is a county in the West Midlands of England. Between 1974 and 1998, it was merged with the neighbouring county of Herefordshire as Hereford and Worcester.
After the 2011 elections to Wychavon District Council the Conservatives controlled the council with 39 councillors, while the Liberal Democrats had five seats and there was one Labour party councillor. [2] In March 2012 the Conservative councillor for Lovett and North Claines, Alan Fisher, was suspended from the council for 6 months and on his return sat as an independent councillor. [3] [4] Another change came in December 2013 when the councillor for Elmley Castle and Somerville, Roma Kirke, left the Conservatives to become an independent, before resigning from the council in December 2014. [5] [6] A further seat was vacant at the 2015 election in Badsey ward after the death of Conservative councillor Reg Jakeman, leaving the Conservatives with 36 seats, Liberal Democrats five, Labour one and there was one independent. [7]
A Councillor is a member of a local government council.
The Liberal Democrats are a liberal, centrist political party in the United Kingdom. They presently have 11 Members of Parliament in the House of Commons, 96 members of the House of Lords, and one member of the European Parliament. They also have five Members of the Scottish Parliament and a member each in the Welsh Assembly and London Assembly. The party reached the height of its influence in the early 2010s, forming a junior partner in a coalition government from 2010 to 2015. It is presently led by Vince Cable.
The 2015 election was the first time where parliamentary, district and parish elections were held at the same time in Wychavon since Wychavon District Council was founded in 1974. [8] Over 100 candidates stood in the district election, up from 72 in 2011 and the number of contested wards increased from 21 to 28. [8] Four Conservative candidates were elected unopposed in Bredon, Drakes Broughton, Honeybourne and Pebworth, and Norton and Whittington wards. [7] [9]
A parish council is a civil local authority found in England and is the first tier of local government. They are elected corporate bodies, have variable tax raising powers, and are responsible for areas known as civil parishes, serving in total 16 million people. A parish council serving a town may be called a town council, and a parish council serving a city is styled a city council; these bodies have the same powers, duties and status as a parish council.
Bredon is a village and civil parish in Wychavon District at the southern edge of Worcestershire in England. It lies on the banks of the River Avon on the lower slopes of Bredon Hill, at "the beginning of the Cotswolds". As "Brensham Village", it has been made famous by the writer John Moore, whose descriptions of village life between the wars are widely celebrated.
The Conservatives retained control of the council after winning 39 seats, the same as in 2011, but up from immediately before the election. [10] [11] Labour lost their only seat on the council to the Conservatives in Droitwich West, after the Labour councillor Peter Pinfield stood down at the election, which meant the Conservatives won every seat in Droitwich. [12]
Droitwich Spa is a town in northern Worcestershire, England, on the River Salwarpe. It is located approximately 22 miles (35 km) south of Birmingham and 12 miles (19 km) west of Redditch.
The Liberal Democrats remained the largest opposition party on the council with five seats, after holding all of the seats they had been defending. [13] The only other councillor elected was Ged Bearcroft for the UK Independence Party in Great Hampton ward. [11] He defeated the Conservative councillor for the previous 32 years, John Smith, by 17 votes after a recount, to win the first ever UK Independence Party seat on Wychavon District Council. [11] [13] Overall turnout at the election was 70.19%, [9] up from 47% in 2011 and 42% in 2007, and reaching 81.78% in Bowbrook. [12] [14]
The UK Independence Party is a hard Eurosceptic, right-wing political party in the United Kingdom. It currently has one representative in the House of Lords and seven Members of the European Parliament (MEPs). It has four Assembly Members (AMs) in the National Assembly for Wales and one member in the London Assembly. The party reached its greatest level of success in the mid-2010s, when it gained two Members of Parliament and was the largest UK party in the European Parliament.
Voter turnout is the percentage of eligible voters who cast a ballot in an election. Eligibility varies by country, and the voting-eligible population should not be confused with the total adult population. Age and citizenship status are often among the criteria used to determine eligibility, but some countries further restrict eligibility based on sex, race, or religion.
Following the election the Conservative leader of the council, Paul Middlebrough, stepped down as leader after eight years and was succeeded by Linda Robinson. [10]
Party | Seats | Gains | Losses | Net gain/loss | Seats % | Votes % | Votes | +/− | |
---|---|---|---|---|---|---|---|---|---|
Conservative | 39 | 3 | 1 | +2 | 86.7 | 58.2 | 49,387 | -0.6% | |
Liberal Democrat | 5 | 0 | 0 | 0 | 11.1 | 14.5 | 12,283 | -7.6% | |
UKIP | 1 | 1 | 0 | +1 | 2.2 | 9.3 | 7,898 | +9.3% | |
Green | 0 | 0 | 0 | 0 | 0 | 7.5 | 6,397 | +5.5% | |
Labour | 0 | 0 | 1 | -1 | 0 | 6.0 | 5,081 | -4.4% | |
Independent | 0 | 0 | 2 | -2 | 0 | 4.1 | 3,493 | -2.6% | |
Monster Raving Loony | 0 | 0 | 0 | 0 | 0 | 0.4 | 326 | +0.4% |
Party | Candidate | Votes | % | ± | |
---|---|---|---|---|---|
Conservative | Mark Goodge | 681 | 44.4 | -6.8 | |
Independent | Mary Campbell | 574 | 37.4 | -11.4 | |
UKIP | Anthony Haugh | 279 | 18.2 | +18.2 | |
Majority | 107 | 7.0 | +4.6 | ||
Turnout | 1,534 | 68.7 | +23.8 | ||
Conservative hold | Swing |
Party | Candidate | Votes | % | ± | |
---|---|---|---|---|---|
Conservative | Martin King | 1,385 | |||
Conservative | Emma Stokes | 1,199 | |||
UKIP | Jeremy Farrow | 986 | |||
Green | Christopher Wilson | 687 | |||
Turnout | 4,257 | 61.7 | +22.3 | ||
Conservative hold | Swing | ||||
Conservative hold | Swing |
Party | Candidate | Votes | % | ± | |
---|---|---|---|---|---|
Liberal Democrat | Alexandra Rowley | 1,109 | 55.9 | -3.6 | |
Conservative | Sydney Bates | 874 | 44.1 | +3.6 | |
Majority | 235 | 11.9 | -7.1 | ||
Turnout | 1,983 | 81.8 | +23.8 | ||
Liberal Democrat hold | Swing |
Party | Candidate | Votes | % | ± | |
---|---|---|---|---|---|
Conservative | Adrian Hardman | unopposed | |||
Conservative hold | Swing |
Party | Candidate | Votes | % | ± | |
---|---|---|---|---|---|
Liberal Democrat | Keith Wright | 840 | 56.2 | +2.8 | |
Conservative | David Ernest | 655 | 43.8 | -2.8 | |
Majority | 185 | 12.4 | +5.6 | ||
Turnout | 1,495 | 69.1 | +19.1 | ||
Liberal Democrat hold | Swing |
Party | Candidate | Votes | % | ± | |
---|---|---|---|---|---|
Conservative | Elizabeth Eyre | 2,048 | |||
Conservative | Bradley Thomas | 1,533 | |||
Green | Liam Wilson | 684 | |||
Monster Raving Loony | Paul Brockman | 326 | |||
Turnout | 4,591 | 73.3 | |||
Conservative hold | Swing | ||||
Conservative hold | Swing |
Party | Candidate | Votes | % | ± | |
---|---|---|---|---|---|
Conservative | Hugh Hamilton | 902 | 67.0 | -5.8 | |
Liberal Democrat | Peter Evans | 445 | 33.0 | +5.8 | |
Majority | 457 | 33.9 | -11.6 | ||
Turnout | 1,347 | 67.7 | +28.6 | ||
Conservative hold | Swing |
Party | Candidate | Votes | % | ± | |
---|---|---|---|---|---|
Conservative | Paul Middlebrough | unopposed | |||
Conservative hold | Swing |
Party | Candidate | Votes | % | ± | |
---|---|---|---|---|---|
Conservative | Roy Murphy | 486 | 37.8 | -5.6 | |
Labour | Alan Humphries | 347 | 27.0 | -7.9 | |
UKIP | Neil Whelan | 323 | 25.1 | +25.1 | |
Liberal Democrat | Rebecca Littlechild | 130 | 10.1 | -11.6 | |
Majority | 139 | 10.8 | +2.3 | ||
Turnout | 1,286 | 65.4 | +23.4 | ||
Conservative hold | Swing |
Party | Candidate | Votes | % | ± | |
---|---|---|---|---|---|
Conservative | Gordon Brookes | 1,587 | |||
Conservative | Glenise Noyes | 1,201 | |||
Labour | Sheila Neary | 775 | |||
UKIP | Andrew Morgan | 724 | |||
Liberal Democrat | David Rowe | 534 | |||
Turnout | 4,821 | 69.7 | +25.0 | ||
Conservative hold | Swing | ||||
Conservative hold | Swing |
Party | Candidate | Votes | % | ± | |
---|---|---|---|---|---|
Conservative | Richard Morris | 1,950 | |||
Conservative | Maureen Lawley | 1,663 | |||
UKIP | Charlotte Townsend | 613 | |||
Labour | Stephen Ainsworth | 494 | |||
Liberal Democrat | Robert Crawford | 455 | |||
Green | Robert Burkett | 296 | |||
Liberal Democrat | Adrian Key | 287 | |||
Turnout | 5,758 | 78.9 | +27.1 | ||
Conservative hold | Swing | ||||
Conservative hold | Swing |
Party | Candidate | Votes | % | ± | |
---|---|---|---|---|---|
Conservative | Robert Beale | 1,208 | |||
Conservative | Thomas Noyes | 1,131 | |||
UKIP | Yuleen Jewell | 641 | |||
Labour | Bill Baker | 602 | |||
Liberal Democrat | Wendy Carter | 432 | |||
Green | Jane Zurek | 301 | |||
Liberal Democrat | John Littlechild | 231 | |||
Turnout | 4,546 | 70.4 | +24.6 | ||
Conservative hold | Swing | ||||
Conservative hold | Swing |
Party | Candidate | Votes | % | ± | |
---|---|---|---|---|---|
Conservative | Janet Bolton | 983 | |||
Conservative | Catherine Powell | 897 | |||
Labour | Eve Freer | 829 | |||
Labour | Jacqueline O'Reilly | 604 | |||
Green | Ann Bennett | 381 | |||
Turnout | 3,694 | 56.5 | +22.3 | ||
Conservative hold | Swing | ||||
Conservative gain from Labour | Swing | ||||
Party | Candidate | Votes | % | ± | |
---|---|---|---|---|---|
Conservative | Ronald Davis | 1,177 | 69.4 | +5.9 | |
Labour | Priscilla Cameron | 518 | 30.6 | +16.7 | |
Majority | 659 | 38.9 | -2.0 | ||
Turnout | 1,695 | 76.2 | +16.2 | ||
Conservative hold | Swing |
Party | Candidate | Votes | % | ± | |
---|---|---|---|---|---|
Conservative | George Mackison | 1,013 | 67.3 | -1.5 | |
Green | Daniel Mulligan | 492 | 32.7 | +32.7 | |
Majority | 521 | 34.6 | -3.1 | ||
Turnout | 1,505 | 76.6 | +44.0 | ||
Conservative gain from Independent | Swing | ||||
Party | Candidate | Votes | % | ± | |
---|---|---|---|---|---|
Conservative | Robert Raphael | 908 | |||
Conservative | Josephine Sandalls | 774 | |||
UKIP | Richard Keel | 702 | |||
Green | Colin Tether | 616 | |||
Liberal Democrat | Timothy Haines | 456 | |||
Turnout | 3,456 | 60.7 | +26.4 | ||
Conservative hold | Swing | ||||
Conservative hold | Swing |
Party | Candidate | Votes | % | ± | |
---|---|---|---|---|---|
Conservative | James Bulman | 1,368 | |||
Conservative | Kenneth Barclay-Timmis | 1,271 | |||
Green | Edward Cohen | 903 | |||
Turnout | 3,542 | 61.3 | |||
Conservative hold | Swing | ||||
Conservative hold | Swing |
Party | Candidate | Votes | % | ± | |
---|---|---|---|---|---|
Conservative | Michelle English | 1,061 | 62.9 | -14.8 | |
Liberal Democrat | Diana Brown | 338 | 20.0 | -2.3 | |
Green | Julian Eldridge | 289 | 17.1 | +17.1 | |
Majority | 723 | 42.8 | -12.7 | ||
Turnout | 1,688 | 77.4 | +11.2 | ||
Conservative hold | Swing |
Party | Candidate | Votes | % | ± | |
---|---|---|---|---|---|
UKIP | Gerald Bearcroft | 624 | 43.6 | ||
Conservative | John Smith | 607 | 42.4 | ||
Green | Michael Parker | 201 | 14.0 | ||
Majority | 17 | 1.2 | |||
Turnout | 1,432 | 66.8 | |||
UKIP gain from Conservative | Swing | ||||
Party | Candidate | Votes | % | ± | |
---|---|---|---|---|---|
Conservative | Nigel Dowty | 943 | 59.3 | ||
Independent | Sheridan Tranter | 439 | 27.6 | ||
Liberal Democrat | Andrew Murcott | 208 | 13.1 | ||
Majority | 504 | 31.7 | |||
Turnout | 1,590 | 73.7 | |||
Conservative hold | Swing |
Party | Candidate | Votes | % | ± | |
---|---|---|---|---|---|
Conservative | Charles Homer | 1,103 | 73.6 | ||
Green | Sarah Cohen | 395 | 26.4 | ||
Majority | 708 | 47.3 | |||
Turnout | 1,498 | 74.2 | |||
Conservative hold | Swing |
Party | Candidate | Votes | % | ± | |
---|---|---|---|---|---|
Conservative | Alastair Adams | unopposed | |||
Conservative hold | Swing |
Party | Candidate | Votes | % | ± | |
---|---|---|---|---|---|
Conservative | Audrey Steel | 2,248 | |||
Conservative | David Wilkinson | 1,778 | |||
Independent | David Powis | 958 | |||
UKIP | Clive Owen | 716 | |||
UKIP | Peter Jewell | 548 | |||
Turnout | 6,248 | 78.9 | +21.8 | ||
Conservative hold | Swing | ||||
Conservative hold | Swing |
Party | Candidate | Votes | % | ± | |
---|---|---|---|---|---|
Conservative | Gerard O'Donnell | 1,223 | |||
Conservative | Frances Smith | 1,030 | |||
UKIP | Peter Long | 808 | |||
Green | Jonathan Thompson | 534 | |||
Turnout | 3,595 | 60.1 | +25.5 | ||
Conservative hold | Swing | ||||
Conservative hold | Swing |
Party | Candidate | Votes | % | ± | |
---|---|---|---|---|---|
Conservative | Anthony Miller | 2,109 | |||
Conservative | Lynne Duffy | 1,846 | |||
Liberal Democrat | Roy Roberson | 826 | |||
Independent | Nigel Addison | 739 | |||
Turnout | 5,520 | 76.3 | +27.1 | ||
Conservative hold | Swing | ||||
Conservative gain from Independent | Swing | ||||
Party | Candidate | Votes | % | ± | |
---|---|---|---|---|---|
Conservative | Robert Adams | unopposed | |||
Conservative hold | Swing |
Party | Candidate | Votes | % | ± | |
---|---|---|---|---|---|
Conservative | Peter Tomlinson | 1,058 | 76.3 | ||
Liberal Democrat | Judith Cussen | 329 | 23.7 | ||
Majority | 729 | 52.6 | |||
Turnout | 1,387 | 72.7 | |||
Conservative hold | Swing |
Party | Candidate | Votes | % | ± | |
---|---|---|---|---|---|
Liberal Democrat | Charles Tucker | 1,598 | |||
Conservative | Michael Rowley | 1,419 | |||
Conservative | Valerie Wood | 1,315 | |||
Conservative | David Smith | 1,226 | |||
Liberal Democrat | Carolyn Harford | 1,035 | |||
UKIP | Jonathan Townsend | 934 | |||
Liberal Democrat | Derrick Watt | 858 | |||
Independent | David Annis | 783 | |||
Labour | Peter Brookbank | 771 | |||
Turnout | 9,939 | 66.8 | +17.3 | ||
Liberal Democrat hold | Swing | ||||
Conservative hold | Swing | ||||
Conservative hold | Swing |
Party | Candidate | Votes | % | ± | |
---|---|---|---|---|---|
Liberal Democrat | Elizabeth Tucker | 1,129 | 65.0 | -5.9 | |
Conservative | Clive Brooker | 608 | 35.0 | +5.9 | |
Majority | 521 | 30.0 | -11.8 | ||
Turnout | 1,737 | 74.8 | +19.4 | ||
Liberal Democrat hold | Swing |
Party | Candidate | Votes | % | ± | |
---|---|---|---|---|---|
Liberal Democrat | Adrian Darby | 671 | 46.6 | ||
Conservative | Beverley Hardman | 628 | 43.6 | ||
Labour | Robert Facer | 141 | 9.8 | ||
Majority | 43 | 3.0 | |||
Turnout | 1,440 | 76.4 | |||
Liberal Democrat hold | Swing |
Party | Candidate | Votes | % | ± | |
---|---|---|---|---|---|
Conservative | Richard Lasota | 951 | 60.6 | +5.5 | |
Green | Innes Barnes | 618 | 39.4 | +39.4 | |
Majority | 333 | 21.2 | +10.9 | ||
Turnout | 1,569 | 72.3 | +20.0 | ||
Conservative hold | Swing |
Party | Candidate | Votes | % | ± | |
---|---|---|---|---|---|
Conservative | Linda Robinson | 1,340 | 78.3 | ||
Liberal Democrat | Gregory Thomas | 372 | 21.7 | ||
Majority | 968 | 56.5 | |||
Turnout | 1,712 | 78.6 | |||
Conservative hold | Swing |
A by-election was held in Droitwich East on 30 July 2015 after the death of Conservative councillor Glenise Noyes. [15] [16] The seat was held for Conservatives by Karen Tomalin with a majority of the 320 votes over Labour party candidate Jacqueline O'Reilly. [16] [17]
Party | Candidate | Votes | % | ± | |
---|---|---|---|---|---|
Conservative | Karen Tomalin | 495 | 52.2 | +8.3 | |
Labour | Jacqueline O'Reilly | 175 | 18.4 | -3.0 | |
UKIP | Andrew Morgan | 171 | 18.0 | -2.0 | |
Liberal Democrat | Rory Roberson | 108 | 11.4 | -3.4 | |
Majority | 320 | 33.7 | |||
Turnout | 949 | 22.1 | -47.6 | ||
Conservative hold | Swing |
Two by-elections were held on 4 May 2017.
A by-election was held in Evesham South after the retirement of Ken Barclay on health grounds. The seat was held for the Conservatives by Matt Snape with a majority of 351 votes over the Liberal Democrat candidate Julie Haines. [18]
Party | Candidate | Votes | % | ± | |
---|---|---|---|---|---|
Conservative | Matt Snape | 538 | 51.2 | +15.4 | |
Liberal Democrat | Julie Haines | 187 | 17.8 | N/A | |
Green | Julie Tucker | 171 | 16.2 | -9.2 | |
Independent | Emma Nishigaki | 154 | 14.6 | N/A | |
Majority | 351 | 33.4 | |||
Turnout | 1,050 | ||||
Conservative hold | Swing |
A by-election was held in Droitwich South East following the death of Maureen Lawley. The seat was held for the Conservatives by Sital Harris with a majority of 903 votes over the Liberal Democrat candidate Adrian Key. [19]
Party | Candidate | Votes | % | ± | |
---|---|---|---|---|---|
Conservative | Sital Harris | 1161 | 66.6 | ||
Liberal Democrat | Adrian Key | 258 | 14.8 | ||
Labour | Valerie Patricia Rose Humphries | 216 | 12.4 | ||
Green | Jane Delia Zurek | 96 | 5.5 | ||
Majority | 351 | 33.4 | |||
Turnout | 1,050 | ||||
Conservative hold | Swing |
Mid Worcestershire is a constituency represented in the House of Commons of the UK Parliament since 2015 by Nigel Huddleston, a Conservative.
The 2002 St Albans City and District Council election took place on 2 May 2002 to elect members of St Albans District Council in Hertfordshire, England. One third of the council was up for election and the council stayed under no overall control.
Thanet District Council in Kent, England is elected every four years.
The 2007 Carlisle City Council election took place on 3 May 2007 to elect members of Carlisle District Council in Cumbria, England. One third of the council was up for election and the council stayed under no overall control.
The 2014 St Albans City and District Council election took place on 22 May 2014 to elect members of St Albans District Council in Hertfordshire, England. One third of the council was up for election and the council stayed under no overall control.
The 2012 Huntingdonshire District Council election took place on 3 May 2012 to elect members of Huntingdonshire District Council in Cambridgeshire, England. One third of the council was up for election and the Conservative party stayed in overall control of the council.
The 2011 Harlow District Council election took place on 5 May 2011 to elect members of Harlow District Council in Essex, England. One third of the council was up for election and the Conservative party stayed in overall control of the council.
The 2010 St Helens Metropolitan Borough Council election took place on 6 May 2010 to elect members of St Helens Metropolitan Borough Council in Merseyside, England. One third of the council was up for election and the Labour party gained overall control of the council from no overall control.
The 2012 St Helens Metropolitan Borough Council election took place on 3 May 2012 to elect members of St Helens Metropolitan Borough Council in Merseyside, England. One third of the council was up for election and the Labour party stayed in overall control of the council.
The 2014 Craven District Council election took place on 22 May 2014 to elect members of Craven District Council in North Yorkshire, England. One third of the council was up for election and the Conservative party stayed in overall control of the council.
The 1999 Wychavon District Council election took place on 6 May 1999 to elect members of Wychavon District Council in Worcestershire, England. The whole council was up for election and the Conservative party gained overall control of the council from no overall control.
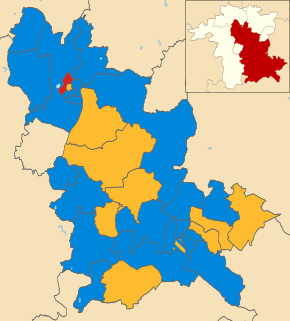
The 2003 Wychavon District Council election took place on 1 May 2003 to elect members of Wychavon District Council in Worcestershire, England. The whole council was up for election with boundary changes since the last election in 1999 reducing the number of seats by four. The Conservative party stayed in overall control of the council.
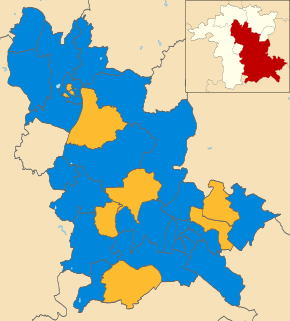
The 2007 Wychavon District Council election took place on 3 May 2007 to elect members of Wychavon District Council in Worcestershire, England. The whole council was up for election and the Conservative party stayed in overall control of the council.
The 2011 Wychavon District Council election took place on 5 May 2011 to elect members of Wychavon District Council in Worcestershire, England. The whole council was up for election and the Conservative party stayed in overall control of the council.
The 2015 Wyre Forest District Council election took place on 7 May 2015 to elect members of Wyre Forest District Council in Worcestershire, England. The whole council was up for election after boundary changes reduced the number of seats by nine. The Conservative party gained overall control of the council from no overall control.
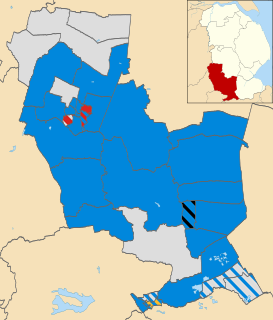
The 2011 South Kesteven District Council election took place on 5 May 2011 to elect members of South Kesteven District Council in Lincolnshire, England. The whole council was up for election and the Conservative party stayed in overall control of the council.
The 2007 Christchurch Borough Council election took place on 3 May 2007 to elect members of Christchurch Borough Council in Dorset, England. The whole council was up for election and the Conservative party stayed in overall control of the council.
The 2012 West Oxfordshire District Council election took place on 3 May 2012 to elect members of West Oxfordshire District Council in Oxfordshire, England. One third of the council was up for election and the Conservative party stayed in overall control of the council.
The 2014 West Oxfordshire District Council election took place on 22 May 2014 to elect members of West Oxfordshire District Council in Oxfordshire, England. One third of the council was up for election and the Conservative party stayed in overall control of the council.
The 2015 West Oxfordshire District Council election took place on 22 May 2015 to elect members of West Oxfordshire District Council in Oxfordshire, England. One third of the council was up for election and the Conservative party stayed in overall control of the council.