A microwave radiometer (MWR) is a radiometer that measures energy emitted at one millimeter-to-metre wavelengths (frequencies of 0.3–300 GHz) known as microwaves. Microwave radiometers are very sensitive receivers designed to measure thermally-emitted electromagnetic radiation. They are usually equipped with multiple receiving channels to derive the characteristic emission spectrum of planetary atmospheres, surfaces or extraterrestrial objects. Microwave radiometers are utilized in a variety of environmental and engineering applications, including remote sensing, weather forecasting, climate monitoring, radio astronomy and radio propagation studies.

The Upper Atmosphere Research Satellite (UARS) was a NASA-operated orbital observatory whose mission was to study the Earth's atmosphere, particularly the protective ozone layer. The 5,900-kilogram (13,000 lb) satellite was deployed from Space Shuttle Discovery during the STS-48 mission on 15 September 1991. It entered Earth orbit at an operational altitude of 600 kilometers (370 mi), with an orbital inclination of 57 degrees.

Jason-1 was a satellite altimeter oceanography mission. It sought to monitor global ocean circulation, study the ties between the ocean and the atmosphere, improve global climate forecasts and predictions, and monitor events such as El Niño and ocean eddies. Jason-1 was launched in 2001 and it was followed by OSTM/Jason-2 in 2008, and Jason-3 in 2016 – the Jason satellite series. Jason-1 was launched alongside the TIMED spacecraft.

TOPEX/Poseidon was a joint satellite altimeter mission between NASA, the U.S. space agency; and CNES, the French space agency, to map ocean surface topography. Launched on August 10, 1992, it was the first major oceanographic research satellite. TOPEX/Poseidon helped revolutionize oceanography by providing data previously impossible to obtain. Oceanographer Walter Munk described TOPEX/Poseidon as "the most successful ocean experiment of all time." A malfunction ended normal satellite operations in January 2006.

The National Space Activities Commission is the civilian agency of the government of Argentina in charge of the national space programme.

NOAA-19, known as NOAA-N' before launch, is the last of the American National Oceanic and Atmospheric Administration (NOAA) series of weather satellites. NOAA-19 was launched on 6 February 2009. NOAA-19 is in an afternoon Sun-synchronous orbit and is intended to replace NOAA-18 as the prime afternoon spacecraft.

The Active Cavity Radiometer Irradiance Monitor Satellite, or ACRIMSAT was a satellite carrying the ACRIM-3 instrument. It was one of the 21 observational components of NASA's Earth Observing System program. The instrument followed upon the ACRIM-1 and ACRIM-2 instruments that were launched on multi-instrument satellite platforms. ACRIMSAT was launched on 20 December 1999 from Vandenberg Air Force Base as the secondary payload on the Taurus launch vehicle that launched KOMPSAT. It was placed into a high inclination of 98.30°, at 720 km. Sun-synchronous orbit from which the ACRIM-3 instrument monitored total solar irradiance (TSI). Contact with the satellite was lost on 14 December 2013.

OSTM/Jason-2, or Ocean Surface Topography Mission/Jason-2 satellite, was an international Earth observation satellite altimeter joint mission for sea surface height measurements between NASA and CNES. It was the third satellite in a series started in 1992 by the NASA/CNES TOPEX/Poseidon mission and continued by the NASA/CNES Jason-1 mission launched in 2001.
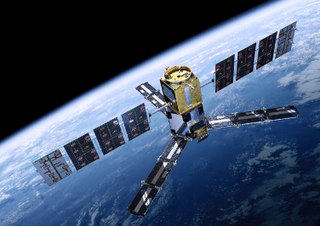
Soil Moisture and Ocean Salinity (SMOS) is a satellite which forms part of ESA's Living Planet Programme. It is intended to provide new insights into Earth's water cycle and climate. In addition, it is intended to provide improved weather forecasting and monitoring of snow and ice accumulation.
Microwave Imaging Radiometer with Aperture Synthesis (MIRAS) is the major instrument on the Soil Moisture and Ocean Salinity satellite (SMOS). MIRAS employs a planar antenna composed of a central body and three telescoping, deployable arms, in total 69 receivers on the Unit. Each receiver is composed of one Lightweight Cost-Effective Front-end (LICEF) module, which detects radiation in the microwave L-band, both in horizontal and vertical polarizations. The aperture on the LICEF detectors, planar in arrangement on MIRAS, point directly toward the Earth's surface as the satellite orbits. The arrangement and orientation of MIRAS makes the instrument a 2-D interferometric radiometer that generates brightness temperature images, from which both geophysical variables are computed. The salinity measurement requires demanding performance of the instrument in terms of calibration and stability. The MIRAS instrument's prime contractor was EADS CASA Espacio, manufacturing the payload of SMOS under ESA's contract.

Soil Moisture Active Passive (SMAP) is a NASA environmental monitoring satellite that measures soil moisture across the planet. It is designed to collect a global 'snapshot' of soil moisture every 2 to 3 days. With this frequency, changes from specific storms can be measured while also assessing impacts across seasons of the year. SMAP was launched on 31 January 2015. It was one of the first Earth observation satellites developed by NASA in response to the National Research Council's Decadal Survey.

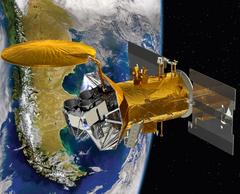
Gene Carl Feldman has been an oceanographer at NASA Goddard Space Flight Center (GSFC) since 1985. His primary interest has been to try to make the data that NASA gathers from its spaceborne fleet of Earth observing instruments, especially those monitoring the subtle changes in ocean color, as scientifically credible, readily understandable and as easily available to the broadest group of people possible. He has been involved in a number of past and present NASA missions including the Coastal Zone Color Scanner (CZCS), the Sea-Viewing Wide Field Sensor (SeaWiFS) and the Moderate-Resolution Imaging Spectroradiometer (MODIS) and along with the NASA Ocean Biology Processing group which he co-leads, been given the responsibility for designing, implementing and operating the data processing and mission operations component of ocean salinity mission called Aquarius, a space mission developed by NASA and the Space Agency of Argentina - Comisión Nacional de Actividades Espaciales (CONAE) that was successfully launched in June 2011 and began routine operations on December 1, 2011 and completed its prime mission in June 2015.

SAC-D, also known as Aquarius after its primary instrument, is an Argentine Earth science satellite built by INVAP and operated by CONAE. SAC-D was launched from Vandenberg Air Force Base on 10 June 2011, with a planned mission life of five years. Due to a power system failure, the mission was ended on 8 June 2015.
Sea ice thickness spatial extent, and open water within sea ice packs can vary rapidly in response to weather and climate. Sea ice concentration are measured by satellites, with the Special Sensor Microwave Imager / Sounder (SSMIS), and the European Space Agency's Cryosat-2 satellite to map the thickness and shape of the Earth's polar ice cover. The sea ice volume is calculated with the Pan-Arctic Ice Ocean Modeling and Assimilation System (PIOMAS), which blends satellite-observed data, such as sea ice concentrations into model calculations to estimate sea ice thickness and volume. Sea ice thickness determines a number of important fluxes such as heat flux between the air and ocean surface—see below—as well as salt and fresh water fluxes between the ocean since saline water ejects much of its salt content when frozen—see sea ice growth processes. It is also important for navigators on icebreakers since there is an upper limit to the thickness of ice any ship can sail through.

The Suomi National Polar-orbiting Partnership, previously known as the National Polar-orbiting Operational Environmental Satellite System Preparatory Project (NPP) and NPP-Bridge, is a weather satellite operated by the United States National Oceanic and Atmospheric Administration (NOAA). It was launched in 2011 and is currently in operation.
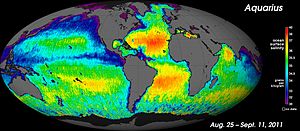
Satellite surface salinity refers to measurements of surface salinity made by remote sensing satellites. The radiative properties of the ocean surface are exploited in order to estimate the salinity of the water's surface layer.

NOAA-21, designated JPSS-2 prior to launch, is the second of the United States National Oceanic and Atmospheric Administration (NOAA)'s latest generation of U.S. polar-orbiting, non-geosynchronous, environmental satellites called the Joint Polar Satellite System. NOAA-21 was launched on 10 November 2022 and join NOAA-20 and Suomi NPP in the same orbit. Circling the Earth from pole-to-pole, it will cross the equator about 14 times daily, providing full global coverage twice a day. It was launched with LOFTID.

NOAA-20, designated JPSS-1 prior to launch, is the first of the United States National Oceanic and Atmospheric Administration's latest generation of U.S. polar-orbiting, non-geosynchronous, environmental satellites called the Joint Polar Satellite System. NOAA-20 was launched on 18 November 2017 and joined the Suomi National Polar-orbiting Partnership satellite in the same orbit. NOAA-20 operates about 50 minutes behind Suomi NPP, allowing important overlap in observational coverage. Circling the Earth from pole-to-pole, it crosses the equator about 14 times daily, providing full global coverage twice a day. This gives meteorologists information on "atmospheric temperature and moisture, clouds, sea-surface temperature, ocean color, sea ice cover, volcanic ash, and fire detection" so as to enhance weather forecasting including hurricane tracking, post-hurricane recovery by detailing storm damage and mapping of power outages.
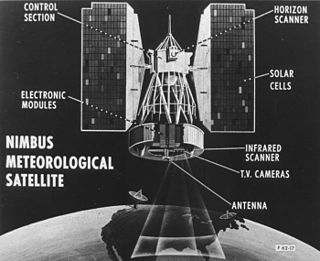
Nimbus 2 was a meteorological satellite. It was the second in a series of the Nimbus program.
NOAA-10, known as NOAA-G before launch, was an American weather satellite operated by the National Oceanic and Atmospheric Administration (NOAA) for use in the National Environmental Satellite Data and Information Service (NESDIS). It was the third of the Advanced TIROS-N series of satellites. The satellite design provided an economical and stable Sun-synchronous platform for advanced operational instruments to measure the atmosphere of Earth, its surface and cloud cover, and the near-space environment.