Elections to Brentwood Borough Council were held on 1 May 2008. One third of the council was up for election and the Conservative Party kept overall control of the council.
The Conservative Party, officially the Conservative and Unionist Party, is a centre-right political party in the United Kingdom. Presently led by Theresa May, it has been the governing party since 2010. It presently has 314 Members of Parliament in the House of Commons, 249 members of the House of Lords, and 18 members of the European Parliament. It also has 31 Members of the Scottish Parliament, 12 members of the Welsh Assembly, eight members of the London Assembly and 9,008 local councillors. One of the major parties of UK politics, it has formed the government on 45 occasions, more than any other party.
The Conservative remained dominant on the council gaining seats from the Liberal Democrats and the Labour Party. However they also lost seats to the Liberal Democrats and to an independent candidate, who became the only independent councillor on the council. [1]
A Councillor is a member of a local government council.
After the election, the composition of the council was
The Liberal Democrats are a liberal political party in the United Kingdom. They presently have 11 Members of Parliament in the House of Commons, 96 members of the House of Lords, and one member of the European Parliament. They also have five Members of the Scottish Parliament and a member each in the Welsh Assembly and London Assembly. The party reached the height of its influence in the early 2010s, forming a junior partner in a coalition government from 2010 to 2015. It is presently led by Vince Cable.
The Labour Party is a centre-left political party in the United Kingdom which has been described as an alliance of social democrats, democratic socialists and trade unionists. The party's platform emphasises greater state intervention, social justice and strengthening workers' rights.
Party | Seats | Gains | Losses | Net gain/loss | Seats % | Votes % | Votes | +/− | |
---|---|---|---|---|---|---|---|---|---|
Conservative | 9 | 2 | 2 | 0 | 75.0 | 58.6 | 11,304 | +4.6% | |
Liberal Democrat | 2 | 1 | 1 | 0 | 16.7 | 27.6 | 5,318 | -5.1% | |
Independent | 1 | 1 | 0 | +1 | 8.3 | 3.4 | 651 | +0.6% | |
Labour | 0 | 0 | 1 | -1 | 0 | 8.2 | 1,586 | -0.1% | |
UKIP | 0 | 0 | 0 | 0 | 0 | 2.2 | 431 | +0.0% | |
Party | Candidate | Votes | % | ± | |
---|---|---|---|---|---|
Liberal Democrat | Ross Carter | 911 | 47.5 | -1.1 | |
Conservative | Mark Reed | 865 | 45.1 | +2.2 | |
Labour | Gareth Barrett | 142 | 7.4 | -1.1 | |
Majority | 46 | 2.4 | -3.3 | ||
Turnout | 1,918 | 43.8 | +3.7 | ||
Liberal Democrat gain from Conservative | Swing | ||||
Party | Candidate | Votes | % | ± | |
---|---|---|---|---|---|
Conservative | Michael Golding | 832 | 49.3 | +8.6 | |
Labour | Julie Morrissey | 627 | 37.2 | -4.2 | |
Liberal Democrat | Gabriella Clarke | 227 | 13.5 | -4.4 | |
Majority | 205 | 12.1 | |||
Turnout | 1,686 | 42.2 | +4.6 | ||
Conservative gain from Labour | Swing | ||||
Party | Candidate | Votes | % | ± | |
---|---|---|---|---|---|
Conservative | Joan Holmes | 933 | 52.5 | +9.1 | |
Liberal Democrat | Nigel Clarke | 769 | 43.3 | -8.7 | |
Labour | Peter Mayo | 75 | 4.2 | -0.4 | |
Majority | 164 | 9.2 | +0.6 | ||
Turnout | 1,777 | 40.3 | +1.6 | ||
Conservative hold | Swing | ||||
Party | Candidate | Votes | % | ± | |
---|---|---|---|---|---|
Conservative | Roger McCheyne | 1,057 | 59.6 | +9.3 | |
Liberal Democrat | Jackie Anslow | 449 | 25.3 | -8.3 | |
UKIP | Yvonne Maguire | 201 | 11.3 | -0.5 | |
Labour | Sheila Maxey | 67 | 3.8 | -0.5 | |
Majority | 608 | 34.3 | +17.5 | ||
Turnout | 1,774 | 39.0 | +1.4 | ||
Conservative gain from Liberal Democrat | Swing | ||||
Party | Candidate | Votes | % | ± | |
---|---|---|---|---|---|
Conservative | Jean McGinley | 902 | 79.7 | +1.2 | |
Liberal Democrat | Christine Seymour | 154 | 13.6 | -2.1 | |
Labour | Robert Gow | 76 | 6.7 | +0.9 | |
Majority | 748 | 66.1 | +3.3 | ||
Turnout | 1,132 | 40.3 | -3.7 | ||
Conservative hold | Swing | ||||
Party | Candidate | Votes | % | ± | |
---|---|---|---|---|---|
Conservative | Louise Monnickendam | 805 | 71.2 | +23.6 | |
Liberal Democrat | Shirley Howe | 181 | 16.0 | +16.0 | |
Labour | Charles Bisson | 145 | 12.8 | +3.9 | |
Majority | 624 | 55.2 | +51.1 | ||
Turnout | 1,131 | 37.0 | -0.9 | ||
Conservative hold | Swing | ||||
Party | Candidate | Votes | % | ± | |
---|---|---|---|---|---|
Conservative | Frank Kenny | 894 | 78.4 | -1.8 | |
Liberal Democrat | Deborah Wood | 170 | 14.9 | +1.2 | |
Labour | Richard Enever | 76 | 6.7 | +0.6 | |
Majority | 724 | 63.5 | -3.1 | ||
Turnout | 1,140 | 38.0 | -6.0 | ||
Conservative hold | Swing | ||||
Party | Candidate | Votes | % | ± | |
---|---|---|---|---|---|
Conservative | Anthony Sleep | 1,308 | 67.0 | +14.2 | |
Liberal Democrat | Bobbie Hall | 279 | 14.3 | -20.1 | |
UKIP | Janette Gulleford | 230 | 11.8 | +2.8 | |
Labour | Jane Winter | 135 | 6.9 | +3.1 | |
Majority | 1,029 | 52.7 | +34.3 | ||
Turnout | 1,952 | 42.4 | -2.4 | ||
Conservative hold | Swing | ||||
Party | Candidate | Votes | % | ± | |
---|---|---|---|---|---|
Liberal Democrat | David Kendall | 1,057 | 58.8 | +1.0 | |
Conservative | Val Adams | 675 | 37.5 | -0.9 | |
Labour | Michele Wigram | 66 | 3.7 | -0.1 | |
Majority | 382 | 21.3 | +1.8 | ||
Turnout | 1,798 | 40.1 | +1.0 | ||
Liberal Democrat hold | Swing | ||||
Party | Candidate | Votes | % | ± | |
---|---|---|---|---|---|
Conservative | Margaret Brehaut | 1,303 | 77.7 | +0.0 | |
Liberal Democrat | Trevor Ellis | 269 | 16.1 | -1.3 | |
Labour | Kees Maxey | 104 | 6.2 | +1.3 | |
Majority | 1,034 | 61.6 | +1.3 | ||
Turnout | 1,676 | 40.7 | +1.3 | ||
Conservative hold | Swing | ||||
Party | Candidate | Votes | % | ± | |
---|---|---|---|---|---|
Independent | Roger Keeble | 651 | 46.3 | +46.3 | |
Conservative | Owen Rosindell | 631 | 44.9 | -26.3 | |
Liberal Democrat | Michael Aspinell | 93 | 6.6 | -16.5 | |
Labour | Paul Skingley | 30 | 2.1 | -3.6 | |
Majority | 20 | 1.4 | |||
Turnout | 1,405 | 47.8 | +8.2 | ||
Independent gain from Conservative | Swing | ||||
Party | Candidate | Votes | % | ± | |
---|---|---|---|---|---|
Conservative | David Tee | 1,099 | 57.8 | +7.2 | |
Liberal Democrat | Nina Cutbush | 759 | 39.9 | -4.3 | |
Labour | Richard Margrave | 43 | 2.3 | -2.9 | |
Majority | 340 | 17.9 | +11.5 | ||
Turnout | 1,901 | 44.2 | +3.2 | ||
Conservative hold | Swing | ||||
The 2010 Brentwood council election took place on 6 May 2010 to elect members of Brentwood District Council in Essex, England as part of the 2010 United Kingdom local elections. One third of the council was up for election with the council previously having a majority for the Conservative party. The Conservative Party lost two seats to the Liberal Democrats in Brentwood North and Brentwood West respectively.
Elections to Brentwood Council were held on 6 May 1999. One third of the council was up for election and the Liberal Democrat party kept overall control of the council.
Elections to Brentwood Council were held on 4 May 2000. One third of the council was up for election and the Liberal Democrat party kept overall control of the council.
Elections to Purbeck District Council were held on 1 May 2008. Nine of the twenty-four seats on the council were up for election and the council stayed under no overall control. Overall turnout was 44.86%.
Elections to Weymouth and Portland Borough Council in Dorset, England were held on 1 May 2008. One third of the council was up for election and the council stayed under no overall control as it has been since 1980.
Elections to Rossendale Borough Council were held on 1 May 2008. One third of the council was up for election and the Conservative party gained overall control of the council from no overall control. Overall turnout was up by one per cent from the last election in 2007 at 36.3%.
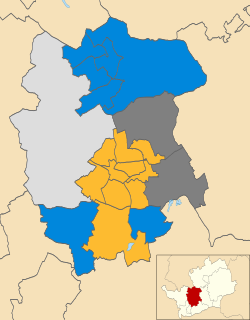
The 2008 St Albans City and District Council election took place on 1 May 2008 to elect members of St Albans District Council in Hertfordshire, England. One third of the council was up for election and the Liberal Democrats gained overall control of the council from no overall control.
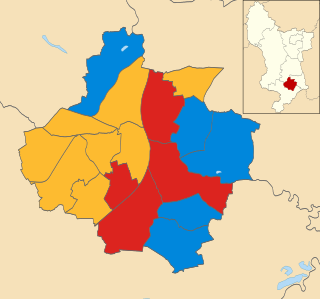
The 2008 Derby City Council election took place on 1 May 2008 to elect members of Derby City Council in England. One third of the council was up for election and the council stayed under no overall control. Overall turnout was 34.6%.
The 2008 Solihull Metropolitan Borough Council election took place on 1 May 2008 to elect members of Solihull Metropolitan Borough Council in the West Midlands, England. One third of the council was up for election and the Conservative party gained overall control of the council from no overall control.
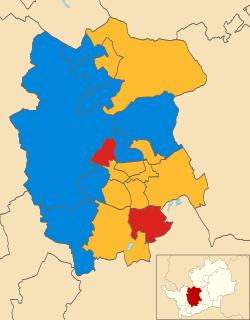
The 2006 St Albans City and District Council election took place on 4 May 2006 to elect members of St Albans District Council in Hertfordshire, England. One third of the council was up for election and the Liberal Democrats gained overall control of the council from no overall control.
The 2007 St Albans City and District Council election took place on 3 May 2007 to elect members of St Albans District Council in Hertfordshire, England. One third of the council was up for election and the Liberal Democrats lost overall control of the council to no overall control.
The 2007 Winchester Council election took place on 3 May 2007 to elect members of Winchester District Council in Hampshire, England. One third of the council was up for election and the Conservative party stayed in overall control of the council.
The 2008 Winchester Council election took place on 1 May 2008 to elect members of Winchester District Council in Hampshire, England. One third of the council was up for election and the Conservative party stayed in overall control of the council.
The 2010 Weymouth and Portland Borough Council election took place on 6 May 2010 to elect members of Weymouth and Portland Borough Council in Dorset, England. One third of the council was up for election and the council stayed under no overall control.
The 2006 Solihull Metropolitan Borough Council election took place on 4 May 2006 to elect members of Solihull Metropolitan Borough Council in the West Midlands, England. One third of the council was up for election and the Conservative party stayed in overall control of the council.
The 2007 Solihull Metropolitan Borough Council election took place on 4 May 2007 to elect members of Solihull Metropolitan Borough Council in the West Midlands, England. One third of the council was up for election and the Conservative party lost overall control of the council to no overall control.
The 2008 Sunderland Council election took place on 1 May 2008 to elect members of Sunderland Metropolitan Borough Council in Tyne and Wear, England. One third of the council was up for election and the Labour party stayed in overall control of the council.
The 2010 Sunderland Council election took place on 6 May 2010 to elect members of Sunderland Metropolitan Borough Council in Tyne and Wear, England. One third of the council was up for election and the Labour party stayed in overall control of the council. The election took place on the same day as the 2010 General Election.
The 2008 Stroud Council election took place on 1 May 2008 to elect members of Stroud District Council in Gloucestershire, England. One third of the council was up for election and the Conservative party stayed in overall control of the council.
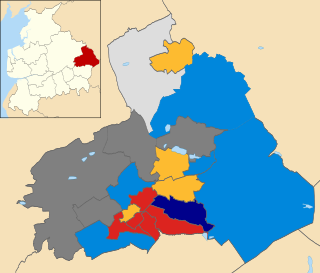
The 2008 Pendle Borough Council election took place on 1 May 2008 to elect members of Pendle Borough Council in Lancashire, England. One third of the council was up for election and the Liberal Democrats lost overall control of the council to no overall control.