| ||||||||||||||||||||||||||||||||||
All 70 seats to Croydon London Borough Council 36 seats needed for a majority | ||||||||||||||||||||||||||||||||||
---|---|---|---|---|---|---|---|---|---|---|---|---|---|---|---|---|---|---|---|---|---|---|---|---|---|---|---|---|---|---|---|---|---|---|
| ||||||||||||||||||||||||||||||||||
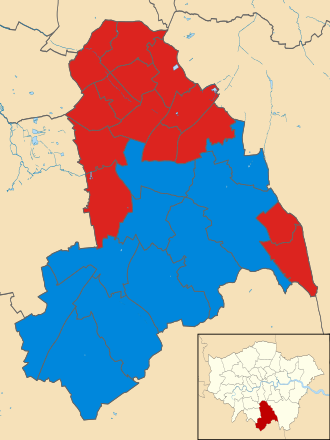
Map of the results of the 2014 Croydon council election. Conservatives in blue and Labour in red. | ||||||||||||||||||||||||||||||||||
|
The 2014 Croydon Council election took place on 22 May 2014 to elect members of Croydon Council in England. [1] This was on the same day as other local elections.
Party | Seats | Gains | Losses | Net gain/loss | Seats % | Votes % | Votes | +/− | |
---|---|---|---|---|---|---|---|---|---|
Labour | 40 | +7 | 57.1 | 35.8 | 38,277 | +4.5 | |||
Conservative | 30 | -7 | 42.9 | 33.4 | 35,734 | -3.6 | |||
UKIP | 0 | 0 | 14.8 | 15,880 | +12.4 | ||||
Green | 0 | 0 | 8.6 | 9,229 | +1.1 | ||||
Liberal Democrat | 0 | 0 | 5.7 | 6,062 | -12.7 | ||||
BNP | 0 | 0 | 0.6 | 638 | -1.3 | ||||
Independent | 0 | 0 | 0.4 | 443 | -0.3 | ||||
TUSC | 0 | 0 | 0.3 | 320 | N/A | ||||
Communist | 0 | 0 | 0.2 | 201 | ±0.0 | ||||
Putting Croydon First | 0 | 0 | 0.2 | 191 | +0.1 |
40 | 30 |
Labour | Conservative |
Party | Candidate | Votes | % | ± | |
---|---|---|---|---|---|
Labour | Sean Fitzsimons | 2,165 | |||
Labour | Patricia Hay-Justice | 2,027 | |||
Labour | Mark Watson | 1,962 | |||
Conservative | David Harmes | 1,723 | |||
Conservative | Lisa Terry | 1,653 | |||
Conservative | Partha Chatterjee | 1,630 | |||
UKIP | Peter Staveley | 659 | |||
Green | Paul Anderson | 458 | |||
Green | Esther Sutton | 439 | |||
Green | Joseph Hague | 362 | |||
Liberal Democrat | Christopher Adams | 266 | |||
Liberal Democrat | William Tucker | 186 | |||
Liberal Democrat | Tomas Howard-Jones | 169 | |||
Turnout | 4,995 | 42.5% | |||
Labour hold | Swing | ||||
Party | Candidate | Votes | % | ± | |
---|---|---|---|---|---|
Party | Candidate | Votes | % | ± | |
---|---|---|---|---|---|
Party | Candidate | Votes | % | ± | |
---|---|---|---|---|---|
Party | Candidate | Votes | % | ± | |
---|---|---|---|---|---|
Party | Candidate | Votes | % | ± | |
---|---|---|---|---|---|
Party | Candidate | Votes | % | ± | |
---|---|---|---|---|---|
Conservative | Maria Gatland | 2,042 | |||
Conservative | Michael Neal | 1,910 | |||
Conservative | Jason Perry | 1,803 | |||
Labour | Christopher Clark | 1,100 | |||
Labour | Paul Waddell | 1,099 | |||
Labour | Claudine Reid | 1,011 | |||
UKIP | Kathleen Garner | 629 | |||
Liberal Democrat | Michael Bishopp | 587 | |||
Green | Tracey Hague | 515 | |||
Liberal Democrat | Ben Devlin | 505 | |||
Liberal Democrat | John Jefkins | 500 | |||
Green | Gordon Halliday | 479 | |||
Green | Sasha Khan | 474 | |||
Putting Croydon First | Mark Samuel | 191 | |||
Independent | Tony Martin | 97 | |||
Turnout | 4,315 | 41.10% | |||
Registered electors | 11,318 | ||||
Conservative hold | Swing | ||||
Party | Candidate | Votes | % | ± | |
---|---|---|---|---|---|
Party | Candidate | Votes | % | ± | |
---|---|---|---|---|---|
Party | Candidate | Votes | % | ± | |
---|---|---|---|---|---|
Party | Candidate | Votes | % | ± | |
---|---|---|---|---|---|
Conservative | Janice Buttinger | 2,271 | 19.3 | ||
Conservative | Steven Hollands | 2,123 | 18.0 | ||
Conservative | Steve O'Connell | 2,111 | 17.9 | ||
UKIP | John Hooper | 914 | 7.7 | ||
UKIP | Ian Manton | 903 | 7.6 | ||
UKIP | 898 | 7.6 | |||
Labour | Sarah Ward | 451 | 3.8 | ||
Labour | Chris Williams | 388 | 3.3 | ||
Labour | Mary Crous | 356 | 3.0 | ||
Green | Shorai Dixon | 336 | 2.8 | ||
Liberal Democrat | Mary Catto | 271 | 2.3 | ||
Green | Tomas Vute | 265 | 2.1 | ||
Liberal Democrat | Olive Abdi | 238 | 2.0 | ||
Liberal Democrat | Thomas Knight | 217 | 1.8 | ||
Total votes | 11,733 | ||||
Conservative hold | Swing | ||||
Party | Candidate | Votes | % | ± | |
---|---|---|---|---|---|
Labour | Oliver Lewis | 1,224 | 22.3 | ||
Labour | Louisa Woodley | 1,094 | 19.9 | ||
UKIP | Clive Christenson | 740 | 13.5 | ||
Conservative | Anthony Pearson | 650 | 11.8 | ||
UKIP | Christopher Johnson | 639 | 11.6 | ||
Conservative | Lara Fish | 617 | 11.2 | ||
BNP | Cliff Le May | 178 | 3.2 | ||
Green | Andrew Cousins | 123 | 2.2 | ||
BNP | Donna Treanor | 107 | 1.9 | ||
Green | Paul Cloughton | 106 | 1.9 | ||
Turnout | 5,478 | ||||
Labour hold | Swing | ||||
Labour gain from Conservative | Swing | ||||
Party | Candidate | Votes | % | ± | |
---|---|---|---|---|---|
Party | Candidate | Votes | % | ± | |
---|---|---|---|---|---|
Party | Candidate | Votes | % | ± | |
---|---|---|---|---|---|
Party | Candidate | Votes | % | ± | |
---|---|---|---|---|---|
Party | Candidate | Votes | % | ± | |
---|---|---|---|---|---|
Party | Candidate | Votes | % | ± | |
---|---|---|---|---|---|
Labour | Kathy Bee | 2,303 | |||
Labour | Jane Avis | 2,211 | |||
Labour | Wayne Lawlor | 1,971 | |||
Conservative | Jonathan Cope | 1,009 | |||
Conservative | Matthew O'Flynn | 739 | |||
Conservative | Rosina Mat St. James | 731 | |||
Green | Graham Jones | 494 | |||
Green | Andrew Ellis | 486 | |||
UKIP | Winston McKenzie | 480 | |||
UKIP | Anette Reid | 437 | |||
UKIP | Barry Slayford | 437 | |||
Green | James Seyforth | 359 | |||
Liberal Democrat | Robert Brown | 314 | |||
Liberal Democrat | Kimberley Reid | 220 | |||
Liberal Democrat | Jonathan Regan | 177 | |||
Majority | |||||
Turnout | |||||
Labour hold | Swing | ||||
Party | Candidate | Votes | % | ± | |
---|---|---|---|---|---|
Party | Candidate | Votes | % | ± | |
---|---|---|---|---|---|
Party | Candidate | Votes | % | ± | |
---|---|---|---|---|---|
Party | Candidate | Votes | % | ± | |
---|---|---|---|---|---|
Labour | Robert W. Canning | 1,965 | |||
Labour | Andrew J. Pelling | 1,937 | |||
Labour | Joy I.D. Prince | 1,924 | |||
Conservative | Tony Harris | 1,803 | |||
Conservative | Simon Hoar | 1,696 | |||
Conservative | Mark P.A. Johnson | 1,565 | |||
UKIP | Jonathan W. Bailey | 585 | |||
UKIP | Kevin Adamson | 575 | |||
UKIP | Graham Rix | 537 | |||
Green | Mary J. Davey | 324 | |||
Green | Paula G. Onions | 293 | |||
Liberal Democrat | Kirsty S. Armstrong | 197 | |||
Green | Martyn Post | 190 | |||
Liberal Democrat | Michael J. Tavares | 151 | |||
TUSC | Anindya Bhattacharya | 71 | |||
Turnout | |||||
Labour gain from Conservative | Swing | ||||
Party | Candidate | Votes | % | ± | |
---|---|---|---|---|---|
Party | Candidate | Votes | % | ± | |
---|---|---|---|---|---|
Ward | Members elected in 2014 |
Addiscombe | Sean Fitzsimons (Lab) |
Patricia Hay-Justice (Lab) | |
Mark Watson (Lab) | |
Ashburton | Maddie Henson (Lab) |
Stephen Mann (Lab) | |
Andrew Rendle (Lab) | |
Bensham Manor | Jamie Audsley (Lab) |
Alison Butler (Lab) | |
Humayun Kabir (Lab) | |
Broad Green | Stuart Collins (Lab) |
Mike Selva (Lab) | |
Manju Shahul-Hameed (Lab) | |
Coulsdon East | Christopher Wright (Con) |
Margaret Bird (Con) | |
James Thompson (Con) | |
Coulsdon West | Luke Clancy (Con) |
Jeet Bains (Con) | |
Mario Creatura (Con) | |
Croham | Maria Gatland (Con) |
Michael Neal (Con) | |
Jason Perry (Con) | |
Fairfield | Vidhi Mohan (Con) |
Susan Winborn (Con) | |
Helen Pollard (Con) | |
Fieldway | Simon Hall (Lab) |
Carole Bonner (Lab) | |
Heathfield | Margaret Mead (Con) |
Jason Cummings (Con) | |
Andrew Stranack (Con) | |
Kenley | Jan Buttinger (Con) |
Steve O'Connell (Con) | |
Steve Hollands (Con) | |
New Addington | Oliver Lewis (Lab) |
Louisa Woodley (Lab) | |
Norbury | Maggie Mansell (Lab) |
Shafi Khan (Lab) | |
Sherwan Chowdhury (Lab) | |
Purley | Christopher Brew (Con) |
Badsha Quadir (Con) | |
Donald Speakman (con) | |
Sanderstead | Lynne Hale (Con) |
Timothy Pollard (Con) | |
Yvette Hopley (Con) | |
Selhurst | Timothy Godfrey (Lab) |
David Wood (Lab) | |
Toni Letts (Lab) | |
Selsdon and Ballards | Dudley Mead (Con) |
Sara Bashford (Con) | |
Phil Thomas (Con) | |
Shirley | Sue Bennett (Con) |
Richard Chatterjee (Con) | |
Mike Fisher (Con) | |
South Norwood | Kathy Bee (Lab) |
Jane Avis (Lab) | |
Wayne Lawlor (Lab) | |
Thornton Heath | Pat Clouder (Lab) |
Karen Jewitt (Lab) | |
Matthew Kyeremeh (Lab) | |
Upper Norwood | Alisa Flemming (Lab) |
Pat Ryan (Lab) | |
John Wentworth (Lab) | |
Waddon | Robert Canning (Lab) |
Andrew Pelling (Lab) | |
Joy Prince (Lab) | |
West Thornton | Emily Benn (Lab) |
Bernadette Khan (Lab) | |
Stuart King (Lab) | |
Woodside | Tony Newman (Lab) |
Paul Scott (Lab) | |
Hamida Ali (Lab) | |
Croydon Central is a constituency created in 1974 and is represented in the House of Commons of the UK Parliament since 2017 by Labour MP Sarah Jones. The seat bucked the national results in 2005 and in 2017, leaning to right and left respectively being in other results a bellwether, its winner belonging to the winning party nationally since 1979.
Croydon North is a constituency represented in the House of Commons of the UK Parliament since 2012 by Steve Reed of the Labour Party and the Co-operative Party. The seat was created in 1918 and split in two in 1955 and re-devised in a wholly different form in 1997.
Elections for the Council in the London Borough of Croydon are held every four years to elect 70 councillors. At the last elections, which were held in May 2014, 30 Conservative councillors and 40 Labour councillors, providing a Labour majority of ten seats.
Elections to Croydon Council in London, England were held on 4 May 2006. The whole council was up for election for the first time since the 2002 election. The Labour Party lost control of the council to the Conservative Party for the first time since 1994.
The Shire of Croydon is a local government area in western Queensland, Australia. The shire, administered from the town of Croydon, covers an area of 29,577.8 square kilometres (11,420.1 sq mi). The council consists of a mayor plus four councillors, each of whom represents the entire Shire.
Emily Sophia Wedgwood Benn, styled as The Honourable Emily Benn socially, is an English Labour politician. She is the eldest child and only daughter of The 3rd Viscount Stansgate and Nita Clarke, and the granddaughter of the late Labour MP Tony Benn. She was an unsuccessful Parliamentary candidate in both the 2010 and 2015 UK general elections. At the 2014 local elections, Benn was elected to the West Thornton ward of Croydon Borough Council.
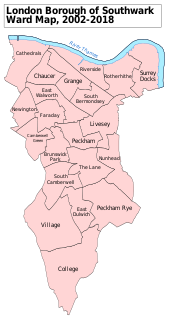
Southwark London Borough Council in London, England is elected every four years. Since the last boundary changes in 2002, 63 councillors have been elected from 21 wards.
Elections to Croydon Council in London, England were held on 4 May 2002. The whole council was up for election for the first time since the 1998 election. The Labour Party managed to keep control of the council which it had done since 1994 when it took power away from the Conservative Party. This year Labour held Croydon with a smaller majority, only clinging onto power through a tiny number of votes in its marginal wards - one councillor won by just eight votes.
Elections for the London Borough of Merton were held on 7 May 1998 to elect members of Merton London Borough Council in London, England. This was on the same day as other local elections in England and a referendum on the Greater London Authority; in the latter, Merton voted in favour of creating the Greater London Authority by 72.2% on a 37.6% turnout.
Elections for Croydon Council in London were held on 6 May 2010. The 2010 United Kingdom General Election and other local elections took place on the same day.
The 1964 Croydon Council election took place on 7 May 1964 to elect members of Croydon London Borough Council in London, England. The whole council was up for election and the council went into no overall control.
The 1968 Croydon Council election took place on 9 May 1968 to elect members of Croydon London Borough Council in London, England. The whole council was up for election and the Conservative party gained overall control of the council.. Turnout in this election was 36.2%.
The 1971 Croydon Council election took place on 13 May 1971 to elect members of Croydon London Borough Council in London, England. The whole council was up for election and the Conservative party stayed in overall control of the council.
The 1974 Croydon Council election took place on 2 May 1974 to elect members of Croydon London Borough Council in London, England. The whole council was up for election and the Conservative party stayed in overall control of the council.
The 1978 Croydon Council election took place on 4 May 1978 to elect members of Croydon London Borough Council in London, England. The whole council was up for election and the Conservative party stayed in overall control of the council.
The 1990 Croydon Council election took place on 3 May 1990 to elect members of Croydon London Borough Council in London, England. The whole council was up for election and the Conservative party stayed in overall control of the council.
The 1986 Croydon Council election took place on 8 May 1986 to elect members of Croydon London Borough Council in London, England. The whole council was up for election and the Conservative party stayed in overall control of the council.
The 1982 Croydon Council election took place on 6 May 1982 to elect members of Croydon London Borough Council in London, England. The whole council was up for election and the Conservative party stayed in overall control of the council.
The 1994 Croydon Council election took place on 5 May 1994 to elect members of Croydon London Borough Council in London, England. The whole council was up for election and the Labour party gained overall control of the council.
The 2018 Croydon Council election took place on 3 May 2018 to elect members of Croydon Council in England. This was on the same day as other London local elections.