This is a list of the busiest seaports by cargo tonnage, the total mass, or in some cases volume, of actual cargo transported through the port. The rankings are based on AAPA world port ranking data.
The cargo rankings based on tonnage should be interpreted with caution since these measures are not directly comparable and cannot be converted to a single, standardized unit. In the Measure column, MT = Metric Tons, HT = Harbor Tons, FT = Freight Tons, and RT = Revenue Tons.
Rank | Port | Country | Kilotons [1] |
---|---|---|---|
1 | Ningbo-Zhoushan | China | 1,261,340 |
2 | Tangshan | China | 768,870 |
3 | Shanghai | China | 727,770 |
4 | Qingdao | China | 657,540 |
5 | Guangzhou | China | 655,920 |
6 | Singapore | Singapore | 578,190 |
7 | Suzhou | China | 572,760 |
8 | Rizhao | China | 570,570 |
9 | Port Hedland | Australia | 566,210 |
10 | Tianjin | China | 549,020 |
11 | Rotterdam | Netherlands | 467,390 |
12 | Yantai | China | 462,570 |
13 | Busan | South Korea | 424,920 |
14 | Beibu Gulf | China | 371,340 |
15 | Taizhou | China | 364,440 |
16 | Jiangyin | China | 350,620 |
17 | Huanghua | China | 315,100 |
18 | Dalian | China | 306,130 |
19 | Fuzhou | China | 301,640 |
20 | Lianyungang | China | 301,110 |
Rank | Port | Country | 2019 kiloton [2] | 2018 kiloton [3] | |
---|---|---|---|---|---|
1 | Ningbo-Zhoushan | China | MT | 1,120,090 | 1,038,080 |
2 | Shanghai | China | MT | 716,770 | 716,590 |
3 | Tangshan | China | 656,740 | 636,990 | |
4 | Singapore | Singapore | FT | 626,180 | 630,130 |
5 | Guangzhou | China | MT | 606,160 | 538,330 |
6 | Qingdao | China | MT | 577,360 | 541,610 |
7 | Suzhou | China | 522,750 | 531,790 | |
8 | Port Hedland | Australia | MT | 521,880 | 517,990 |
9 | Tianjin | China | MT | 492,200 | 472,810 |
10 | Rotterdam | Netherlands | MT | 469,400 | 468,980 |
11 | Rizhao | China | 463,770 | 437,520 | |
12 | Busan | South Korea | RT | 455,910 | 450,220 |
13 | Yantai | China | 386,320 | 333,610 | |
14 | Dalian | China | MT | 366,410 | 351,300 |
15 | Nantong | China | MT | 336,200 | 265,980 |
16 | Zhanjiang | China | 329,160 | 157,720 | |
17 | Huanghua | China | 287,160 | 287,160 | |
18 | Taizhou | China | 282,430 | 255,130 | |
19 | Gwangyang | South Korea | RT | 276,040 | 268,130 |
20 | Hong Kong | China | MT | 263,320 | 258,540 |
Rank | Port | Country | 2017 [4] | 2016 [5] [6] | 2015 [7] [8] | 2014 [9] [10] | 2013 [11] [12] | 2012 [13] [14] | |
---|---|---|---|---|---|---|---|---|---|
1 | Ningbo-Zhoushan | China | MT | 1,077,110 | 922,092 | 889,000 | 873,470 | 810,000 | 744,000 |
2 | Shanghai | China | MT | 705,630 | 647,446 | 646,514 | 678,376 | 696,985 | 644,659 |
3 | Singapore | Singapore | FT | 626,170 | 593,297 | 575,846 | 581,268 | 560,888 | 538,012 |
4 | Suzhou | China | 607,740 | 573,760 | |||||
5 | Guangzhou | China | MT | 566,190 | 544,374 | 475,481 | 500,975 | 472,760 | 438,000 |
6 | Tangshan | China | 565,400 | 515,800 | |||||
7 | Port Hedland | Australia | MT | 512,330 | 484,510 | 452,940 | 446,922 | 488,000 | 288,443 |
8 | Qingdao | China | MT | 506,990 | 443,978 | 476,216 | 465,055 | 450,111 | 407,340 |
9 | Tianjin | China | MT | 502,840 | 428,098 | 440,430 | 445,780 | 477,399 | 477,000 |
10 | Rotterdam | Netherlands | MT | 467,350 | 461,177 | 466,363 | 444,733 | 440,464 | 441,527 |
11 | Dalian | China | MT | 451,050 | 318,413 | 320,658 | 337,366 | 320,843 | 303,000 |
12 | Busan | South Korea | RT | 400,510 | 349,708 | 347,713 | 335,411 | 313,295 | 298,689 |
13 | Yingkou | China | 362,390 | 347,020 | |||||
14 | Rizhao | China | 360,020 | 350,620 | |||||
15 | South Louisiana | United States | MT | 307,860 | 237,594 | 235,058 | 242,578 | 216,445 | 228,677 |
16 | Gwangyang | South Korea | RT | 291,830 | 283,106 | 272,007 | 134,947 | 127,642 | 109,730 |
17 | Yantai | China | 285,600 | 265,360 | |||||
18 | Hong Kong | China | MT | 281,550 | 256,730 | 256,488 | 297,737 | 276,055 | 269,282 |
19 | Zhanjiang | China | 281,520 | 255,170 | |||||
20 | Huanghua | China | 269,570 | 245,110 |
Rank | Port | Country | Measure | 2011 [15] | 2010 [16] | 2009 [17] | 2008 [18] | 2007 [19] | 2006 [20] | 2005 [21] | 2004 [22] |
---|---|---|---|---|---|---|---|---|---|---|---|
1 | Shanghai | China | MT | 590,439 | 534,371 | 505,715 | 508,000 | 561,446 | 537,000 | 443,000 | 378,962 |
2 | Singapore | Singapore | FT | 531,176 | 501,566 | 472,300 | 515,415 | 483,616 | 448,500 | 423,267 | 393,418 |
3 | Tianjin | China | MT | 459,941 | 400,000 | 381,110 | 365,163 | 309,465 | 257,600 | 245,100 | 206,161 |
4 | Rotterdam | Netherlands | MT | 434,551 | 429,926 | 386,957 | 421,136 | 401,181 | 378,400 | 376,600 | 352,563 |
5 | Guangzhou | China | MT | 431,000 | 425,600 | 364,000 | 347,000 | 341,363 | 302,800 | 241,700 | 215,190 |
6 | Qingdao | China | MT | 372,000 | 350,120 | 274,304 | 278,271 | 265,020 | 224,200 | 184,300 | 161,650 |
7 | Ningbo | China | MT | 348,911 | 408,180 | 371,540 | 361,850 | 471,630 | 309,700 | 272,400 | 225,850 |
8 | Qinhuangdao | China | MT | 284,600 | 276,815 | 243,850 | 252,000 | 245,964 | 204,900 | 167,500 | 150,320 |
9 | Busan | South Korea | RT | 281,513 | 262,963 | 226,182 | 241,683 | 243,564 | 217,900 | 217,200 | 219,760 |
10 | Hong Kong | China | MT | 277,444 | 267,815 | 242,967 | 259,402 | 245,433 | 238,200 | 230,139 | 220,879 |
11 | Port Hedland | Australia | MT | 246,672 | 198,997 | 178,625 | 159,391 | 130,707 | 111,800 | 110,600 | 108,500 |
12 | South Louisiana | United States | MT | 223,633 | 214,337 | 192,853 | 203,157 | 207,785 | 204,600 | 192,549 | 203,517 |
13 | Houston | United States | MT | 215,731 | 206,055 | 191,729 | 192,473 | 196,014 | 201,500 | 192,023 | 183,419 |
14 | Dalian | China | MT | 211,065 | 200,000 | 204,000 | 246,000 | 222,859 | 200,500 | 176,800 | 145,162 |
15 | Shenzhen | China | MT | 205,475 | 204,860 | 211,000 | 187,045 | 199,190 | 176,000 | 153,900 | 135,246 |
16 | Klang | Malaysia | FT | 193,726 | 168,588 | 137,615 | 152,348 | 135,514 | 122,000 | 109,700 | 99,911 |
17 | Antwerp | Belgium | MT | 187,151 | 178,167 | 157,807 | 189,390 | 182,897 | 167,400 | 160,100 | 152,300 |
18 | Nagoya | Japan | FT | 186,305 | 185,703 | 165,101 | 218,130 | 215,602 | 208,000 | 187,100 | 182,289 |
19 | Dampier | Australia | MT | 171,844 | 165,025 | N/A | 140,823 | 133,949 | 126,000 | 110,100 | 87,92 |
20 | Ulsan | South Korea | RT | 163,181 | 150,933 | 170,314 | 170,279 | 168,652 | 161,100 | 103,50 | 156,500 |
Rank | Port | Country | Measure | Tons (000s) [21] | +/- from 2004 | % change from 2004 |
---|---|---|---|---|---|---|
1 | Shanghai | China | MT | 443,000 | 64,038 | 16.90 |
2 | Singapore | Singapore | FT | 423,267 | 29,849 | 7.59 |
3 | Rotterdam | Netherlands | MT | 376,600 | 24,037 | 6.82 |
4 | Ningbo | China | MT | 272,400 | 46,550 | 20.61 |
5 | Tianjin | China | MT | 245,100 | 38,939 | 18.89 |
6 | Guangzhou | China | MT | 241,700 | 26,510 | 12.32 |
7 | Hong Kong | China | MT | 230,139 | 9,260 | 4.19 |
8 | Busan | South Korea | RT | 217,200 | -2,560 | -1.16 |
9 | South Louisiana | United States | MT | 192,549 | -10,968 | -5.39 |
10 | Houston | United States | MT | 192,023 | 8,604 | 4.69 |
11 | Nagoya | Japan | FT | 187,100 | 4,811 | 2.64 |
12 | Qingdao | China | MT | 184,300 | 22,650 | 14.01 |
13 | Gwangyang | South Korea | RT | 177,500 | 11,625 | 7.01 |
14 | Dalian | China | MT | 176,800 | 31,638 | 21.79 |
15 | Qinhuangdao | China | MT | 167,500 | 17,180 | 11.43 |
16 | Chiba | Japan | FT | 165,700 | -3,554 | -2.10 |
17 | Antwerp | Belgium | MT | 160,100 | 7,773 | 5.10 |
18 | Shenzhen | China | MT | 153,900 | 18,654 | 13.79 |
19 | New York/New Jersey | United States | MT | 138,014 | -314 | -0.23 |
20 | Kaohsiung | Taiwan | MT | 137,900 | -14,568 | -9.55 |
21 | Yokohama | Japan | FT | 133,300 | 6,340 | 4.99 |
22 | Hamburg | Germany | MT | 125,700 | 11,216 | 9.80 |
23 | Incheon | South Korea | RT | 123,500 | 10,427 | 9.22 |
24 | Novorossiysk | Russia | MT | 113,100 | 15,300 | 15.64 |
25 | Port Hedland | Australia | MT | 110,600 | 2,100 | 1.94 |
26 | Dampier | Australia | MT | 110,100 | 22,172 | 25.22 |
27 | Klang | Malaysia | FT | 109,700 | 9,789 | 9.80 |
28 | Ulsan | South Korea | RT | 103,500 | -53,017 | -33.87 |
29 | Kitakyushu | Japan | FT | 101,700 | -1,545 | -1.50 |
30 | Marseille | France | MT | 96,600 | 2,507 | 2.66 |
31 | Osaka | Japan | FT | 93,100 | -47 | -0.05 |
32 | Tubarão | Brazil | MT | 92,700 | 8,267 | 9.79 |
33 | Port of Jebel Ali | United Arab Emirates | MT | 92,500 | 15,120 | 19.54 |
34 | Tokyo | Japan | FT | 92,000 | 573 | 0.63 |
35 | Kobe | Japan | FT | 91,200 | 5,539 | 6.47 |
36 | Richards Bay | South Africa | HT | 86,600 | 1,646 | 1.94 |
37 | Itaqui | Brazil | MT | 85,900 | 8,942 | 11.62 |
38 | Newcastle | Australia | MT | 85,600 | 2,040 | 2.44 |
39 | Hay Point | Australia | MT | 81,600 | -3,959 | -4.63 |
40 | Vancouver | Canada | MT | 76,500 | 2,926 | 3.98 |
41 | Huntington | United States | MT | 76,104 | 5,924 | 8.44 |
42 | Le Havre | France | MT | 75,000 | -1,175 | -1.54 |
43 | Amsterdam | Netherlands | MT | 74,900 | 1,724 | 2.36 |
44 | Long Beach | United States | MT | 72,447 | -237 | -0.33 |
45 | Santos | Brazil | MT | 71,900 | 4,291 | 6.35 |
46 | Beaumont | United States | MT | 71,566 | -11,677 | -14.03 |
47 | Corpus Christi, Texas | United States | MT | 70,441 | -1,207 | -1.68 |
48 | Gladstone | Australia | MT | 67,200 | 4,052 | 6.42 |
49 | Sepetiba | Brazil | MT | 67,100 | ||
50 | Algeciras | Spain | MT | 63,500 | 2,206 | 3.60 |
Rank | Port | Country | Measure | Tons (000s) [22] | +/- from 2003 | % change from 2003 |
---|---|---|---|---|---|---|
1 | Singapore | Singapore | FT | 393,418 | 45,724 | 13.15 |
2 | Shanghai | China | MT | 378,962 | 62,752 | 19.85 |
3 | Rotterdam | Netherlands | MT | 352,563 | 25,605 | 7.83 |
4 | Ningbo | China | MT | 225,850 | 71,870 | 46.67 |
5 | Hong Kong | China | MT | 220,879 | 13,267 | 6.39 |
6 | Busan | South Korea | RT | 219,760 | 57,300 | 35.27 |
7 | Guangzhou | China | MT | 215,190 | 47,470 | 28.30 |
8 | Tianjin | China | MT | 206,161 | 44,341 | 27.40 |
9 | South Louisiana | United States | MT | 203,517 | 23,024 | 12.76 |
10 | Houston | United States | MT | 183,419 | 10,099 | 5.83 |
11 | Nagoya | Japan | FT | 182,289 | 13,911 | 8.26 |
12 | Chiba | Japan | FT | 169,254 | 254 | 0.15 |
13 | Gwangyang | South Korea | RT | 165,875 | 786 | 0.48 |
14 | Qingdao | China | MT | 161,650 | 20,750 | 14.73 |
15 | Ulsan | South Korea | RT | 156,517 | 9,577 | 6.52 |
16 | Kaohsiung | Republic of China | MT | 152,468 | 13,636 | 9.82 |
17 | Antwerp | Belgium | MT | 152,327 | 9,452 | 6.62 |
18 | Qinhuangdao | China | MT | 150,320 | 24,700 | 19.66 |
19 | Dalian | China | MT | 145,162 | 19,142 | 15.19 |
20 | New York/New Jersey | United States | MT | 138,328 | 5,890 | 4.45 |
21 | Shenzhen | China | MT | 135,246 | 47,576 | 54.27 |
22 | Yokohama | Japan | FT | 126,960 | 1,017 | 0.81 |
23 | Hamburg | Germany | MT | 114,484 | 7,948 | 7.46 |
24 | Incheon | South Korea | RT | 113,073 | -17,945 | -13.70 |
25 | Port Hedland | Australia | MT | 108,500 | 18,701 | 20.83 |
26 | Kitakyushu | Japan | FT | 103,245 | 14,355 | 16.15 |
27 | Klang | Malaysia | FT | 99,911 | 11,023 | 12.40 |
28 | Novorossiysk | Russia | MT | 97,800 | 12,300 | 14.32 |
29 | Marseille | France | MT | 94,093 | -1,452 | -1.52 |
30 | Osaka | Japan | FT | 93,147 | 3,460 | 3.86 |
31 | Tokyo | Japan | FT | 91,427 | 2,952 | 3.34 |
32 | Dampier | Australia | MT | 87,928 | -952 | -1.07 |
33 | Kobe | Japan | FT | 85,661 | 6,902 | 8.76 |
34 | Hay Point | Australia | MT | 85,559 | 8,013 | 10.33 |
35 | Richards Bay | South Africa | HT | 84,954 | -2,567 | -2.93 |
36 | Tubarão | Brazil | MT | 84,433 | 6,812 | 8.78 |
37 | Newcastle | Australia | MT | 83,560 | 848 | 1.03 |
38 | Beaumont | United States | MT | 83,243 | 3,773 | 4.75 |
39 | Port of Jebel Ali | United Arab Emirates | MT | 77,380 | 13,754 | 21.62 |
40 | Itaqui | Brazil | MT | 76,958 | 9,367 | 13.86 |
41 | Le Havre | France | MT | 76,175 | 4,682 | 6.55 |
42 | Vancouver | Canada | MT | 73,574 | 6,847 | 10.26 |
43 | Amsterdam | Netherlands | MT | 73,176 | 7,715 | 11.79 |
44 | Long Beach | United States | MT | 72,684 | 9,868 | 15.71 |
45 | Corpus Christi, Texas | United States | MT | 71,648 | 1,543 | 2.20 |
46 | New Orleans | United States | MT | 70,886 | -5,230 | -6.87 |
47 | Huntington | United States | MT | 70,180 | -303 | -0.43 |
48 | Santos | Brazil | MT | 67,609 | 7,532 | 12.54 |
49 | Gladstone | Australia | MT | 63,148 | 3,487 | 5.84 |
50 | Texas City | United States | MT | 61,987 |
Rank | Port | Country | Measure | Tons (000s) | +/- from 2002 | % change from 2002 |
---|---|---|---|---|---|---|
1 | Singapore | Singapore | FT | 347,694 | 12,538 | 3.74 |
2 | Rotterdam | Netherlands | MT | 326,958 | 5,107 | 1.59 |
3 | Shanghai | China | MT | 316,210 | 77,604 | 32.52 |
4 | Hong Kong | China | MT | 207,612 | 15,102 | 7.84 |
5 | South Louisiana | United States | MT | 180,493 | -15,952 | -8.12 |
6 | Houston | United States | MT | 173,320 | 12,130 | 7.52 |
7 | Chiba | Japan | FT | 169,000 | 10,071 | 6.34 |
8 | Nagoya | Japan | FT | 168,378 | 10,358 | 6.55 |
9 | Guangzhou | China | MT | 167,720 | 27,325 | 19.46 |
10 | Gwangyang | South Korea | RT | 165,089 | 11,642 | 7.59 |
11 | Busan | South Korea | RT | 162,460 | 18,688 | 13.00 |
12 | Tianjin | China | MT | 161,820 | 32,820 | 25.44 |
13 | Ningbo | China | MT | 153,980 | 3,980 | 2.65 |
14 | Ulsan | South Korea | RT | 146,940 | -1,472 | -0.99 |
15 | Antwerp | Belgium | MT | 142,875 | 11,246 | 8.54 |
16 | Qingdao | China | MT | 140,900 | 20,900 | 17.42 |
17 | Kaohsiung | Republic of China | MT | 138,832 | 9,418 | 7.28 |
18 | New York/New Jersey | United States | MT | 132,438 | 10,335 | 8.46 |
19 | Incheon | South Korea | RT | 131,018 | -15,163 | -10.37 |
20 | Dalian | China | MT | 126,020 | 18,482 | 17.19 |
21 | Yokohama | Japan | FT | 125,943 | 7,871 | 6.67 |
22 | Qinhuangdao | China | MT | 125,620 | 4,468 | 3.69 |
23 | Hamburg | Germany | MT | 106,536 | 8,264 | 8.41 |
24 | Marseille | France | MT | 95,545 | 3,284 | 3.56 |
25 | Port Hedland | Australia | MT | 89,799 | 8,041 | 9.84 |
26 | Osaka | Japan | FT | 89,687 | 3,188 | 3.69 |
27 | Kitakyushu | Japan | FT | 88,890 | 4,641 | 5.51 |
28 | Klang | Malaysia | FT | 88,888 | 6,617 | 8.04 |
29 | Dampier | Australia | MT | 88,880 | -3,348 | -3.63 |
30 | Tokyo | Japan | FT | 88,475 | 5,530 | 6.67 |
31 | Shenzhen | China | MT | 87,670 | 11,788 | 15.53 |
32 | Richards Bay | South Africa | HT | 87,521 | 6,012 | 7.38 |
33 | Novorossiysk | Russia | MT | 85,500 | 22,209 | 35.09 |
34 | Newcastle | Australia | MT | 82,712 | 5,825 | 7.58 |
35 | Beaumont | United States | MT | 79,470 | 1,480 | 1.90 |
36 | Kobe | Japan | FT | 78,759 | 158 | 0.20 |
37 | Tubarão | Brazil | MT | 77,621 | 1,756 | 2.31 |
38 | Hay Point | Australia | MT | 77,546 | 2,874 | 3.85 |
39 | New Orleans | United States | MT | 76,116 | -1,047 | -1.36 |
40 | Le Havre | France | MT | 71,493 | 3,795 | 5.61 |
41 | Huntington | United States | MT | 70,483 | -3,107 | -4.22 |
42 | Corpus Christi, Texas | United States | MT | 70,105 | 4,743 | 7.26 |
43 | Itaqui | Brazil | MT | 67,591 | 2,649 | 4.08 |
44 | Vancouver | Canada | MT | 66,727 | 3,926 | 6.25 |
45 | Amsterdam | Netherlands | MT | 65,461 | -4,956 | -7.04 |
46 | Port of Jebel Ali | United Arab Emirates | MT | 63,626 | ||
47 | Long Beach | United States | MT | 62,816 | 1,201 | 1.95 |
48 | Santos | Brazil | MT | 60,077 | 6,603 | 12.35 |
49 | Gladstone | Australia | MT | 59,661 | 5,195 | 9.54 |
50 | Algeciras | Spain | MT | 56,682 |
The economy of Greece is the 54th largest in the world, with a nominal gross domestic product (GDP) of $250.276 billion per annum. In terms of purchasing power parity, Greece is the world's 55th largest economy, at $430.125 billion per annum. As of 2023, Greece is the sixteenth largest economy in the European Union and eleventh largest in the eurozone. According to the International Monetary Fund's figures for 2024, Greece's GDP per capita is $23,966 at nominal value and $41,188 at purchasing power parity.
The Netherlands is both a very densely populated and a highly developed country in which transport is a key factor of the economy. Correspondingly it has a very dense and modern infrastructure, facilitating transport with road, rail, air and water networks. In its Global Competitiveness Report for 2014-2015, the World Economic Forum ranked the Dutch transport infrastructure fourth in the world.
Ton is any of several units of measure of mass, volume or force. It has a long history and has acquired several meanings and uses.
A port is a maritime facility comprising one or more wharves or loading areas, where ships load and discharge cargo and passengers. Although usually situated on a sea coast or estuary, ports can also be found far inland, such as Hamburg, Manchester and Duluth; these access the sea via rivers or canals. Because of their roles as ports of entry for immigrants as well as soldiers in wartime, many port cities have experienced dramatic multi-ethnic and multicultural changes throughout their histories.
A container ship is a cargo ship that carries all of its load in truck-size intermodal containers, in a technique called containerization. Container ships are a common means of commercial intermodal freight transport and now carry most seagoing non-bulk cargo.
A passenger ship is a merchant ship whose primary function is to carry passengers on the sea. The category does not include cargo vessels which have accommodations for limited numbers of passengers, such as the ubiquitous twelve-passenger freighters once common on the seas in which the transport of passengers is secondary to the carriage of freight. The type does however include many classes of ships designed to transport substantial numbers of passengers as well as freight. Indeed, until recently virtually all ocean liners were able to transport mail, package freight and express, and other cargo in addition to passenger luggage, and were equipped with cargo holds and derricks, kingposts, or other cargo-handling gear for that purpose. Only in more recent ocean liners and in virtually all cruise ships has this cargo capacity been eliminated.
Kamarajar Port Limited, formerly Ennore Port, is located on the Coromandel Coast, Chennai about 18 km north of Chennai Port. It is the 12th major port of India, and the first port in India which is a public company. The Kamarajar Port Limited is the only corporatised major port and is registered as a company. Chennai Port Trust acquired around 67% stake of Centre in the Kamarajar Port Limited on 27 March 2020. The remaining 23 percent was already held by the Chennai Port Trust.
Gross register tonnage, or gross registered tonnage, is a ship's total internal volume expressed in "register tons", each of which is equal to 100 cubic feet (2.83 m3). Replaced by Gross Tonnage (GT), gross register tonnage uses the total permanently enclosed capacity of the vessel as its basis for volume. Typically this is used for dockage fees, canal transit fees, and similar purposes where it is appropriate to charge based on the size of the entire vessel. Internationally, GRT may be abbreviated as BRT for the German "Bruttoregistertonne".
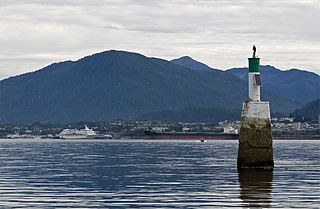
The Port of Prince Rupert is a seaport managed by the Prince Rupert Port Authority that occupies 667,731 hectares of land and water along 20 kilometres of waterfront. The port is located in Prince Rupert Harbour in the North Coast Regional District of British Columbia.
The Port of Beaumont is a deep-water port located in Beaumont, Texas near the mouth of the Neches River.
The Port of Vancouver was a port located in and round Vancouver. It was the largest port in Canada, the largest in the Pacific Northwest, and the largest port on the West Coast of North America by metric tons of total cargo, with 76.5 million metric tons. The port amalgamated with the Fraser River Port Authority and the North Fraser Port Authority in 2008 to form Port Metro Vancouver, which has now adopted the Port of Vancouver name.
The Port of Richmond is a major shipping terminal in California's San Francisco Bay located in the East Bay city and Oakland suburb of Richmond.
A merchant navy or merchant marine is the fleet of merchant vessels that are registered in a specific country. On merchant vessels, seafarers of various ranks and sometimes members of maritime trade unions are required by the International Convention on Standards of Training, Certification and Watchkeeping for Seafarers (STCW) to carry Merchant Mariner's Documents.
The Port of Ningbo-Zhoushan is the busiest port in the world in terms of cargo tonnage. It handled 888.96 million tons of cargo in 2015. The port is located in Ningbo and Zhoushan, on the coast of the East China Sea, in Zhejiang province on the southeast end of Hangzhou Bay, across which it faces the municipality of Shanghai.
This is a list of key international rankings of Costa Rica
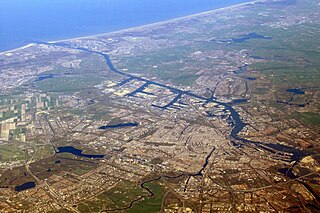
The port of Amsterdam is an inland seaport in Amsterdam in North Holland, Netherlands. It is the 4th busiest port in Europe by total cargo tonnage. The port is located on the bank of a former bay named the IJ and the North Sea Canal, with which it is connected to the North Sea. The port was first used in the 13th century and was one of the main ports of the Dutch East India Company in the 17th century. Today, the port of Amsterdam is the second largest port in the Netherlands, the largest being the Port of Rotterdam. In 2014, the port of Amsterdam had a cargo throughput of 97.4 million tons, most of which was bulk cargo.
The Barbours Cut Container Terminal, or simply the Barbours Cut Terminal, is a major deep water port in the Greater Houston area in the U.S. state of Texas. It is part of one of the world's busiest ports by cargo tonnage.
Valemax ships are a fleet of very large ore carriers (VLOC) owned or chartered by the Brazilian mining company Vale S.A. to carry iron ore from Brazil to European and Asian ports. With a capacity ranging from 380,000 to 400,000 tons deadweight, the vessels meet the Chinamax standard of ship measurements for limits on draft and beam. Valemax ships are the largest bulk carriers ever constructed, when measuring deadweight tonnage or length overall, and are amongst the longest ships of any type currently in service.
The University Ranking by Academic Performance (URAP) is a university ranking developed by the Informatics Institute of Middle East Technical University. Since 2010, it has been publishing annual national and global college and university rankings for top 2000 institutions. The scientometrics measurement of URAP is based on data obtained from the Institute for Scientific Information via Web of Science and inCites. For global rankings, URAP employs indicators of research performance including the number of articles, citation, total documents, article impact total, citation impact total, and international collaboration. In addition to global rankings, URAP publishes regional rankings for universities in Turkey using additional indicators such as the number of students and faculty members obtained from Center of Measuring, Selection and Placement ÖSYM.