As of 2025, the United States has over 900 skyscrapers, defined as buildings taller than 492 feet (150 m), across at least 50 cities. [1] It has the second highest number of skyscrapers out of any country, after China. [2] For most of the 20th century, the largest skylines in the United States were also the largest in the world; currently, the country has five of the 60 cities with the most skyscrapers. The only two cities in the United States with more than 100 skyscrapers are New York City and Chicago. There are three cities with over 30 skyscrapers, that being Miami, Houston, and Los Angeles. Boston, Dallas, San Francisco, and Seattle each have between 20 and 30 skyscrapers.
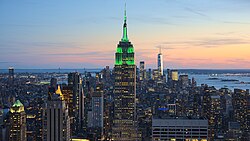
With the development of the earliest skyscrapers in the late 19th century, New York City and Chicago emerged as the two cities with the largest volume of high-rises in the country. They have continued to maintain that status until the present day. New York City is the city with the most skyscrapers, having over 320, more than twice as many as Chicago. It has the third-most skyscrapers in the world, after Hong Kong and Shenzhen. New York City makes up approximately one third of all buildings taller than 492 ft (150 m) in the United States. Chicago, with 137 skyscrapers, has the second-largest skyline in the country. Together, New York City and Chicago comprise about half of all skyscrapers in the country.
As more skyscrapers were built across the United States, the size of a city's skyline often reflected the city's relative importance. Large cities in the Northeast and the Midwest saw a construction boom during the Roaring Twenties, mainly from the mid-1920s to early 1930s. In addition to New York City and Chicago, high-rise construction hotspots in the early 20th century included Boston, Detroit, Philadelphia, and Pittsburgh, which were all in the ten largest cities by population during the 1920s. The Great Depression severely halted skyscraper development across much of the country from the 1930s to mid-1950s. When constructing new skyscrapers became feasible again, cities that underwent major construction booms included many in the Southern and Western United States, particularly Atlanta, Dallas, Houston, and Los Angeles. However, despite Los Angeles surpassing Chicago in population in 1982, [3] its skyline remains comfortably smaller than Chicago's today.
Construction slowed down again in the early 1990s, and resumed in major cities during the 2000s. The Great Recession dampened the construction of new skyscrapers for several years following its onset in 2008. New York City maintained its dominant position, entering an unprecedented skyscraper boom in the mid-2010s. Whereas skyscrapers were previously built mostly for office space in the 20th century, their development has shifted to being mainly for residential and mixed-use purposes. This has led to a dramatic growth in the number of tall buildings in a number of cities, most notably Austin, Nashville, and Miami. In particular, Miami's skyline grew rapidly from residential condominiums in the 2000s, and later from the 2010s onwards, becoming the city with the third-largest skyline in the United States. The 21st century has also seen the emergence of skylines in suburban cities, such as that of Bellevue, Jersey City, and Sunny Isles Beach, as well as multiple skyscraper clusters outside of Manhattan in New York City, including Downtown Brooklyn and Long Island City.
The ranking of the cities with the most skyscrapers depends on the height used for the definition of a skyscraper, as some cities may have more buildings above a certain height than another city, but fewer buildings when another height is chosen. In particular, cities like Honolulu and San Diego have many high-rise buildings between 300 and 500 ft (91 and 152 m) tall, but very few buildings beyond 500 ft. Thus, they benefit from a lower height cutoff for a skyscraper.
The United States uses U.S. customary units as its predominant system of measurement. Many Americans prefer to use a round number in feet as a cutoff point. This table ranks cities and unincorporated areas in the United States by the number of completed buildings taller than 300 feet (91.4 m) within city limits, as of October 2025. It includes every city in the United States with at least 10 buildings taller than that height. Figures in 400 feet (122 m), 500 feet (152 m), and 600 feet (183 ft) are provided as well. If two or more cities have the same number of 300-foot buildings, they are then ranked by the number of 400 ft buildings.
Numbers that are uncited are directly supported by the infobox or tables in the linked article. 500 feet (152 m) is close to 492 feet (150 m), a height commonly used for the definition of a skyscraper, including by the Council of Tall Buildings and Urban Habitat and on the list of cities with the most skyscrapers.
| Rank | City | State | Image | Number of buildings | |||
|---|---|---|---|---|---|---|---|
| ≥300 ft (91 m) | ≥400 ft (122 m) | ≥500 ft (152 m) | ≥600 ft (183 m) | ||||
| 1 | New York City | | 1,065 [4] [i] | 561 [4] [i] | 300 [4] | 150 [4] | |
| 2 | Chicago | | 409 [5] [i] | 237 [5] [i] | 127 | 57 | |
| 3 | Miami | | 162 [6] [i] | 111 [6] [i] | 68 | 23 | |
| 4 | Houston | | 151 | 70 | 39 | 20 | |
| 5 | San Francisco | | 124 | 61 | 24 | 11 | |
| 6 | Los Angeles | | 107 | 52 | 31 | 17 | |
| 7 | Atlanta | | 104 | 43 | 17 | 11 | |
| 8 | Honolulu | | 98 [7] [ii] | 24 [7] [ii] | 0 | 0 | |
| 9 | Philadelphia | | 86 | 34 | 16 | 9 | |
| 10 | Dallas | | 85 | 33 | 20 | 11 | |
| 11 | Seattle | | 84 [8] [i] | 53 | 21 | 8 | |
| 12 | Boston | | 73 | 40 | 23 | 10 | |
| 13 | Austin | | 64 | 30 | 16 | 7 | |
| 14 | Las Vegas [iii] | | 58 [9] [i] | 41 [9] [i] | 16 | 9 | |
| 15 | Jersey City | | 58 | 32 | 18 | 6 | |
| 16 | Denver | | 49 | 19 | 8 | 5 | |
| 17 | San Diego | | 48 | 23 | 1 | 0 | |
| 18 | Minneapolis | | 41 | 22 | 10 | 4 | |
| 19 | Charlotte | | 40 | 17 | 8 | 5 | |
| 20 | Nashville | | 39 | 16 | 4 | 1 | |
| 21 | Detroit | | 39 | 15 | 8 | 3 | |
| 22 | Sunny Isles Beach | | 35 | 27 | 17 | 9 | |
| 23 | Pittsburgh | | 34 | 17 | 10 | 5 | |
| 24 | Baltimore | | 33 | 8 | 3 | 0 | |
| 25 | New Orleans | | 26 | 12 | 4 | 2 | |
| 26 | Aventura | | 23 [10] [i] | 2 [10] | 0 | 0 | |
| 27 | Phoenix | | 23 | 2 | 0 | 0 | |
| 28 | Cleveland | | 22 | 11 | 5 | 3 | |
| 29 | Portland | | 19 | 6 | 4 | 0 | |
| 30 | Miami Beach | | 18 | 11 | 3 | 0 | |
| 31 | Columbus | | 18 | 10 | 5 | 1 | |
| 32 | Tampa | | 18 | 7 | 4 | 0 | |
| 33 | Bellevue | | 17 | 8 | 2 | 2 | |
| 34 | Cincinnati | | 17 | 7 | 2 | 1 | |
| 35 | Atlantic City | | 16 | 6 | 2 | 1 | |
| 36 | Milwaukee | | 16 | 7 | 4 | 1 | |
| 37 | Salt Lake City | | 16 | 3 | 0 | 0 | |
| 38 | Oakland | | 16 | 2 | 0 | 0 | |
| 39 | Kansas City | | 15 | 9 | 3 | 1 | |
| 40 | Fort Lauderdale | | 15 | 7 | 0 | 0 | |
| 41 | St. Louis | | 15 | 5 | 3 | 0 | |
| 42 | San Antonio | | 15 | 5 | 1 | 0 | |
| 43 | Saint Paul | | 15 | 3 | 0 | 0 | |
| 44 | Newark | | 13 | 2 | 0 | 0 | |
| 45 | Indianapolis | | 12 | 6 | 3 | 1 | |
| 46 | Orlando | | 12 | 5 | 0 | 0 | |
| 47 | St. Petersburg | | 12 | 4 | 1 | 0 | |
| 48 | Sacramento | | 12 | 2 | 0 | 0 | |
| 49 | Tulsa | | 11 | 6 | 4 | 2 | |
| 50 | Fort Worth | | 11 | 6 | 3 | 0 | |
| 51 | Richmond | | 10 | 3 | 0 | 0 | |
| 52 | Rosslyn | | 10 | 0 | 0 | 0 | |
The number of skyscrapers may also be measured using the metric system. This allows for easier comparison between American cities and cities outside of the United States. This table includes every city and unincorporated territory in the United States by the number of completed buildings taller than 150 meters (492 ft) as of October 2025,. This height is commonly used for the definition of a skyscraper, including by the Council of Tall Buildings and Urban Habitat and on the list of cities with the most skyscrapers. It includes every city with at least one skyscraper taller than 150 m (492 ft). Figures for 100 m (328 ft), 200 m (656 ft), and 300 m (984 ft) buildings are provided as well.
Numbers that are uncited are directly supported by the infobox or tables in the linked article. If two or more cities have the same number of 150 m (492 ft) buildings, they are then ranked by the number of 100 m (328 ft) buildings. The 150 m column is highlighted blue for visibility.
| Rank | City | State | Image | Number of buildings | |||
|---|---|---|---|---|---|---|---|
| ≥100 m (328 ft) | ≥150 m (492 ft) | ≥200 m (656 ft) | ≥300 m (984 ft) | ||||
| 1 | New York City | | 879 [4] [i] | 323 [11] | 101 | 18 | |
| 2 | Chicago | | 353 [5] [i] | 137 | 38 | 7 | |
| 3 | Miami | | 147 [6] [i] | 68 | 9 | 0 | |
| 4 | Houston | | 115 | 40 | 16 | 2 | |
| 5 | Los Angeles | | 88 | 32 | 13 | 2 | |
| 6 | San Francisco | | 100 | 27 | 5 | 1 | |
| 7 | Boston | | 59 | 26 | 6 | 0 | |
| 8 | Seattle | | 75 [12] [i] | 22 | 5 | 0 | |
| 9 | Dallas | | 58 | 20 | 6 | 0 | |
| 10 | Philadelphia | | 65 | 18 | 7 | 1 | |
| 11 | Jersey City | | 47 | 18 | 4 | 0 | |
| 12 | Atlanta | | 87 | 17 | 10 | 1 | |
| 13 | Austin | | 51 | 17 | 5 | 0 | |
| 14 | Sunny Isles Beach | | 30 | 17 | 2 | 0 | |
| 15 | Las Vegas [iii] | | 55 [13] [i] | 16 | 2 | 0 | |
| 16 | Minneapolis | | 31 | 11 | 4 | 0 | |
| 17 | Pittsburgh | | 27 | 10 | 2 | 0 | |
| 18 | Detroit | | 28 | 9 | 2 | 0 | |
| 19 | Denver | | 41 | 8 | 3 | 0 | |
| 20 | Charlotte | | 29 | 8 | 3 | 0 | |
| 21 | Cleveland | | 19 | 5 | 3 | 0 | |
| 22 | Columbus | | 15 | 5 | 0 | 0 | |
| 23 | Nashville | | 30 | 4 | 0 | 0 | |
| 24 | Baltimore | | 25 | 4 | 0 | 0 | |
| 25 | New Orleans | | 23 | 4 | 1 | 0 | |
| 26 | Milwaukee | | 14 | 4 | 0 | 0 | |
| 27 | Tampa | | 11 | 4 | 0 | 0 | |
| 28 | Portland | | 10 | 4 | 0 | 0 | |
| 29 | Tulsa | | 10 | 4 | 0 | 0 | |
| 30 | San Diego | | 41 | 3 | 0 | 0 | |
| 31 | Miami Beach | | 18 | 3 | 0 | 0 | |
| 32 | Cincinnati | | 12 | 3 | 1 | 0 | |
| 33 | St. Louis | | 12 | 3 | 0 | 0 | |
| 34 | Indianapolis | | 9 | 3 | 1 | 0 | |
| 35 | Fort Worth | | 8 | 3 | 0 | 0 | |
| 36 | Hartford | | 7 | 3 | 0 | 0 | |
| 37 | Atlantic City | | 14 | 2 | 1 | 0 | |
| 38 | Kansas City | | 14 | 2 | 0 | 0 | |
| 39 | Fort Lauderdale | | 11 | 2 | 0 | 0 | |
| 40 | Louisville | | 11 | 2 | 0 | 0 | |
| 41 | Bellevue | | 11 | 2 | 0 | 0 | |
| 42 | Oklahoma City | | 7 | 2 | 1 | 0 | |
| 43 | Jacksonville | | 7 | 2 | 0 | 0 | |
| 44 | Fort Lee | | 6 | 2 | 0 | 0 | |
| 45 | Sandy Springs | | 3 | 2 | 0 | 0 | |
| 46 | San Antonio | | 11 | 1 | 0 | 0 | |
| 47 | St. Petersburg | | 10 | 1 | 0 | 0 | |
| 48 | Buffalo | | 5 | 1 | 0 | 0 | |
| 49 | Des Moines | | 5 | 1 | 0 | 0 | |
| 50 | Little Rock | | 5 [14] | 1 | 0 | 0 | |
| 51 | Raleigh | | 5 | 1 | 0 | 0 | |
| 52 | Hallandale Beach | | 4 [15] | 1 | 0 | 0 | |
| 53 | Mobile | | 3 | 1 | 0 | 0 | |
| 54 | Omaha | | 3 | 1 | 0 | 0 | |
| 55 | Albany | | 2 | 1 | 0 | 0 | |
| 56 | Virginia Beach | | 2 | 1 | 0 | 0 | |
City boundaries may exclude buildings in the same metropolitan area from being included in its list of skyscrapers. This table ranks metropolitan statistical areas (MSAs) in the United States by the amount of 300 foot (91 m) buildings. The "city" column includes every city in a metropolitan area with at least one 300-foot building. The final column shows the number of such buildings in a metropolitan area for every million inhabitants.
| Rank | Metropolitan area | State | Image | City (300 ft buildings) | Total | Population (2024) [16] | 300 ft buildings per million [iv] |
|---|---|---|---|---|---|---|---|
| 1 | New York City | | New York City (1,065) Jersey City (58) Newark (13) Fort Lee (7) White Plains (5) [17] Guttenberg (3) [18] New Rochelle (3) [19] Cliffside Park (2) [20] North Bergen (1) [21] West New York (1) [22] | 1,158 | 19,940,274 | 58.1 | |
| 2 | Chicago | | Chicago (409) Itasca (1) [23] Oakbrook Terrace (1) [24] | 411 | 9,408,576 | 43.7 | |
| 3 | Miami | | Miami (162) Sunny Isles Beach (35) Aventura (23) Miami Beach (18) Fort Lauderdale (15) Hollywood (7) [25] [26] Hallandale Beach (6) [27] Bal Harbour (4) [28] West Palm Beach (4) [29] Kendall (2) [30] North Miami Beach (2) [31] Boca Raton (1) [32] Coral Gables (1) [33] Riviera Beach (1) [34] [35] | 281 | 6,457,988 | 43.5 | |
| 4 | Houston | | Houston (151) Galveston (3) The Woodlands (2) Pasadena (1) | 157 | 7,796,182 | 20.1 | |
| 5 | San Francisco | | San Francisco (124) Oakland (16) | 140 | 4,648,486 | 30.1 | |
| 6 | Los Angeles | | Los Angeles (107) Long Beach (4) El Segundo (2) Irvine (2) Burbank (1) Glendale (1) Santa Monica (1) West Hollywood (1) | 119 | 12,927,614 | 9.2 | |
| 7 | Atlanta | | Atlanta (104) Dunwoody (4) Sandy Springs (3) Vinings (2) Brookhaven (1) | 114 | 6,411,149 | 17.8 | |
| 8 | Dallas-Fort Worth | | Dallas (85) Fort Worth (11) Irving (3) [36] Plano (3) [37] | 102 | 8,344,032 | 12.2 | |
| 9 | Seattle | | Seattle (84) Bellevue (16) Tacoma (1) | 101 | 4,145,494 | 24.4 | |
| 10 | Honolulu | | Honolulu (98) Pearl City (2) [38] | 100 | 998,747 | 100.1 | |
| 11 | Philadelphia | | Philadelphia (86) Camden (1) Wilmington (1) | 88 | 6,330,422 | 13.9 | |
| 12 | Boston | | Boston (73) Cambridge (1) Everett (1) | 75 | 5,025,517 | 14.9 | |
| 13 | Austin | | Austin (64) | 64 | 2,550,637 | 25.1 | |
| 14 | Las Vegas | | Las Vegas (58) [iii] | 58 | 2,398,871 | 24.2 | |
| 15 | Minneapoils–Saint Paul | | Minneapolis (41) Saint Paul (15) Bloomington (2) | 58 | 3,757,952 | 15.4 | |
| 16 | Denver | | Denver (49) Glendale (1) [39] | 50 | 3,052,498 | 16.4 | |
| 17 | San Diego | | San Diego (48) | 48 | 3,298,799 | 14.6 | |
| 18 | Detroit | | Detroit (39) Southfield (5) Troy (1) | 45 | 4,400,578 | 10.2 | |
| 19 | Charlotte | | Charlotte (40) | 40 | 2,883,370 | 13.9 | |
| 20 | Nashville | | Nashville (40) | 39 | 2,150,553 | 18.1 | |
| 21 | Baltimore | | Baltimore (33) Towson (1) | 34 | 2,859,024 | 11.9 | |
| 22 | Pittsburgh | | Pittsburgh (34) | 34 | 2,429,917 | 14.0 | |
| 23 | Washington D.C. | | Rosslyn (10) Tysons (8) Bethesda (3) Washington D.C. (3) Alexandria (2) Crystal City (2) Pentagon City (2) Bailey's Crossroads (1) Reston (1) | 32 | 6,436,489 | 5.0 | |
| 24 | Tampa | | Tampa (18) St. Petersburg (12) | 30 | 3,424,560 | 8.8 | |
| 25 | New Orleans | | New Orleans (26) Metairie (1) | 27 | 966,230 | 27.9 | |
| 26 | Phoenix | | Phoenix (23) Tempe (1) | 24 | 5,186,958 | 4.6 | |
| 27 | Cleveland | | Cleveland (22) | 22 | 2,171,877 | 10.1 | |
| 28 | St. Louis | | St. Louis (15) Clayton (5) [40] | 20 | 2,811,927 | 7.1 | |
| 29 | Portland | | Portland (19) | 19 | 2,537,904 | 7.5 | |
| 30 | Columbus | | Columbus (18) | 18 | 2,225,377 | 8.1 | |
| 31 | Cincinnati | | Cincinnati (17) | 17 | 2,302,815 | 7.4 | |
| 32 | Atlantic City | | Atlantic City (16) | 16 | 372,989 | 42.9 | |
| 33 | Milwaukee | | Milwaukee (16) | 16 | 1,574,452 | 10.2 | |
| 34 | Salt Lake City | | Salt Lake City (16) | 16 | 1,300,762 | 12.3 | |
| 35 | Kansas City | | Kansas City (15) | 15 | 2,253,579 | 6.7 | |
| 36 | San Antonio | | San Antonio (15) | 15 | 2,763,006 | 5.4 | |
| 37 | Indianapolis | | Indianapolis (12) | 12 | 2,174,833 | 5.5 | |
| 38 | Orlando | | Orlando (12) | 12 | 2,940,513 | 4.1 | |
| 39 | Sacramento | | Sacramento (12) | 12 | 2,463,127 | 4.9 | |
| 40 | Tulsa | | Tulsa (11) | 11 | 1,059,803 | 10.4 | |
| 41 | Richmond | | Richmond (10) | 10 | 1,370,165 | 7.3 |