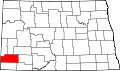
The vote to create Slope County, by partitioning the lower portion of Billings, was held on November 3, 1914. This was the final (as of 2019) alteration to that once-large Dakota county, as Bowman had been partitioned off in 1883, and Golden Valley was split off in 1910. The unorganized Slope County was not attached to another county for administrative or judicial purposes during the interregnum; on January 14, 1915, the county organization was effected.[4][5][6] The name refers to the Missouri Slope, a geographical feature that is also a popular designation for western North Dakota, particularly the area west of the Missouri River.
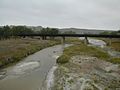
Slope County lies on the lower west side of North Dakota. Its west boundary line abuts the east boundary line of the state of Montana. The Little Missouri River enters the county's south boundary line from Bowman County near the Montana border and flows north until it loops very briefly into Golden Valley County. Then it flows east to near the midpoint of the north boundary of Slope County and then turns north into Billings County. Cedar Creek drains the southeastern portion of the county, flowing south into Bowman County.
The terrain slopes to the east and south; its highest area (except for isolated prominences, such as White Butte) is its northwestern corner, at 3,104ft (946m) ASL.[7]
According to the United States Census Bureau, the county has a total area of 1,219.504 square miles (3,158.50km2), of which 1,215.264 square miles (3,147.52km2) is land and 4.240 square miles (10.98km2) (0.35%) is water.[8] It is the 25th largest county in North Dakota by total area.[9]
White Butte, the highest natural point in North Dakota at an elevation of 3,506ft (1,069m), is in southeast Slope County.
U.S. Decennial Census[11] 1790–1960[12] 1900–1990[13] 1990–2000[14] 2010–2020[2]
As of the fourth quarter of 2024, the median home value in Slope County was $128,524.[15]
As of the 2023 American Community Survey, there are 340 estimated households in Slope County with an average of 2.34 persons per household. The county has a median household income of $62,500. Approximately 14.3% of the county's population lives at or below the poverty line. Slope County has an estimated 62.4% employment rate, with 22.8% of the population holding a bachelor's degree or higher and 91.3% holding a high school diploma.[2]
The top five reported ancestries (people were allowed to report up to two ancestries, thus the figures will generally add to more than 100%) were English (97.8%), Spanish (1.0%), Indo-European (0.0%), Asian and Pacific Islander (0.0%), and Other (1.2%).
The median age in the county was 54.2 years.
Slope County, North Dakota – racial and ethnic composition Note: the US Census treats Hispanic/Latino as an ethnic category. This table excludes Latinos from the racial categories and assigns them to a separate category. Hispanics/Latinos may be of any race.
As of the 2024 estimate, there were 660 people and 340 households residing in the county. The population density was 0.54 inhabitants per square mile (0.2/km2). There were 410 housing units at an average density of 0.34 per square mile (0.1/km2). The racial makeup of the county was 95.1% White (95.0% NH White), 1.0% African American, 3.0% Native American, 0.0% Asian, 0.0% Pacific Islander, _% from some other races and 0.9% from two or more races. Hispanic or Latino people of any race were 0.4% of the population.[21]
2020 census
As of the 2020 census, the county had a population of 706, with 303 households and 209 families residing in the county.[22]
Of the residents, 21.5% were under the age of 18 and 23.9% were 65 years of age or older; the median age was 45.2 years. For every 100 females there were 105.2 males, and for every 100 females age 18 and over there were 110.6 males.[23]
The population density was 0.36 inhabitants per square mile (0.1/km2). There were 409 housing units at an average density of 0.34 per square mile (0.1/km2), of which 25.9% were vacant; 82.8% of the occupied units were owner-occupied and 17.2% were renter-occupied. The homeowner vacancy rate was 0.7% and the rental vacancy rate was 5.5%.[23]
Of the 303 households, 26.4% had children under the age of 18 living with them and 14.9% had a female householder with no spouse or partner present. About 29.7% of all households were made up of individuals and 12.9% had someone living alone who was 65 years of age or older.[23]
2010 census
As of the 2010 census, there were 727 people, 326 households, and 224 families residing in the county. The population density was 0.60 inhabitants per square mile (0.2/km2). There were 436 housing units at an average density of 0.36 per square mile (0.1/km2). The racial makeup of the county was 97.52% White, 0.00% African American, 2.20% Native American, 0.00% Asian, 0.00% Pacific Islander, 0.00% from some other races and 0.28% from two or more races. Hispanic or Latino people of any race were 1.65% of the population.
There were 326 households, 22.4% had children under the age of 18 living with them, 60.7% were married couples living together, 4.9% had a female householder with no husband present, 31.3% were non-families, and 29.4% of all households were made up of individuals. The average household size was 2.23 and the average family size was 2.74. The median age was 49.2 years.
The median income for a household in the county was $43,625 and the median income for a family was $55,833. Males had a median income of $36,458 versus $31,172 for females. The per capita income for the county was $24,824. About 6.8% of families and 10.5% of the population were below the poverty line, including 9.3% of those under age 18 and 11.7% of those age 65 or over.
Slope County has the highest decline from its peak population of all US counties.
Slope County voters have traditionally voted Republican. In no national election since 1964 has the county selected the Democratic Party candidate (as of 2024). In 2024 Donald Trump received 90% of the vote in Slope County.
United States presidential election results for Slope County, North Dakota[25]
↑"State Board of Public School Education Minutes of Meeting"(PDF). State of North Dakota. July 15, 2019. Archived(PDF) from the original on October 18, 2020. Retrieved August 13, 2021. This dissolution would not take effect until July 1, 2020 so there is time to review this information.
This page is based on this Wikipedia article Text is available under the CC BY-SA 4.0 license; additional terms may apply. Images, videos and audio are available under their respective licenses.