Solar power in Indiana

Last updated
US annual average solar energy received by a latitude tilt photovoltaic cell (modeled). Us pv annual may2004.jpg
US annual average solar energy received by a latitude tilt photovoltaic cell (modeled).

Solar power in Indiana has been growing in recent years due to new technological improvements and a variety of regulatory actions and financial incentives, particularly a 30% federal tax credit for any size project. [1]

Contents

In 2015, Indiana ranked 18th among U.S. states for installed solar power with 136 MW of photovoltaic panels. [2] An estimated 18% of electricity in Indiana could be provided by rooftop solar panels. [3]

Community Solar Array, Linden The Tipmont REMC Community Solar Array (cropped).jpg
Community Solar Array, Linden

In 2011, Indiana's largest solar installation was the six acre array located on the roof of the Maj. Gen. Emmett J. Bean Federal Center in Lawrence, Indiana, capable of generating a peak power of over 2 MW. [4] A 17.5MW plant built at the Indianapolis airport in 2013 was the largest airport solar farm in the U.S. [5] A 9MW solar farm was built at the Indianapolis Motor Speedway in 2014. [6] [7] The 3.2MW Rockville Solar II is the largest solar roof installation in the state. [8]

The Mammoth Solar project in Northwest Indiana broke ground in October 2021, and when complete it will be the largest solar project in the United States, with more than 2.8 million panels producing more than 1 gigawatt of power. [9] [10]

Government policy

The Government of Indiana has taken a variety of actions in order to encourage solar energy use within the state.

Net metering

The state has a net metering program that allows installations of up to 1 MW of on-site electrical generation to continuously roll over any excess generation to the next month. Participation is limited to 1% of utilities most recent peak summer demand. [11] Peak summer demand for the state for 2011 was 20,251 MW. [12]

Feed In Tariff

Indiana's Northern Indiana Public Service Company, NIPSCO, offers a feed-in tariff of $0.30/kWh for systems from 5 to 10 kW, and $0.26/kWh for systems from 10 kW to 2 MW. [13] AES Indiana has a Renewable Energy Production program that pays $0.24/kWh for solar from 20 kW to 100 kW and $0.20/kWh for solar arrays of from 100 kW to 10 MW. Payments are for 15 years, participation is limited, and one third of the program, 45,900 MWh/year, will be made available through a reverse auction. No new applications will be accepted beyond March 2013. [14]

Indiana Solar Energy Working Group

The Indiana Office of Energy Development has created the Indiana Solar Energy Working Group to promote the development of solar energy, including local manufacturing. [15]

Statistics

Installed capacity

Solar power in Indiana
Source: NREL [16]
Grid-connected PV capacity (MWp) [17] [18] [19] [20] [21] [22] [23] [2]
YearCapacityInstalled % Change
20090.30.3>200%
20100.50.267%
20113.53600%
20124.40.926%
201349.4451022%
201411259111%
20151362421%
20162178160%
20172806329%
20183274716.7%
20194209328.4%
2020473.353.312.6%
20211,618.81,145.5 %
20221,64021.2 %

Utility-scale generation

Utility-scale solar generation in Indiana (GWh) [24]
YearTotalJanFebMarAprMayJunJulAugSepOctNovDec
20132900111111111011
2014103347810121111111196
20151557913151515161714121210
201622791715172121242424211915
201727681922223035333131181512
201829012102934343338322721911
2019322132029303135434029241513
2020358121727313748454235301915
2021532242545637169686968524768
20221,1626072941011211421311221101006445
20232434786110

See also

Related Research Articles

<span class="mw-page-title-main">Solar power in New York</span> Overview of solar power in the U.S. state of New York

As of mid-2023, New York has over 4,717 MW of solar power installed, generating almost 5% of the state's electricity.

<span class="mw-page-title-main">Solar power in Washington (state)</span>

As of the first quarter of 2023, Washington State has 604 MW of solar power electricity generation. This is an increase from about 300 MW in 2021 and 27 MW in 2013.

<span class="mw-page-title-main">Solar power in Kentucky</span>

Solar power in Kentucky has been growing in recent years due to new technological improvements and a variety of regulatory actions and financial incentives, particularly a 30% federal tax credit, available through 2016, for any size project. Kentucky could generate 10% of all of the electricity used in the United States from land cleared from coal mining in the state. Covering just one-fifth with photovoltaics would supply all of the state's electricity.

<span class="mw-page-title-main">Solar power in Ohio</span> Overview of solar power in the U.S. state of Ohio

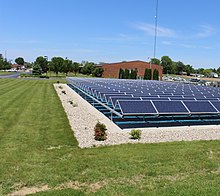
Solar power in Ohio has been increasing, as the cost of photovoltaics has decreased. Ohio installed 10 MW of solar in 2015. Ohio adopted a net metering rule which allows any customer generating up to 25 kW to use net metering, with the kilowatt hour surplus rolled over each month, and paid by the utility once a year at the generation rate upon request. For hospitals there is no limit on size, but two meters are required, one for generation, the other for utility supplied power.

<span class="mw-page-title-main">Solar power in Rhode Island</span> Overview of solar power in the U.S. state of Rhode Island

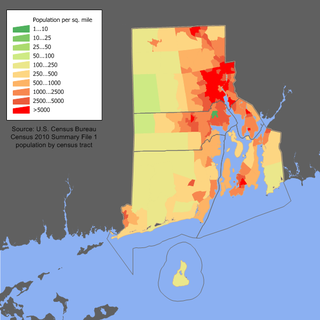
Solar power in Rhode Island has become economical due to new technological improvements and a variety of regulatory actions and financial incentives, particularly a 30% federal tax credit, available through 2016, for any size project. A typical residential installation could pay for itself in utility bill savings in 14 years, and generate a profit for the remainder of its 25 year life. Larger systems, from 10 kW to 5 MW, receive a feed-in tariff of up to 33.45¢/kWh.

<span class="mw-page-title-main">Solar power in Kansas</span> Overview of solar power in the U.S. state of Kansas

Solar power in Kansas has been growing in recent years due to new technological improvements and a variety of regulatory actions and financial incentives.

<span class="mw-page-title-main">Solar power in West Virginia</span> Electricity from sunlight in one U.S. state

Solar power in West Virginia on rooftops can provide 23% of all electricity used in West Virginia from 6,300 MW of solar panels, but West Virginia will be the last state in the United States to reach grid parity - the point where solar panels are cheaper than grid electricity - without incentives, due to the low cost of electricity - about $0.062/kWh. The point where grid parity is reached is a product of the average insolation and the average cost of electricity. At $0.062/kWh and 4.3 sun-hours/day, solar panels would need to come down to ~$1,850/kW installed to achieve grid parity. The first state in the US to achieve grid parity was Hawaii. Solar power's favorable carbon footprint compared to fossil fuels is a major motivation for expanding renewable energy in the state, especially when compared to coal to generate electrical power.

<span class="mw-page-title-main">Solar power in Iowa</span> Overview of solar power in the U.S. state of Iowa

Solar power in Iowa is limited but growing, with 137 megawatts (MW) installed by the end of 2019 and 27 MW installed during that year, ranking the state 40th among U.S. states. Iowa also generated 0.23% of the state's total electricity production in 2019 from solar energy; an amount sufficient to power over 17,000 Iowa homes. The state's early position as a major wind-power provider may have limited early large-scale solar investment.

<span class="mw-page-title-main">Solar power in Maine</span> Overview of solar power in the U.S. state of Maine

Solar power in Maine on rooftops, utilizing 6,300 megawatts (MW) of solar panels, can provide 60% of the electricity used in Maine according to a 2016 U.S. Department of Energy study. Maine and Vermont are tied for the second highest rooftop solar potential in the country, only behind the state of California. A 2020 estimate suggests that a typical 5.6 kilowatt (kW) residential system will pay for itself in 6-7 years and generate a profit of $45,000 over the rest of its 25-year life from the tax credits and utility savings.

<span class="mw-page-title-main">Solar power in Oklahoma</span> Overview of solar power in the U.S. state of Oklahoma

Solar power in Oklahoma can provide 44.1% of all electricity used in Oklahoma from 19,300 MW of rooftop solar panels. This scenario is extremely unlikely though because the cost of electricity in Oklahoma is among the lowest in the nation.

<span class="mw-page-title-main">Solar power in Arkansas</span> Overview of solar power in the U.S. state of Arkansas

Solar power in Arkansas on rooftops can provide 33.3% of all electricity used in Arkansas from 12,200 MW of solar panels.

<span class="mw-page-title-main">Solar power in Alabama</span> Overview of solar power in the U.S. state of Alabama

Solar power in Alabama on rooftops could theoretically provide 29.8% of all electricity used in Alabama, with 20,400 MW of solar panels potentially installed on rooftops.

<span class="mw-page-title-main">Solar power in Georgia (U.S. state)</span> Overview of solar power in the U.S. state of Georgia

Solar power in Georgia on rooftops can provide 31% of all electricity used in Georgia.

<span class="mw-page-title-main">Solar power in Minnesota</span> Overview of solar power in the U.S. state of Minnesota

Solar power in Minnesota expanded significantly in the early 2010s as a result of the cost decrease of photovoltaics and favorable policies. By 2016, it began to grow quickly.

<span class="mw-page-title-main">Solar power in Maryland</span> Overview of solar power in the U.S. state of Maryland

Solar power in Maryland is supported by the state's legislation regarding the Renewable Portfolio Standard and Solar Renewable Energy Credit (SREC) program. The target for renewable energy as of 2017 is 20% by 2020, including 2% from solar power.

<span class="mw-page-title-main">Solar power in Missouri</span> Overview of solar power in the U.S. state of Missouri

Solar power in Missouri has been a growing industry since the early 2010s. Solar power is capable of generating 42.7% of the electricity used in Missouri from rooftop solar panels totaling 28,300 MW.

<span class="mw-page-title-main">Solar power in Idaho</span> Solar power in Idaho

Solar power in Idaho comprised 550 MW in 2019. A 2016 report by the National Renewable Energy Laboratory estimated that rooftops alone have the potential to host 4,700 MW of solar panels, and thus provide 26.4% of all electricity used in Idaho. A large increase in the state's solar generating capacity began starting year 2015 when 461 MW of solar power was contracted to be built in Idaho.

<span class="mw-page-title-main">Solar power in New Hampshire</span> Overview of solar power in the U.S. state of New Hampshire

Solar power in New Hampshire provides a small percentage of the state's electricity. State renewable requirements and declining prices have led to some installations. Photovoltaics on rooftops can provide 53.4% of all electricity used in New Hampshire, from 5,300 MW of solar panels, and 72% of the electricity used in Concord, New Hampshire. A 2016 estimate suggests that a typical 5 kW system costing $25,000 before credits and utility savings will pay for itself in 9 years, and generate a profit of $34,196 over the rest of its 25-year life. A loan or lease provides a net savings each year, including the first year. New Hampshire has a rebate program which pays $0.75/W for residential systems up to 5 kW, for up to 50% of the system cost, up to $3,750. However, New Hampshire's solar installation lagged behind nearby states such as Vermont and New York, which in 2013 had 10 times and 25 times more solar, respectively.

<span class="mw-page-title-main">Solar power in Vermont</span> Overview of solar power in the U.S. state of Vermont

Solar power in Vermont provides almost 11% of the state's in-state electricity production as of 2018. A 2009 study indicated that distributed solar on rooftops can provide 18% of all electricity used in Vermont. A 2012 estimate suggests that a typical 5 kW system costing $25,000 before credits and utility savings will pay for itself in 10 years, and generate a profit of $34,956 over the rest of its 25-year life.

<span class="mw-page-title-main">Solar power in Tennessee</span> Overview of solar power in the U.S. state of Tennessee

Solar power in Tennessee is capable of producing much of the state's electricity; however, the industry remains in early stages in the state. With 129 MW of solar power in 2015, Tennessee ranked 20th among states for installed solar capacity.

References

  1. 30% No Limit Federal Tax Credit!
  2. 1 2 Indiana Fact Sheet, Solar Energy Industries Association, accessed May 19, 2016
  3. Report Argues for a Decentralized System of Renewable Power Generation
  4. 6-acre solar energy project will be Indiana's biggest yet
  5. INDSolarFarm
  6. Indiana, SEIA
  7. 2 new solar farms being planned in Indiana [ dead link ], BloombergBusinessWeek, September 19, 2014
  8. REC Group powers largest commercial solar rooftop PV plant in Midwest United States
  9. Bowman, Sarah. "Northwest Indiana will be home to largest solar farm in U.S., covering 13,000 acres". The Indianapolis Star. Retrieved 2021-11-10.
  10. "Mammoth Solar | Doral Renewables" . Retrieved 2021-11-10.
  11. "Indiana - Net Metering" . Retrieved 2012-06-09.
  12. Indiana Electricity Projections pg. 1-7
  13. NIPSCO - Feed-In Tariff
  14. Indianapolis Power & Light - Rate REP
  15. Solar Energy
  16. "PV Watts". NREL. Retrieved 24 January 2013.
  17. Sherwood, Larry (August 2012). "U.S. Solar Market Trends 2011" (PDF). Interstate Renewable Energy Council (IREC). Archived from the original (PDF) on 2012-09-06. Retrieved 2012-08-16.
  18. Sherwood, Larry (June 2011). "U.S. Solar Market Trends 2010" (PDF). Interstate Renewable Energy Council (IREC). p. 20. Retrieved 2011-06-29.
  19. Sherwood, Larry (July 2010). "U.S. Solar Market Trends 2009" (PDF). Interstate Renewable Energy Council (IREC). p. 23. Archived from the original (PDF) on 2010-09-25. Retrieved 2010-07-28.
  20. Sherwood, Larry (July 2009). "U.S. Solar Market Trends 2008" (PDF). Interstate Renewable Energy Council (IREC). p. 16. Archived from the original (PDF) on 2009-11-23. Retrieved 2010-07-24.
  21. Sherwood, Larry (July 2012). "U.S. Solar Market Trends 2012" (PDF). Interstate Renewable Energy Council (IREC). p. 16. Retrieved 2013-10-11.
  22. Sherwood, Larry (July 2014). "U.S. Solar Market Trends 2013" (PDF). Interstate Renewable Energy Council (IREC). Retrieved 2014-09-26.
  23. Indiana Solar
  24. "Electricity Data Browser". U.S. Department of Energy. March 28, 2018. Retrieved October 7, 2021.