Wind power in Ohio

Last updated
USA Ohio location map.svg
Green pog.svg
AMP-Ohio
Black pog.svg
NASA Plum Brook
Orange pog.svg
Buckeye Wind Farm
Green pog.svg
Scioto Ridge Wind Farm
Green pog.svg
Timber Road II Wind Farm
Green pog.svg
Timber Road Wind Farm
Green pog.svg
Timber Road III Wind Farm
Green pog.svg
Hog Creek Wind Farm
Black pog.svg
Black Fork Wind Farm
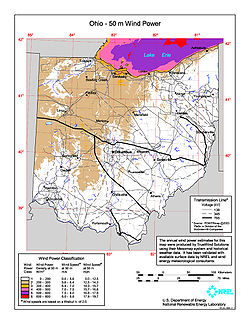
Wind power projects in Ohio
  Green pog.svg Operating
  Orange pog.svg Under construction
  Purple pog.svg Proposed
  Black pog.svg Canceled or decommissioned

Wind power in Ohio has a long history, and as of 2016, Ohio has 545 megawatts (MW) of utility-scale wind power installations installed, responsible for 1.1% of in-state electricity generated. [1] Over 1000 MW more were under construction or pending approval. [2] Some installations have become tourist attractions. [3] [4] There has been a sudden increase in generating capacity, as the total wind power capacity in the state was just 9.7 MW in 2010. [5] By 2019, there were 738 MW of capacity, which generated 1.71% of Ohio's electricity. [6]

Contents

Ohio's first large wind farm, Timber Road II near Payne in northwest Ohio, opened on October 6, 2011. [7] [8] It was surpassed in June 2012 by the 304 MW Blue Creek Wind Farm. [9]

History

Photos of "Mr. Brush's Windmill Dynamo" from Scientific American, 1890 Brush-windmill.jpg
Photos of "Mr. Brush's Windmill Dynamo" from Scientific American, 1890

Wind power in Ohio has a long (albeit discontinuous) history.

Brush's windmill dynamo

Charles F. Brush designed one of world's earliest electricity-generating windmills in Cleveland, Ohio, in 1887–1888. [11] His engineering company built the "windmill dynamo" at his home. It operated from 1886 until 1900. [10] The Brush wind turbine had a rotor 56 feet (17 m) in diameter and was mounted on a 60-foot (18 m) tower, making it similar in size to some of the first commercial wind farm turbines of the 1980s. However, the machine was only rated at 12 kW; it turned relatively slowly since it had 144 blades. Brush used the connected dynamo either to charge a bank of batteries or to operate up to 100 incandescent light bulbs, three arc lamps, and various motors in his laboratory. The machine fell into disuse after 1900 when electricity became available from Cleveland's central stations, and was abandoned in 1908. [12]

NASA Lewis MOD series

From 1974 to 1981, NASA's Glenn Research Center (then the Lewis Research Center) in Brook Park, Ohio, led the U.S. Wind Energy Program for large horizontal-axis wind turbines, designing a series of 13 experimental large horizontal-axis wind turbines. In conjunction with the United States Department of Energy, NASA developed and tested megawatt-class wind turbines. The program's goal was to develop the technology, and then turn it over to private industry. While none of the program's wind turbine designs saw mass commercialization, the tests generated valuable data and pioneered modern design concepts such as tubular towers and computer control of blade pitch and rotor yaw.

Most of the MOD-series wind turbines went to sites outside of Ohio, but the first unit, the MOD-0 operated at NASA's Plum Brook facility near Sandusky from 1975 to 1988. [13] Initially, the wind turbine had a lattice tower, a 38.1m diameter two-bladed rotor mounted downwind from the tower, and a capacity of 100 kW. Lockheed Corporation manufactured aluminum rotor blades. The discovery of severe stress resulting from the rotor blades passing through the tower's wind shadow led to several redesigns. In 1979, NASA rebuilt the MOD-0 with an upwind rotor mounted on a teetering hub, with a steel spar reinforcing the blades. In 1982, a tubular tower replaced the lattice tower. Finally, in 1985 NASA tested a single-bladed rotor with a teetering hub. [13] In 1981, two NASA Glenn engineers, Larry Viterna and Bob Corrigan, used the adjustable-pitch blade feature of the MOD-0 to invent an analytical method for calculating wind turbine output in high winds, which has since become widely used in the wind power industry as the Viterna method. [14] [15]

Wind Turbine Regulation

In 2014, the Ohio General Assembly passed HB 483. This codified a wind turbine setback of 1,125 feet (343 m) from the property line for significant wind farms. [16] The change in wind turbine setbacks has discouraged investment of new wind farm development in the State of Ohio. [17]

Installed capacity and wind resources

Scioto Ridge Wind Farm SciotoRidgeWindFarm.jpg
Scioto Ridge Wind Farm

The following table compares the growth in wind power installed nameplate capacity in megawatts (MW) for Ohio and the entire United States from 2002 through 2019. [18] [6]

YearOhioUS
200204,687
20033.66,350
20047.26,723
20057.29,147
20067.411,575
20077.416,907
20087.425,410
20097.434,863
20109.640,267
201111246,916
201242860,005
201342861,107
201443565,880
201544374,471
201654582,171
201761789,078
201872996,487
2019738105,583
2020864122,478
Average annual wind power density map for Ohio at 50m above ground Ohio wind resource map 50m 800px.jpg
Average annual wind power density map for Ohio at 50m above ground

One large undeveloped resource of wind in Ohio is Lake Erie. [19] [20] [21] [22] Its shallow depth and shelter from hurricanes provide advantages in terms of both ease of construction as well as safety of the investment. Although land based wind farms frequently have lower siting costs, offshore wind farms usually have better wind, as open water lacks obstructions such as forests, buildings, and hills.

On February 11, 2010, the National Renewable Energy Laboratory released the first comprehensive update of the wind energy potential by state since 1993, showing that Ohio had potential to install 55 GW of onshore wind power nameplate capacity, generating 152 TWh annually. [23] For comparison, Ohio consumed 160.176 TWh of electricity in 2005; [24] the entire U.S. wind power industry was producing at an annual rate of approximately 50 TWh at the end of 2008; and Three Gorges Dam (the world's largest electricity-generating station) produced an average of 80 TWh/yr in 2008 and 2009.

Wind farms

In 2008, Ohio had one utility-scale wind farm, one single large turbine wind power installation, and two more in development.

American Municipal Power Inc Wind Farm

The AMP Wind Farm located at the following coordinates:( 41°22′46″N83°44′16″W / 41.379481°N 83.737707°W / 41.379481; -83.737707 ) west of Bowling Green in Wood County is Ohio's first utility-scale wind farm. It consists of four Vestas V80-1.8MW wind turbines giving a combined nameplate capacity of 7.2  MW. [5] [25] The first two units came online in 2003, and the second two in 2004, next to the Wood County landfill. In 2015 the wind turbines were paid off. [26] Because the turbines are early models, the operators have had difficulty sourcing replacement parts. [27] The US$10 million wind farm's wind turbines are highly visible for miles in all directions, and have become a tourist attraction, regularly hosting busloads of school children. A solar-powered kiosk on the site gives data to visitors about the project, the current wind speed, and real-time power generation. [3]

Great Lakes Science Center

The Great Lakes Science Center installed a reconditioned Vestas V27-225 kW wind turbine in 2006, outside its museum building on Cleveland's North Coast Harbor between Cleveland Browns Stadium and the Rock and Roll Hall of Fame ( 41°30′24″N81°41′48″W / 41.506661°N 81.696769°W / 41.506661; -81.696769 ). The North Coast entertainment complex receives 1.5 million visitors per year, and the wind turbine appears regularly on local news broadcasts and Cleveland Browns NFL broadcasts, making it one of the world's most-viewed wind turbines. [4]

The wind turbine originally operated on a wind farm in Denmark, which resold the wind turbine while repowering to newer, larger wind turbines. [4] [28] The ground around the wind turbine features an art display entitled Shadow and Light. [29] The display includes walkways that align with the wind turbine's shadow at solar noon and two hours, eleven minutes after solar noon, respectively. On the vernal and autumnal equinoxes, the wind turbine's shadow also aligns with the walkways by length. [29] Thus the wind turbine functions as a large gnomon in an incomplete sundial. The display includes boxes of light bulbs encased in concrete on one side of a plaza around the wind turbine's base, representing the amount of electricity consumed by the average American household in a year.

One Energy Wind for Industry projects

Wind for Industry turbine built for Ball Corporation's metal division in Findlay, Ohio Ball Corporation Wind Turbine.jpg
Wind for Industry turbine built for Ball Corporation's metal division in Findlay, Ohio

Findlay, Ohio, based on-site distributed-generation wind energy company One Energy has developed and constructed nine Wind for Industry projects to date with three projects in construction as of October 2018. Wind for Industry describes wind energy projects in which utility-scale wind turbines are installed on-site and interconnected on a facility's side of their utility meter (a process known as distributed generation or behind-the-meter wind, which sometimes follows net metering [30] ). These projects are designed to achieve a significant reduction of an industrial facility's electrical consumption from the grid. One Energy's on-site generation list includes:

Wind for Industry projects
NameLocationPowerNote
Cooper Farms’ Wind VW Van Wert, Ohio 4.5 MWOperating since 2011 [31]
Haviland Wind Haviland, Ohio 4.5 MWOperating since 2012 [32]
Ball Corporation's Zephyr Wind Project Findlay, Ohio 4.5 MWOperating since 2015
Whirlpool Corporation's Findlay Wind FarmFindlay, Ohio3.0 MWOperating since 2015 [33]
Marathon Petroleum's Harpster Wind Harpster, Ohio 1.5 MWOperating since 2016 [34]
Whirlpool Corporation's Marion Wind Project Marion, Ohio 4.5 MWOperating since 2017 [35]
Whirlpool Corporation's Ottawa Wind Project Ottawa, Ohio 1.5 MWOperating since 2018 [36]
Valfilm Corporation's Findlay Wind FarmFindlay, Ohio3.0 MWOperating since 2018 [37]
Whirlpool Corporation's Greenville Wind Farm Greenville, Ohio 4.5 MWPowering a KitchenAid facility. Operating since 2018 [38]
Autoliv-Nissin Brake Systems Findlay Wind ProjectFindlay, Ohio1.5 MWIn Construction 2018 [39]

Wind generation

Ohio Wind Generation (GWh, Million kWh)
YearTotalJanFebMarAprMayJunJulAugSepOctNovDec
200515111111111222
200614211111111112
200716111121111222
200816111111111223
200914111211110122
201013111111111121
2011198111211121326285062
201298611394117111506842365211972112
20131,1461401071141111025949365593143137
20141,154168961191369663563636100145103
20151,2021271091071209580474556128140148
20161,246162140127113877448405798123177
20171,589163171172154141125625465143162177
20181,751225163186148135906775102179183198
20192,044245190209212165154928596179178239
20202,2872212122031982091679688147196279271
20212,598189221284221194202117105240205293327
20223,151312354364325280187149110140287347296
2023965279338348
Source: [40]

See also

Related Research Articles

<span class="mw-page-title-main">Wind power</span> Electrical power generation from wind

Wind power is the use of wind energy to generate useful work. Historically, wind power was used by sails, windmills and windpumps, but today it is mostly used to generate electricity. This article deals only with wind power for electricity generation. Today, wind power is generated almost completely with wind turbines, generally grouped into wind farms and connected to the electrical grid.

<span class="mw-page-title-main">Wind farm</span> Group of wind turbines

A wind farm or wind park, also called a wind power station or wind power plant, is a group of wind turbines in the same location used to produce electricity. Wind farms vary in size from a small number of turbines to several hundred wind turbines covering an extensive area. Wind farms can be either onshore or offshore.

<span class="mw-page-title-main">Capacity factor</span> Electrical production measure

The net capacity factor is the unitless ratio of actual electrical energy output over a given period of time to the theoretical maximum electrical energy output over that period. The theoretical maximum energy output of a given installation is defined as that due to its continuous operation at full nameplate capacity over the relevant period. The capacity factor can be calculated for any electricity producing installation, such as a fuel consuming power plant or one using renewable energy, such as wind or the sun. The average capacity factor can also be defined for any class of such installations, and can be used to compare different types of electricity production.

<span class="mw-page-title-main">Wind power in the United Kingdom</span>

The United Kingdom is the best location for wind power in Europe and one of the best in the world. The combination of long coastline, shallow water and strong winds make offshore wind unusually effective.

<span class="mw-page-title-main">History of wind power</span> Aspect of history

Wind power has been used as long as humans have put sails into the wind. King Hammurabi's Codex already mentioned windmills for generating mechanical energy. Wind-powered machines used to grind grain and pump water — the windmill and wind pump — were developed in what is now Iran, Afghanistan, and Pakistan by the 9th century. Wind power was widely available and not confined to the banks of fast-flowing streams, or later, requiring sources of fuel. Wind-powered pumps drained the polders of the Netherlands, and in arid regions such as the American midwest or the Australian outback, wind pumps provided water for livestock and steam engines.

<span class="mw-page-title-main">Wind power in Europe</span>

As of 2023, Europe had a total installed wind capacity of 255 gigawatts (GW). In 2017, a total of 15,680 MW of wind power was installed, representing 55% of all new power capacity, and the wind power generated 336 TWh of electricity, enough to supply 11.6% of the EU's electricity consumption.

<span class="mw-page-title-main">Wind power in Iowa</span> Electricity from wind in one U.S. state

Making up over 62% of the state's generated electricity in 2022, wind power is the largest source of electricity generation in Iowa. In 2020, over 34 billion kWh of electrical energy was generated by wind power. As of 2022, Iowa has over 12,200 megawatts (MW) of installed capacity with over 6,000 wind turbines, ranking 2nd and 3rd in the nation below Texas respectively.

<span class="mw-page-title-main">Burton Wold Wind Farm</span> Wind farm near Burton Latimer in Northamptonshire, UK

Burton Wold Wind Farm is a wind farm located near Burton Latimer in the English county of Northamptonshire, UK. The farm was developed by Your Energy Ltd, is owned by Mistral Windfarms and operated by Engineering Renewables Ltd. E.ON UK is buying the electricity output of the project under a long-term power purchase agreement. The farm is spread over three hectares. It has an installed capacity of 20 MW and generate on average around 40,000,000 units of electricity annually.

<span class="mw-page-title-main">Wind power in France</span>

In 2021 France reached a total of 18,676 megawatts (MW) installed wind power capacity placing France at that time as the world's seventh largest wind power nation by installed capacity, behind the United Kingdom and Brazil and ahead of Canada and Italy. According to the IEA the yearly wind production was 20.2 TWh in 2015, representing almost 23% of the 88.4 TWh from renewable sources in France during that year. Wind provided 4.3% of the country's electricity demand in 2015.

The Titan Wind Project is 25MW wind farm which had a proposed expansion to 5,050 MW, formerly known as Rolling Thunder, based in South Dakota. The project developers, Clipper Windpower and BP Alternative Energy, expected to build Titan in several phases and, when completed, it would have been one of the largest wind farms in the world.

<span class="mw-page-title-main">Wind power in Wyoming</span> Electricity from wind in U.S. state

Wyoming has one of the highest wind power potentials of any state in the United States. In 2019, Wyoming had wind powered electricity generating capacity of 1,589 MW, which produced 9.85% of its electric generation, with an additional 3,753 MW under construction. However, the wind generation in that year was Wyoming's third-lowest in the 2010s. By 2020, wind capacity increased to 2738 MW and 8448 gigawatt-hours of electricity were produced from wind in 2021, more than double 2019 production. Additional wind capacity and needed transmission lines are under construction or planned, despite political headwinds from Wyoming's strong coal and oil sectors.

<span class="mw-page-title-main">Wind power in Belgium</span> Overview of wind power in Belgium

Wind power in Belgium depends partially on regional governments and partially on the Belgian federal government. Wind energy producers in both the Flemish and Walloon regions get green certificates but not with the same conditions.

Wind power in Indiana was limited to a few small water-pumping windmills on farms until 2008 with construction of Indiana's first utility-scale wind power facility, Goodland with a nameplate capacity of 130 MW. As of September 2017, Indiana had a total of 1897 MW of wind power capacity installed, ranking it 12th among U.S. states. Wind power was responsible for 4.8% of in-state electricity production in 2016.

<span class="mw-page-title-main">Meadow Lake Wind Farm</span> Wind farm in Indiana, USA

Meadow Lake Wind Farm is an 801.25 megawatt (MW) wind farm near Brookston and Chalmers, Indiana, spreading over portions of White, Jasper, and Benton Counties. It is owned and operated by EDP Renewables North America. The facility currently has six operational phases, with 414 turbines, and is a prominent feature on both sides of Interstate 65 in western Indiana.

In 2016, Arizona had 268 megawatts (MW) of wind powered electricity generating capacity, producing 0.5% of in-state generated electricity.

<span class="mw-page-title-main">NASA wind turbines</span>

Starting in 1975, NASA managed a program for the United States Department of Energy and the United States Department of Interior to develop utility-scale wind turbines for electric power, in response to the increase in oil prices. A number of the world's largest wind turbines were developed and tested under this pioneering program. The program was an attempt to leap well beyond the then-current state of the art of wind turbine generators, and developed a number of technologies later adopted by the wind turbine industry. The development of the commercial industry however was delayed by a significant decrease in competing energy prices during the 1980s.

<span class="mw-page-title-main">Wind turbines on public display</span>

The great majority of wind turbines around the world belong to individuals or corporations who use them to generate electric power or to perform mechanical work. As such, wind turbines are primarily designed to be working devices. However, the large size and height above surroundings of modern industrial wind turbines, combined with their moving rotors, often makes them among the most conspicuous objects in their areas. A few localities have exploited the attention-getting nature of wind turbines by placing them on public display, either with visitor centers on their bases, or with viewing areas farther away. The wind turbines themselves are generally of conventional horizontal-axis, three-bladed design, and generate power to feed electrical grids, but they also serve the unconventional roles of technology demonstration, public relations, and education.

The following outline is provided as an overview of and topical guide to wind energy:

<span class="mw-page-title-main">Wind power in Rhode Island</span> Electricity from wind in one U.S. state

Wind power in Rhode Island is in the early stages of development. There are several small scale wind turbine projects in the state. As of December 2013 there were 11 turbines at 10 sites in the state. In 2014, Rhode Island had 9 MW of installed wind power capacity, which quickly rose to 75 MW in 2019.

Wind power in Arkansas remains nearly untapped, with just a single wind turbine in the state. Arkansas does not have a renewable portfolio standard. Studies have concluded that while Arkansas is generally considered to have low wind resources, there are significant pockets of it throughout the state.

References

  1. "Ohio Wind Energy" (PDF). U.S. Wind Energy State Facts. American Wind Energy Association. Retrieved 27 December 2017.
  2. Ohio Power Siting Board Process Archived 2016-01-21 at the Wayback Machine page 18
  3. 1 2 "Ohio gov blows hard with wind-powered energy". Environment Ohio. 2008-01-12. Archived from the original on 2011-07-26. Retrieved 2008-12-15.
  4. 1 2 3 Wasserman, Harvey (2008-07-31). "Great wind on the Great Lakes". Renewable Energy World. Retrieved 2008-12-15.
  5. 1 2 "U.S. Wind Energy Projects - Ohio". American Wind Energy Association. 2008-11-19. Archived from the original on November 18, 2008. Retrieved 2008-12-15.
  6. 1 2 Wind Energy in Ohio
  7. NA, EDP Renewables. "Horizon Wind Energy Invests Approximately $175 Million in Paulding County, Ohio". www.prnewswire.com. Archived from the original on 3 March 2016. Retrieved 26 April 2018.
  8. "Timber Road II Wind Farm Commissioning Marks a First for Ohio - CleanTechnica". cleantechnica.com. 2011-10-06. Retrieved 26 April 2018.
  9. "Blue Creek Wind Farm, Ohio". Power Technology | Energy News and Market Analysis. Retrieved 2019-04-30.
  10. 1 2 "A Wind Energy Pioneer: Charles F. Brush". Danish Wind Industry Association. Archived from the original on 2007-02-26. Retrieved 2007-05-02.
  11. "Mr. Brush's Windmill Dynamo". Scientific American . 63 (25): 54. 1890-12-20.
  12. "History of Wind Energy". Encyclopedia of Energy. Vol. 6. Elsevier. 2007. pp. 421–422. ISBN   978-1-60119-433-6.
  13. 1 2 "Winds Of Change, Stories of a dawning Wind Power Industry, American Federal Projects 1975–1985". Nordisk AeroForm ApS. Archived from the original on 2008-07-16. Retrieved 2008-12-10.
  14. Wittry, Jan (2008-09-06). "NASA Wind Energy Research Reaps Rewards". Archived from the original on 2009-01-17. Retrieved 2008-12-15.
  15. Viterna, L.A.; Janetzke, D.C. (1982-09-01). "Theoretical and experimental power from large horizontal-axis wind turbines". Brook Park, Ohio: Glenn Research Center. 19820025954. Archived from the original on 2011-06-06. Retrieved 2008-12-15.
  16. "Am. Sub. H.B. 483" (PDF). Ohio General Assembly. 2014. p. 163. Archived (PDF) from the original on October 14, 2017. Retrieved October 13, 2017.
  17. Funk, John (May 24, 2017). "Ohio wind law crippling wind development, $4.2 billion boost to Ohio economy". The Plain Dealer. Archived from the original on October 8, 2017. Retrieved October 13, 2017.
  18. "U.S. Installed and Potential Wind Power Capacity and Generation". United States Department of Energy. 2019. Archived from the original on June 26, 2019. Retrieved July 21, 2019.
  19. Bradley, David (2004-02-06). "A Great Potential: The Great Lakes as a Regional Renewable Energy Source" (PDF). Archived from the original (PDF) on 2009-03-25. Retrieved 2008-10-04.
  20. "Great Lakes eyed for offshore wind farms". NBC News, Associated Press. 2008-10-31. Retrieved 2008-11-14.
  21. "Momentum Grows for Great Lakes Offshore Wind". NewEnergyNews. 2008-10-31. Archived from the original on 2011-01-01. Retrieved 2008-11-15.
  22. "Lake Erie Wind Resource Report, Cleveland Water Crib Monitoring Site, Two-Year Report Executive Summary" (PDF). Green Energy Ohio. 2008-01-10. Archived (PDF) from the original on 2008-12-17. Retrieved 2008-11-27.
  23. "Estimates of Windy Land Area and Wind Energy Potential by State for Areas >= 30% Capacity Factor at 80m". National Renewable Energy Laboratory. 2010-02-04. Archived from the original (XLS) on 2011-03-10. Retrieved 2010-02-25.
  24. "Electric Power and Renewable Energy in Ohio". USDOE, EERE. 2008-06-25. Archived from the original on 2009-12-08. Retrieved 2010-02-25.
  25. "AMP-Ohio/Green Mountain Energy Wind Farm, USA". World wind power database. Archived from the original on 2011-07-24. Retrieved 2008-12-15.
  26. McLaughlin, Jan Larson (August 2, 2020). "BG's iconic wind turbines becoming costly dinosaurs – but city not giving up on wind – BG Independent News". BG Independent Media. Retrieved 23 August 2022.
  27. McLaughlin, Jan Larson (August 22, 2022). "Once state of the art, BG wind turbines are still struggling to crank out power – BG Independent News". BG Independent Media. Retrieved 23 August 2022.
  28. "Wind Turbine Project Q & A". Great Lakes Science Center. 2006-05-17. Archived from the original on 2009-04-25. Retrieved 2008-10-28.Link is broken as of 2008-12-15.
  29. 1 2 "Renewable Energy Exhibits". Great Lakes Science Center. Archived from the original on 2009-05-20. Retrieved 2008-12-18.
  30. "Distributed Wind | Department of Energy". www.energy.gov. Retrieved 2018-06-01.
  31. Everett, John (2013). "Cooper Farms". Green Energy Ohio News Magazine.
  32. "Haviland (USA)". The Wind Power: Wind Energy Market Intelligence. Archived from the original on 17 July 2018. Retrieved 17 July 2018.
  33. "Whirlpool and Ball plan $18M wind farm". Toledo Business Journal. March 2015. Archived from the original on 2018-06-28.
  34. "Harpster Wind (USA)". The Wind Power: Wind Energy Market Intelligence. Archived from the original on 17 July 2018. Retrieved 17 July 2018.
  35. "Whirlpool Corporation Breaks Ground on Latest Ohio Wind Power Generation Project at its Marion Manufacturing Facility". Whirlpool Corporation. 6 December 2016. Retrieved 10 July 2018.
  36. Sharpe, Joseph (7 December 2017). "Whirlpool Corporation in Ottawa Going Wind Power". 3BL Media. Retrieved 10 July 2018.
  37. Wilin, Lou (13 June 2017). "Valfilm plans wind turbines". The Findlay Courier. Retrieved 10 July 2018.
  38. Whirlpool Corporation (15 November 2017). "Whirlpool Corporation Announces Plans for Wind Turbines at Greenville Manufacturing Facility". Cision PR Newswire. Retrieved 10 July 2018.
  39. "One Energy to build Findlay's eighth wind turbine". The Findlay Courier. 28 March 2018. Retrieved 10 July 2018.
  40. "Electricity Data Browser". U.S. Department of Energy. March 28, 2018. Retrieved August 10, 2021.