Solar power in Oregon

Last updated

Solar panels at a winery in Yamhill County Solena and Grand Cru Estates winery - Yamhill County, Oregon.JPG
Solar panels at a winery in Yamhill County

Solar power has been growing in the U.S. state of Oregon in recent years due to new technological improvements and a variety of regulatory actions and financial incentives enacted by the state government.

Contents

Government policy

Solar panel installation, Salem Solar panels (7167419536).jpg
Solar panel installation, Salem

The Government of Oregon has taken a variety of actions to encourage solar energy use and manufacturing within the state. A 2017 law states that homeowners associations cannot ban solar panels. [1]

Net metering

The state has a net metering program that allows for large installations of up to 2 MW of on-site electrical generation. [2] A report released in 2009 by the Network for New Energy Choices and Vote Solar gave the state's net metering system an "A" grade, a rating only 9 other states received. [3]

Renewable portfolio standard

The state adopted a Renewable Portfolio Standard (RPS) in 2007 which requires that 25% of Oregon's electricity come from renewable resources by 2025. [4] The RPS was revised in 2009 to include a separate 20 MW solar photovoltaic requirement by 2020. [5]

Construction budget mandate

Passed in the 2007 legislative session, House Bill 2620, requires that public entities such as state and local governments spend 1.5% of the construction budget for new or renovated buildings on on-site solar technologies. [4] [6]

Financial incentives

Solar Within Reach

Solar Within Reach is a program through the Energy Trust of Oregon that provides incentives for income-qualified families. Adding a solar power system to your home can greatly reduce your energy bills, and this program is designed to help offset the costs of installing such a system, so you can reap the benefits without a big startup cost. [7]

Oregon Solar + Storage Rebate Program

In 2019, HB 2618 was passed, which created a new ODOE solar rebate program through the Oregon Department of Energy (ODOE). This rebate program allows residential solar energy customers as well as low-income service providers in Oregon to receive rebates for solar energy systems, whether they are stand-alone systems or paired with a solar energy storage system. [8]

Residential Energy Tax Credit

The Residential Energy Tax Credit (RETC) program aims to encourage residents to invest in energy efficient appliances or residential-scale power producing systems such as roof-mounted solar or small wind setups by offering a tax credit that covers a certain percentage of the cost of eligible equipment. [9]

Business Energy Tax Credit

The Business Energy Tax Credit (BETC) program aims to encourage private businesses to invest in renewable energy in Oregon by offering a tax credit that covers up to 50% of eligible renewable projects such as power stations or manufacturing factories with a maximum limit of $20 million per project. [4]

State Energy Loan Program

The State Energy Loan Program aims to encourage investment in energy efficiency and renewable energy production by offering long-term, fixed-rate loans to all types of organizations and individuals with a maximum cap at $20 million per loan. [10] From the time it was first authorized by voters in 1980, the program has made over 700 loans worth a total of $335 million. [11]

Feed-in tariff

The Oregon Legislative Assembly established a feed-in tariff for solar power modeled on feed-in tariffs in Germany, [12] allowing owners of solar installations to be paid for the electricity they produce. [13] On May 28, 2010, the Oregon Public Utility Commission approved the trial feed-in tariff rules. [14] Under the approved rules, residents and businesses who install solar systems can enter a 15-year contract with investor-owned utilities in the state where they will receive guaranteed monthly payments over the life of the contract with rates ranging from $0.55 to $0.65 per kWh. [15] Funding will come from an estimated one half of 1% increase in electricity rates. [15] The trial program ends after four years and the entire project's size is limited to a maximum 25 MW. [14] Program applications are accepted biannually on April 1 and October 1. The final year of the pilot program is 2013. [16]

Manufacturing

SolarWorld plant in Hillsboro, Oregon SolarWorld Hillsboro Oregon.JPG
SolarWorld plant in Hillsboro, Oregon

Many solar manufacturing companies have chosen to operate in Oregon because of its cheap hydroelectric power which is important for manufacturing and because of its close proximity to California's large market. [17] The inexpensive hydroelectric power has also contributed to the high-tech manufacturing companies located in the state's Silicon Forest as well as several data centers such as Google's Project 02. [18]

Oregon was one of the only three states (along with Michigan and Ohio) to manufacture more than 100 MW of solar panels during 2009. [19] SolarWorld's plant in Hillsboro, Oregon is the largest solar cell manufacturing factory in North America and is planned to produce 500 MW of panels annually by 2012. [20] [21]

Companies

Solar companies with operations in Oregon include SolarWorld, Sanyo, PV Powered/Advanced Energy, PV Trackers, Oregon Crystal, Grape Solar, Solaicx, and Peak Sun Silicon. [22] [23] [24] [25]

Notable projects

Solar panels on State Capitol

In 2002 Oregon became the first state to install solar panels on its state capitol building. [26] The solar panels were installed on the Oregon State Capitol building, although they are not visible from the street.

Solar highways

The 104kW solar highway along the interchange of Interstate 5 and I-205 near Tualatin, Oregon in December 2008. Oregon I-5, I-205 interchange solar highway (2008-12-04).jpg
The 104kW solar highway along the interchange of Interstate 5 and I-205 near Tualatin, Oregon in December 2008.

In 2008, the Oregon Department of Transportation announced the completion of a 104 kW solar panel project along the interchange of Interstate 5 and I-205 near Tualatin, Oregon. [27] The project is the first solar highway in Oregon and the first in the United States.

In January 2012, the Oregon Department of Transportation announced the completion of its second solar highway project with a 1.75 megawatt capacity at its Baldock Safety Rest Area south of Wilsonville. [28]

A 165 kW expansion to the first project is under study, as is a potential third solar highway project with a capacity of 3 megawatts at ODOT's maintenance storage facility in West Linn. [29] [30] The 3 megawatt project in West Linn, Oregon would be the largest solar highway in the world, slightly passing the 2.8 megawatt record holder in Germany. [31]

U.S. Department of Energy partnership

Portland, Oregon is one of the 25 cities in the United States Department of Energy's Solar America Cities program. The program's goal is to "rapidly increase the use and integration of solar energy in communities across the country." [32]

Statistics

US annual average solar energy received by a latitude tilt photovoltaic cell (modeled). Us pv annual may2004.jpg
US annual average solar energy received by a latitude tilt photovoltaic cell (modeled).

Potential generation

Solar energy is the state's most abundant energy resource and estimates have placed the state's potential electricity production from solar power at 68,000,000 MWhs annually, an amount larger than the state's total electricity consumption of 46,457,000 MWh in 2005. [33] [34]

Installed capacity

Oregon Grid-Connected PV Capacity (MW) [35] [36] [37] [38] [39] [40] [41] [42] [43]
YearCapacityChange% Change
20051.20
20061.70.542%
20072.81.165%
20087.74.9175%
200914.06.382%
201023.99.971%
201135.811.950%
201256.420.658%
201362.86.411%
201469.26.410%
20159020.830%
2016215125138%
2017461246114%
201859113028%
2019733.4142.424%
2020966.423331%
20211,208.2241.825%
20221,385176.8 %

Utility-scale generation

Utility-scale solar generation in Oregon (GWh) [44]
YearTotalJanFebMarAprMayJunJulAugSepOctNovDec
20127000111111100
201319011122222222
201424112223233221
201523112222332221
201641122343445454
20171947815162022201817231414
2018572213139506167656764483326
2019677303255636984828063583625
20201,078226374107109135155134103924539
20211,2586379134163176176171154142

See also

Related Research Articles

<span class="mw-page-title-main">Solar power in Washington (state)</span>

As of the first quarter of 2023, Washington State has 604 MW of solar power electricity generation. This is an increase from about 300 MW in 2021 and 27 MW in 2013.

<span class="mw-page-title-main">Solar power in Kentucky</span>

Solar power in Kentucky has been growing in recent years due to new technological improvements and a variety of regulatory actions and financial incentives, particularly a 30% federal tax credit, available through 2016, for any size project. Kentucky could generate 10% of all of the electricity used in the United States from land cleared from coal mining in the state. Covering just one-fifth with photovoltaics would supply all of the state's electricity.

<span class="mw-page-title-main">Solar power in Ohio</span> Overview of solar power in the U.S. state of Ohio

Solar power in Ohio has been increasing, as the cost of photovoltaics has decreased. Ohio installed 10 MW of solar in 2015. Ohio adopted a net metering rule which allows any customer generating up to 25 kW to use net metering, with the kilowatt hour surplus rolled over each month, and paid by the utility once a year at the generation rate upon request. For hospitals there is no limit on size, but two meters are required, one for generation, the other for utility supplied power.

<span class="mw-page-title-main">Solar power in Wyoming</span>

Solar power in Wyoming has the potential to generate 72 million MWh/yr. Wyoming used 12 million MWh in 1999. Net metering is available to all consumers generating up to 25 kW. The state has an installed capacity of 146 MW as of 2022.

<span class="mw-page-title-main">Solar power in Rhode Island</span> Overview of solar power in the U.S. state of Rhode Island

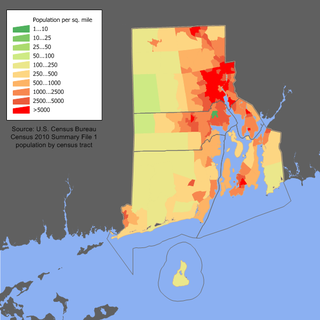
Solar power in Rhode Island has become economical due to new technological improvements and a variety of regulatory actions and financial incentives, particularly a 30% federal tax credit, available through 2016, for any size project. A typical residential installation could pay for itself in utility bill savings in 14 years, and generate a profit for the remainder of its 25 year life. Larger systems, from 10 kW to 5 MW, receive a feed-in tariff of up to 33.45¢/kWh.

<span class="mw-page-title-main">Solar power in Indiana</span> Overview of solar power in the U.S. state of Indiana

Solar power in Indiana has been growing in recent years due to new technological improvements and a variety of regulatory actions and financial incentives, particularly a 30% federal tax credit for any size project.

<span class="mw-page-title-main">Solar power in Kansas</span> Overview of solar power in the U.S. state of Kansas

Solar power in Kansas has been growing in recent years due to new technological improvements and a variety of regulatory actions and financial incentives.

Solar power in North Dakota has been a little-used resource. The state ranks last on installed solar power in the United States, with .47 MW of installed capacity. Solar on rooftops can provide 24.6% of all electricity used in North Dakota from 3,300 MW of solar panels. The most cost effective application for solar panels is for pumping water at remote wells where solar panels can be installed for $800 vs. running power lines for $15,000/mile.

<span class="mw-page-title-main">Solar power in South Dakota</span> Overview of solar power production and usage in South Dakota

Solar power in South Dakota has high potential but little practical application. The state ranked 50th among U.S. states in installed solar polar in 2015 with no utility-scale or large commercial systems. Photovoltaic panels on rooftops can provide 38.7% of all electricity used in South Dakota using 3,800 MW of solar panels. The state is ranked 14th in the country in solar power potential, and 4th in wind potential.

<span class="mw-page-title-main">Solar power in Maine</span> Overview of solar power in the U.S. state of Maine

Solar power in Maine on rooftops, utilizing 6,300 megawatts (MW) of solar panels, can provide 60% of the electricity used in Maine according to a 2016 U.S. Department of Energy study. Maine and Vermont are tied for the second highest rooftop solar potential in the country, only behind the state of California. A 2020 estimate suggests that a typical 5.6 kilowatt (kW) residential system will pay for itself in 6-7 years and generate a profit of $45,000 over the rest of its 25-year life from the tax credits and utility savings.

<span class="mw-page-title-main">Solar power in Oklahoma</span> Overview of solar power in the U.S. state of Oklahoma

Solar power in Oklahoma can provide 44.1% of all electricity used in Oklahoma from 19,300 MW of rooftop solar panels. This scenario is extremely unlikely though because the cost of electricity in Oklahoma is among the lowest in the nation.

<span class="mw-page-title-main">Solar power in Arkansas</span> Overview of solar power in the U.S. state of Arkansas

Solar power in Arkansas on rooftops can provide 33.3% of all electricity used in Arkansas from 12,200 MW of solar panels.

<span class="mw-page-title-main">Solar power in Alabama</span> Overview of solar power in the U.S. state of Alabama

Solar power in Alabama on rooftops could theoretically provide 29.8% of all electricity used in Alabama, with 20,400 MW of solar panels potentially installed on rooftops.

<span class="mw-page-title-main">Solar power in Minnesota</span> Overview of solar power in the U.S. state of Minnesota

Solar power in Minnesota expanded significantly in the early 2010s as a result of the cost decrease of photovoltaics and favorable policies. By 2016, it began to grow quickly.

<span class="mw-page-title-main">Solar power in Maryland</span> Overview of solar power in the U.S. state of Maryland

Solar power in Maryland is supported by the state's legislation regarding the Renewable Portfolio Standard and Solar Renewable Energy Credit (SREC) program. The target for renewable energy as of 2017 is 20% by 2020, including 2% from solar power.

<span class="mw-page-title-main">Solar power in Missouri</span> Overview of solar power in the U.S. state of Missouri

Solar power in Missouri has been a growing industry since the early 2010s. Solar power is capable of generating 42.7% of the electricity used in Missouri from rooftop solar panels totaling 28,300 MW.

<span class="mw-page-title-main">Solar power in Idaho</span> Solar power in Idaho

Solar power in Idaho comprised 550 MW in 2019. A 2016 report by the National Renewable Energy Laboratory estimated that rooftops alone have the potential to host 4,700 MW of solar panels, and thus provide 26.4% of all electricity used in Idaho. A large increase in the state's solar generating capacity began starting year 2015 when 461 MW of solar power was contracted to be built in Idaho.

<span class="mw-page-title-main">Solar power in Montana</span> Overview of solar power in the U.S. state of Montana

Solar power in Montana on rooftops could provide 28% of all electricity used in Montana from 3,200 MW of solar panels.

<span class="mw-page-title-main">Solar power in New Hampshire</span> Overview of solar power in the U.S. state of New Hampshire

Solar power in New Hampshire provides a small percentage of the state's electricity. State renewable requirements and declining prices have led to some installations. Photovoltaics on rooftops can provide 53.4% of all electricity used in New Hampshire, from 5,300 MW of solar panels, and 72% of the electricity used in Concord, New Hampshire. A 2016 estimate suggests that a typical 5 kW system costing $25,000 before credits and utility savings will pay for itself in 9 years, and generate a profit of $34,196 over the rest of its 25-year life. A loan or lease provides a net savings each year, including the first year. New Hampshire has a rebate program which pays $0.75/W for residential systems up to 5 kW, for up to 50% of the system cost, up to $3,750. However, New Hampshire's solar installation lagged behind nearby states such as Vermont and New York, which in 2013 had 10 times and 25 times more solar, respectively.

<span class="mw-page-title-main">Solar power in Delaware</span>

Solar power in Delaware is small industry. Delaware had 150 MW of total installed capacity in 2020. The largest solar farms in the state included the 10 MW Dover Sun Park and the 12 MW Milford Solar Farm.

References

  1. "Legislature says homeowners associations can't bar rooftop solar – Portland Business Journal". Archived from the original on September 1, 2017. Retrieved April 24, 2018.
  2. Stoel Rives LLP (August 8, 2007). "Oregon Revises Net Metering Rules". RenewableEnergyWorld.com. Archived from the original on January 30, 2016. Retrieved June 19, 2010.
  3. Knutson, Ryan (November 27, 2009). "Oregon Net Metering Policy Highlighted". Oregon Public Broadcasting. Archived from the original on December 3, 2009. Retrieved June 19, 2010.
  4. 1 2 3 "Oregon Approves 50% Solar Tax Credit". RenewableEnergyWorld.com. July 3, 2007. Archived from the original on October 2, 2012. Retrieved June 19, 2010.
  5. Law, Steve (August 13, 2009). "Heyday for solar?". Portland Tribune . Archived from the original on December 3, 2013. Retrieved November 26, 2013.
  6. Conservation Division (January 14, 2009). "1.5% for Solar Technology in Public Buildings". Oregon Department of Energy. Archived from the original on May 27, 2010. Retrieved June 19, 2010.
  7. Walters, Adam. "Solar Within Reach 2020 Guide". Sunbridge Solar. Retrieved July 11, 2020.
  8. Walters, Adam. "New Oregon Solar Rebates for Battery Backup". Sunbridge Solar. Retrieved July 11, 2020.
  9. Conservation Division (April 26, 2010). "Residential Energy Tax Credits". Oregon Department of Energy. Archived from the original on March 8, 2010. Retrieved March 13, 2010.
  10. Staff (August 1, 2007). "Energy Loan Program Questions & Answers". Oregon Department of Energy. Archived from the original on May 28, 2010. Retrieved June 20, 2010.
  11. Oregon Office of Energy (March 2008). "State of Oregon Energy Plan 2007–2009" (PDF). Oregon Department of Energy. Archived (PDF) from the original on July 5, 2010. Retrieved June 20, 2010.
  12. Hsuan, Amy (February 19, 2010). "Oregon's solar future could hinge on copying Germany". The Oregonian . Archived from the original on February 23, 2010. Retrieved March 13, 2010.
  13. "Oregon's Feed-in Tariff: Is This The Best Deal In Solar?". Imagine Energy. March 19, 2013. Archived from the original on June 29, 2013. Retrieved June 27, 2013.
  14. 1 2 Staff (May 28, 2010). "Commission Approves Residential and Business Solar Incentives". Oregon Public Utility Commission. Archived from the original on July 16, 2011. Retrieved July 1, 2010.
  15. 1 2 Read, Richard (June 30, 2010). "A pilot project starting Thursday pays customers to generate solar power". The Oregonian . Archived from the original on July 4, 2010. Retrieved July 1, 2010.
  16. "Oregon Readies To Reopen Feed-in Tariff Program For Commercial Solar". REC Solar Inc. February 19, 2013. Archived from the original on August 1, 2014. Retrieved June 27, 2013.
  17. Redell, Charles (June 9, 2008). "Where does green business thrive?". Sustainable Industries. Archived from the original on January 25, 2010. Retrieved June 19, 2010.
  18. Markoff, John and Saul Hansell (June 14, 2006). "Hiding in Plain Sight, Google Seeks More Power". The New York Times . Archived from the original on April 6, 2008. Retrieved June 19, 2010.
  19. Mehta, Shyam (September 8, 2009). "Bringing It All Back Home: PV Manufacturing in America". Green Tech Media. Archived from the original on July 20, 2010. Retrieved July 11, 2010.
  20. "SolarWorld's profits, sales up". Portland Business Journal . May 5, 2009. Retrieved March 13, 2010.
  21. "Timbers, SolarWorld Form Landmark Jersey Partnership". Forbes . February 24, 2010. Retrieved March 13, 2010.[ dead link ]
  22. Hsuan, Amy (November 2, 2009). "Sanyo Electric opens new solar panel plant in Salem". The Oregonian . Archived from the original on January 8, 2010. Retrieved March 23, 2010.
  23. Fehrenbacher, Katie (October 6, 2008). "Pacific Northwest Could Create 63,000 Green Jobs by 2025". earth2tech. Archived from the original on January 22, 2013. Retrieved June 19, 2010.
  24. Read, Richard (June 2, 2010). "Grape Solar takes wraps off expansion plans in Eugene". The Oregonian . Archived from the original on June 6, 2010. Retrieved June 19, 2010.
  25. Jacklet, Ben (June 2008). "The rise of Oregon's solar industry". Oregon Business Journal. Archived from the original on June 21, 2010. Retrieved July 1, 2010.
  26. Office of Energy Efficiency and Renewable Energy (August 2002). "Energy Office Installs PV on Capitol". United States Department of Energy . Retrieved March 15, 2010.
  27. Rivera, Dylan (August 7, 2008). "Oregon installs first highway solar project". The Oregonian . Archived from the original on January 7, 2010. Retrieved March 13, 2010.
  28. Hamilton, Allison (February 15, 2012). "Innovative Partnerships Program: Baldock Solar Highway". Oregon Department of Transportation. Archived from the original on March 8, 2012. Retrieved February 16, 2012.
  29. Hamilton, Allison (January 24, 2012). "Innovative Partnerships Program". Oregon Department of Transportation. Archived from the original on January 10, 2012. Retrieved February 16, 2012.
  30. Zheng, Yuxing (July 26, 2009). "Debate begins on ODOT plan to install up to 17,000 solar panels on I-205". The Oregonian . Archived from the original on August 31, 2009. Retrieved March 13, 2010.
  31. Roberts, Anthony (August 13, 2009). "Solar highway: Is it a bright idea?". West Linn Tidings . Retrieved April 20, 2013.[ permanent dead link ]
  32. Office of Energy Efficiency and Renewable Energy (November 2, 2009). "Solar American Cities – About". United States Department of Energy. Archived from the original on July 27, 2010. Retrieved August 1, 2010.
  33. Renewable Energy Atlas (2002). "Oregon Renewable Energy Resources" (PDF). The Energy Foundation. Archived from the original (PDF) on July 26, 2011. Retrieved June 19, 2010.
  34. Office of Energy Efficiency and Renewable Energy (June 25, 2008). "Electric Power and Renewable Energy in Oregon". United States Department of Energy. Archived from the original on May 27, 2010. Retrieved June 20, 2010.
  35. Sherwood, Larry (August 2012). "U.S. Solar Market Trends 2011" (PDF). Interstate Renewable Energy Council (IREC). Archived from the original (PDF) on September 6, 2012. Retrieved August 17, 2012.
  36. Sherwood, Larry (June 2011). "U.S. Solar Market Trends 2010" (PDF). Interstate Renewable Energy Council (IREC). Archived (PDF) from the original on September 4, 2011. Retrieved June 29, 2011.
  37. Sherwood, Larry (July 2010). "U.S. Solar Market Trends 2009" (PDF). Interstate Renewable Energy Council (IREC). Archived from the original (PDF) on September 25, 2010. Retrieved July 28, 2010.
  38. Sherwood, Larry (July 2009). "U.S. Solar Market Trends 2008" (PDF). Interstate Renewable Energy Council (IREC). Archived from the original (PDF) on November 23, 2009. Retrieved July 24, 2010.
  39. Sherwood, Larry (August 2008). "U.S. Solar Market Trends 2007" (PDF). Interstate Renewable Energy Council (IREC). Retrieved July 24, 2010.[ permanent dead link ]
  40. Sherwood, Larry (July 2009). "U.S. Solar Market Trends 2008" (PDF). Interstate Renewable Energy Council (IREC). p. 16. Archived from the original (PDF) on November 23, 2009. Retrieved July 24, 2010.
  41. Sherwood, Larry (July 2012). "U.S. Solar Market Trends 2012" (PDF). Interstate Renewable Energy Council (IREC). p. 16. Archived (PDF) from the original on October 12, 2013. Retrieved October 11, 2013.
  42. Sherwood, Larry (July 2014). "U.S. Solar Market Trends 2013" (PDF). Interstate Renewable Energy Council (IREC). Archived (PDF) from the original on October 21, 2014. Retrieved September 26, 2014.
  43. "Oregon Solar". Solar Energy Industries Association (SEIA). Retrieved May 6, 2020.
  44. "Electricity Data Browser". U.S. Department of Energy. March 28, 2018. Retrieved October 1, 2021.